Introduction - Destinations of Leavers Longitudinal survey 2010/11
This report presents findings from the Destinations of Leavers from Higher Education Longitudinal (DLHE Longitudinal) Survey conducted during winter 2014/15. The survey was carried out among the cohort of students who completed a higher education course at a higher education provider (HEP) in the UK in 2010/11. The aim of the survey was to collect information on the activities of UK and EU domiciled leavers approximately 3.5 years after leaving higher education. It is a biennial survey that was first conducted for the cohort of leavers from 2002/03. From 2012/13, the HESA constituency includes all UK publicly funded higher education institutions (HEIs) and a number of alternative providers (APs), collectively referred to as higher education providers (HEPs). This release, as in previous years, contains information regarding only the HEI element of this constituency plus one AP, The University of Buckingham, and therefore uses the term ‘higher education providers (HEPs)’.
The Destinations of Leavers from Higher Education (DLHE) survey is a census of individuals who have completed higher education courses in the UK. This is carried out approximately six months after the courses end and is referred to as the Early DLHE Survey. The data capture is undertaken by HEPs but the procedure is prescribed by the Higher Education Statistics Agency (HESA), the central source for the collection and dissemination of statistics about publicly funded higher education in the UK.
The DLHE Longitudinal Survey, by contrast, is not a census survey but is instead based on a sample of the students who responded to the corresponding Early DLHE Survey. Leavers who completed an Early DLHE Survey questionnaire are invited to take part in a follow-up survey 3.5 years after they qualified. Of the 342,980 leavers who responded to the Early DLHE Survey in 2010/11 and were eligible to take part in the DLHE Longitudinal survey, 31,145 leavers had opted out of any follow-up surveys and were excluded from the population, leaving a population of 311,835. Leavers were split into two groups, Sample A and Sample B. Sample A was designed to over-sample key sub-groups to ensure sufficient numbers were available for onward statistical analyses. This sample consists of 121,930 leavers who were randomly selected to satisfy the oversampling criteria, the remaining 189,910 leavers make up Sample B. More details of the groups over-sampled are given in the definitions section.
The table below provides information on the availability of contact details and response rates for each sample. For Sample A, leavers were contacted by email, telephone or post whereas for Sample B only email and text message invitations were sent. As in previous surveys, Sample A and Sample B have been combined for onward analysis. Of the leavers who responded, 10 replied to the survey but the responses were not sufficiently complete in order to be counted as valid and have been excluded from all further analysis. The survey asked a wide range of questions about the activities leavers were undertaking on 24 November 2014. Further information about the sample design and survey methodology are provided in the definitions section.
| Sample | Selected | Available contact details | Respondents | Response rate |
| A | 121,930 | 118,695 | 52,775 | 44.5% |
| B | 189,910 | 177,320 | 28,875 | 16.3% |
| Total | 311,835 | 296,015 | 81,650 | 27.6% |
Report structure and conventions
Throughout the report, references are made to tables; this series of Excel tables can be downloaded individually from the links within this introduction or as an entire set from the contents page.
Throughout the report 2010/11 refers to the cohort who qualified from higher education in 2010/11, took part in the Early DLHE Survey six months later and then answered questions about their activities on 24 November 2014 as part of the DLHE Longitudinal Survey.
Certain groups of students were oversampled to ensure sufficient numbers for meaningful onward analysis. To account for the oversampling, all responses have been weighted and these weights have been used to create the data in this report. More details on the weights and sampling criteria can be found in the definitions section.
Base numbers shown in the tables and charts represent weighted populations of leavers who answered particular questions in the survey, hence these may differ between charts and tables. Base numbers have been rounded to the nearest multiple of 5.
Percentages have been calculated on weighted data, but have been suppressed (and shown as ‘..’ in tabulations) if the unweighted underlying population is less than 22.5. Percentages in charts and tables have been rounded to one decimal place, therefore percentages may not sum to exactly 100%.
Overview
Chart 1 below illustrates the trends in the main activities of leavers 3.5 years after leaving HE collected in the past five DLHE Longitudinal Surveys (sourced from Table 1). The percentage of leavers working (either full-time paid work including self-employed, part-time paid work, voluntary work or unpaid work) at the survey date has increased from 80.8% for 2006/07 leavers to 82.4% for 2010/11, similar to the percentage observed in the 2004/05 survey (82.8%). This time series should not be analysed without consideration to the economic climate during the reporting period of the DLHE Longitudinal Surveys.
The proportion of leavers assumed to be unemployed has decreased from 3.4% in 2008/09 to 2.7% in 2010/11. The percentage of leavers engaged only in further study had gradually increased throughout the years, showing its first reduction this year decreasing from 7.0% in 2008/09 to 6.4%. The activity ‘Creating a portfolio’ (developing a professional portfolio or creative practice with a view to starting a business/becoming freelance) was added to the questionnaire in 2006/07 and the proportion with this as their main activity increased from 0.4% in 2006/07 to 0.8% in 2008/09 and 1.0% in 2010/11. In all charts, leavers ‘Creating a portfolio’ have been grouped in ‘All other’ along with leavers ‘Not available for employment’ and ‘Other’.
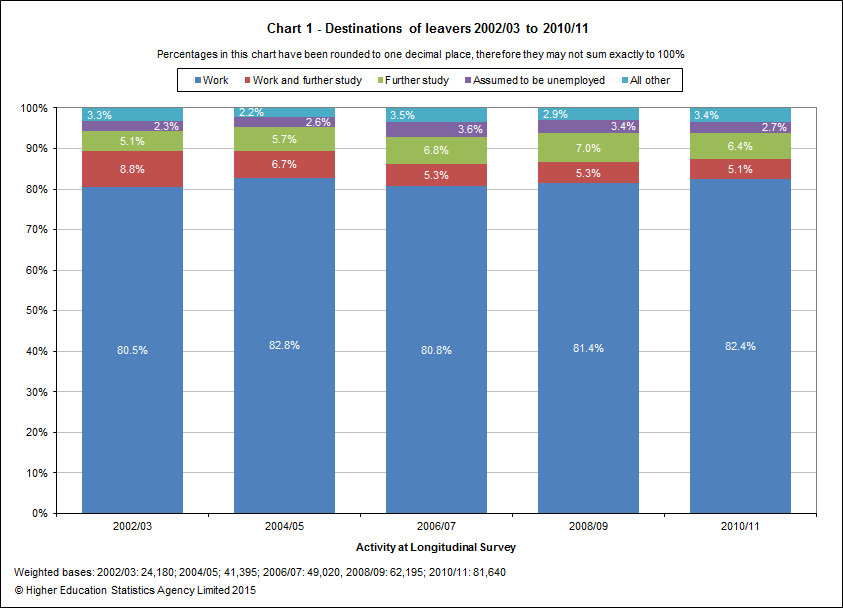
Chart 2 (sourced from Table 1) provides a more complete split of leavers’ main activities and compares the responses of UK domiciled and other EU domiciled leavers. UK domiciled leavers were more likely to be employed part-time or in voluntary/unpaid work (9.5% of UK leavers compared to 6.5% of EU leavers) but less likely to be engaged only in further study (6.0% of UK leavers compared to 11.4% of EU leavers). Table 1 provides a more detailed breakdown of activities by level of qualification obtained in 2010/11. Table 1a presents the same time series of data but shows subject area in relation to activity at each of the DLHE Longitudinal surveys.
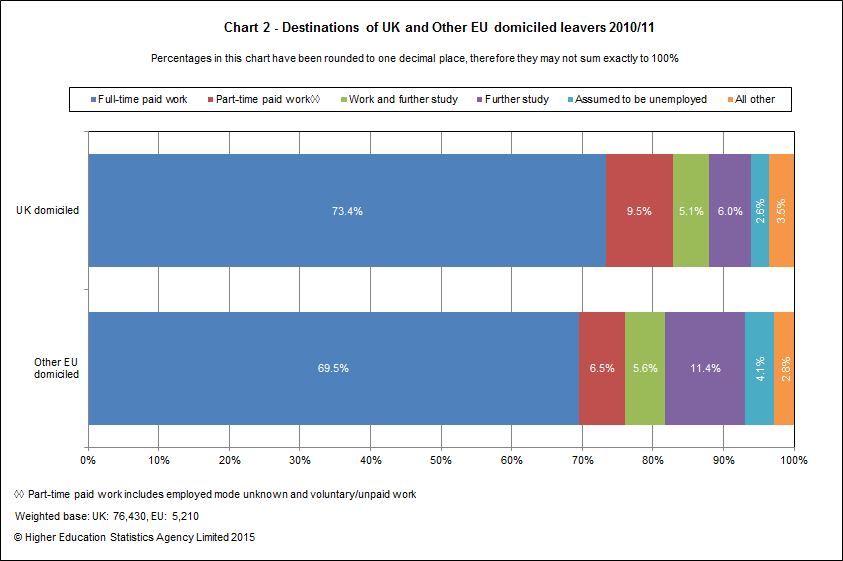
Table 2 shows the differences in activities of leavers by the region of the HE provider they attended, domicile and level of qualification. Among UK domiciled leavers, those who studied in the East Midlands and South West were more likely to be in full-time paid work (77.5% and 76.8% respectively) than those from other regions.
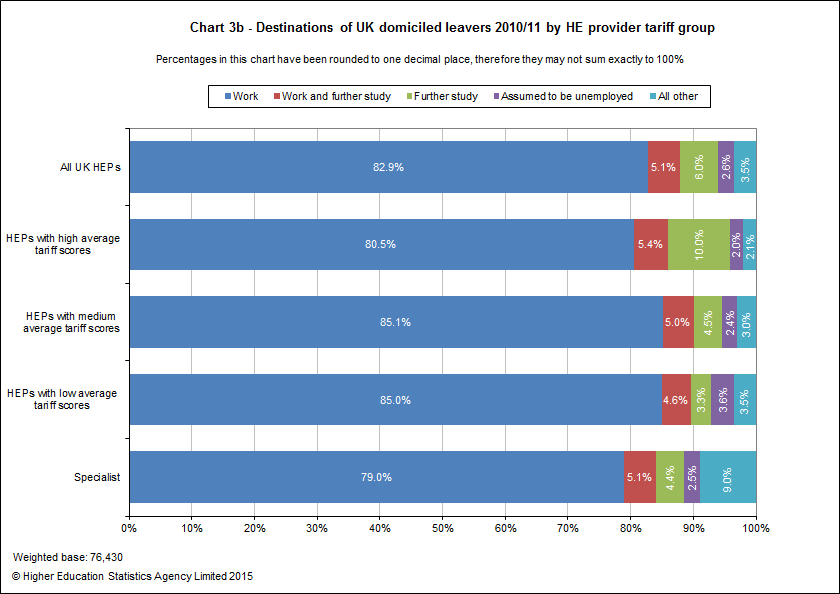
Many HE providers in the UK belong to HE provider 'mission groups' which are self-selected groups based on a level of common interests or commonality of overall mission. Due to the sample sizes of the DLHE Longitudinal Survey, numbers of responses are often too small to be analysed by individual HE provider. Although imperfect as a basis for aggregating data, mission groups represent a convenient means of presenting data at a more granular level than for the whole HE sector and are at least recognised groups by many users of HE data. Another more data-driven way of grouping 'similar' HE providers is by using average tariff scores or subject profiles combined with average tariff scores held by students on entry to HE. Charts 3a and 3b (sourced from Table 2a) compare the main activities of UK domiciled leavers by the mission group and the tariff group of the HE provider they attended in 2010/11.
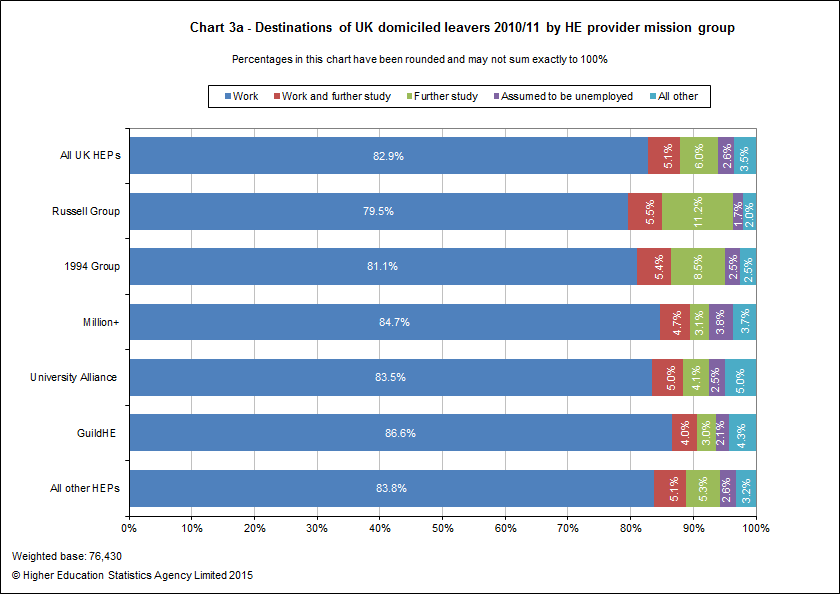
The percentage of leavers engaged only in further study was much higher for those who had studied at a Russell Group (11.2%), 1994 Group (8.5%) or a HE provider with high average tariff scores (10.0%). Comparisons between mission groups should be interpreted with care due to differences in student populations and the overall characteristics of HE providers in each group.
Differences in the main activities of leavers were apparent when analysed by other characteristics as illustrated in Table 3a. For all leavers responding, there was a higher percentage of male leavers in full-time paid work (77.0%) compared to female leavers (70.5%), however female leavers were less likely to be unemployed, 2.3% compared to 3.3% of male leavers. Those who studied part-time were more likely to be in part-time work (12.0%) than those who studied full-time (6.8%). Across all levels, other undergraduate leavers had the lowest proportion of leavers in full-time paid work (67.6%) but the highest percentage of leavers in part-time paid work (12.9%). First degree leavers were the most likely to be engaged only in further study (7.3%) than those who studied at other levels.
Activities of UK domiciled leavers are provided by level of qualification, mode of study and age group in Table 3b, by level of qualification, mode of study and ethnicity in Table 3c, by level of qualification, mode of study and disability in Table 3d and by mode of study, sex and class of first degree in Table 4.
Chart 4 compares the activities of UK domiciled leavers on 24 November 2014 with the activity they were doing at the Early Survey (sourced from Table 5). Across all activities at the Early Survey stage, the majority of leavers were working (either full-time or part-time) 3 years later. Over four-fifths (83.6%) of those who were in full-time paid work at the Early Survey were also in full-time work on 24 November 2014. 62.9% of those who were assumed to be unemployed at the Early Survey were in full-time paid work on 24 November 2014. Of those leavers in part-time or voluntary work at the Early Survey, 22.2% were still in such work 3 years later. It should be noted that the category 'All other' includes leavers who were not available for employment, creating a portfolio and activities such as taking time out to travel.
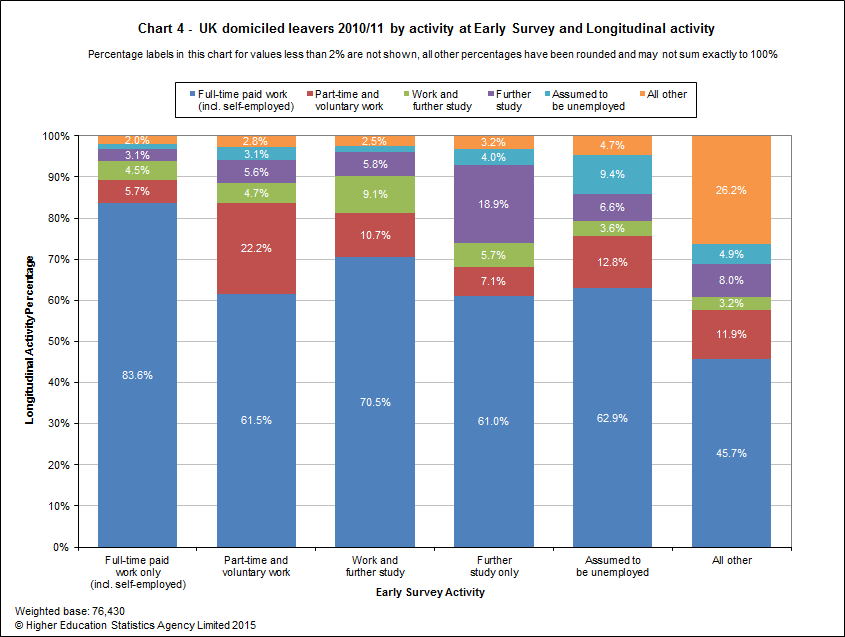
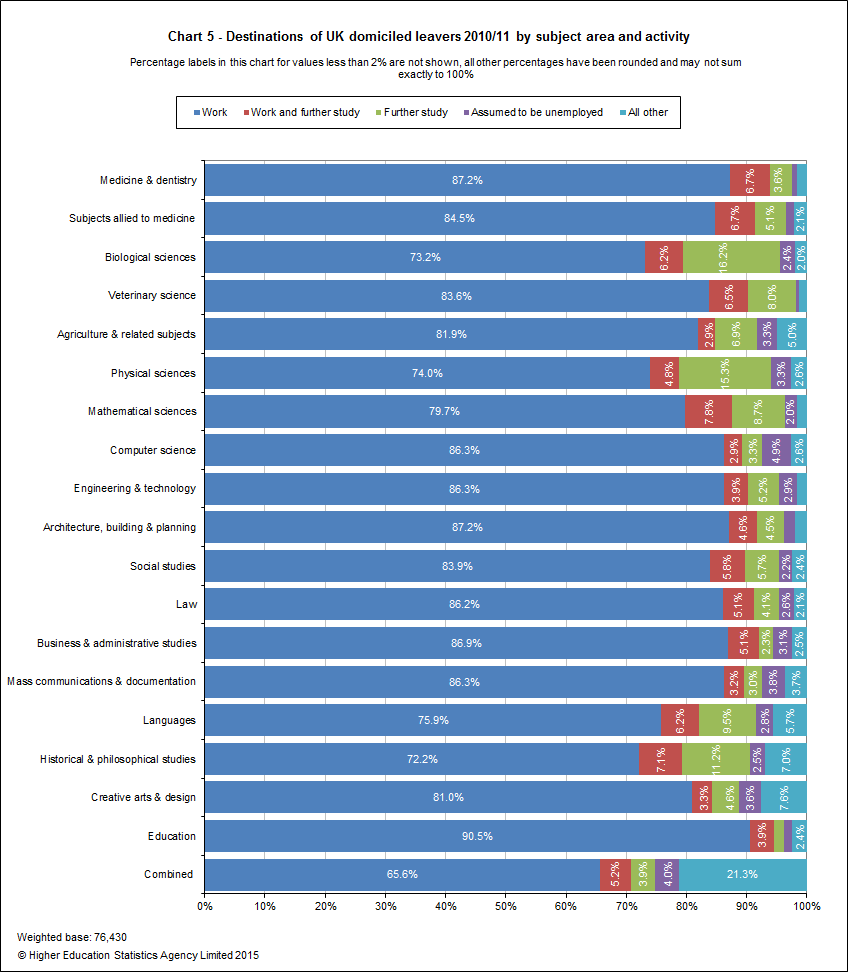
Chart 5 illustrates the activities of UK domiciled leavers by the subject area of the qualification they obtained in 2010/11 (sourced from Table 6). Leavers who studied Education were most likely to be working at the survey date with 90.5% in work. Veterinary science leavers were the least likely to be unemployed (0.5%) followed by Medicine & dentistry leavers (0.8%). The highest percentage of leavers who were engaged only in further study were those who studied Biological sciences (16.2%) followed by Physical sciences (15.3%). Further details of activities by subject area and level of qualification are provided in Table 6 which shows that the highest percentage of leavers indicating they were creating a portfolio were those who studied Creative arts & design (4.2%).
UK Leavers in Employment
This section focuses on UK domiciled leavers who were employed (including those who were working and studying) on 24 November 2014. Table 7a and Table 7b provide detailed breakdowns of the Standard Industrial Classifications (SIC) of employed leavers by their subject and level of qualification obtained in 2010/11 for full-time and part-time leavers respectively. Nearly a quarter, 24.0%, of all full-time leavers and 29.5% of all part-time leavers in employment were employed in Education, while a further 15.6% of full-time and 24.2% of part-time leavers were working in Human health and social work activities. As one might anticipate, the industries that leavers were employed in varied by subject area with the majority of leavers in certain subjects working in industries related to their qualification. 88.3% of employed full-time Medicine & dentistry leavers and 75.1% of employed full-time leavers from Subjects allied to medicine were working in Human health and social work activities. Similarly 85.7% of employed full-time Education leavers were working in Education.
Table 8 provides a similar breakdown to Table 7 of these leavers by their Standard Occupational Classification (SOC). 80.5% of UK domiciled leavers in employment were in a type of 'Professional' occupation comprising of 'Managers, directors and senior officials', 'Professional occupations' and 'Associate professional and technical occupations'. These proportions vary by the subject and level of qualification obtained in 2010/11. The proportion of all leavers in 'Professional' occupations is higher when restricted to leavers from science subject areas (85.3%). Of employed postgraduate leavers, 92.6% were in ‘Professional’ occupations compared to 77.4% of first degree leavers and 73.9% of other undergraduate leavers.
Table 9 provides a breakdown of Standard Industrial Classification and Standard Occupational Classification for employed leavers. The percentage of leavers in 'Professional' occupations varied by industry with 91.1% of Professional, scientific and technical leavers compared with only 46.6% of Accommodation and food service activities leavers.
Chart 6 compares leavers' Standard Industrial Classification at the Early Survey with their Standard Industrial Classification at the Longitudinal Survey (sourced from Table 10). 81.3% of leavers who were in Education at the Early Survey stayed in Education and 75.7% of leavers in Human health and social work activities stayed in this classification. However, only 19.7% Accommodation and food service activities leavers stayed within Accommodation and food service activities.
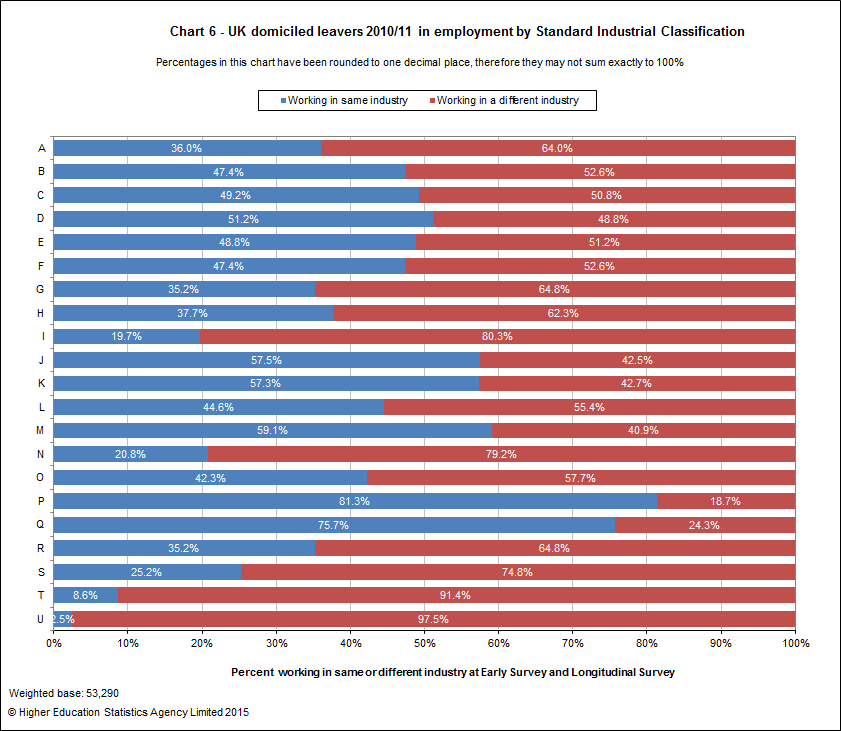
Key for Chart 6 above:
- A Agriculture, forestry and fishing
- B Mining and quarrying
- C Manufacturing
- D Electricity, gas, steam and air conditioning supply
- E Water supply, sewerage, waste management and remediation activities
- F Construction
- G Wholesale and retail trade; repair of motor vehicles and motorcycles
- H Transport and storage
- I Accommodation and food service activities
- J Information and communication
- K Financial and insurance activities
- L Real estate activities
- M Professional, scientific and technical activities
- N Administrative and support service activities
- O Public administration and defence; compulsory social security
- P Education
- Q Human health and social work activities
- R Arts, entertainment and recreation
- S Other service activities
- T Activities of households as employers; undifferentiated goods- and services-producing activities of households for own use
- U Activities of extraterritorial organisations and bodies.
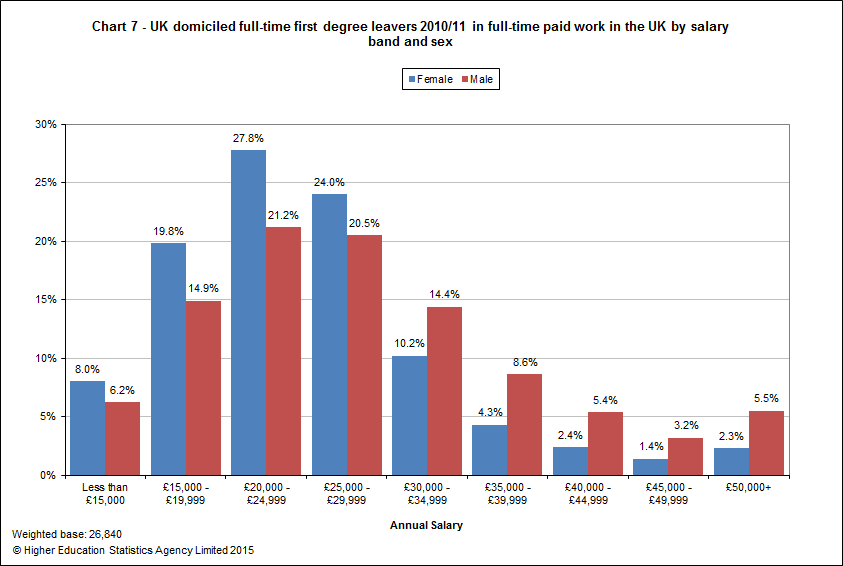
Chart 7 above displays the salary distribution of UK domiciled full-time first degree leavers who were in full-time paid employment in the UK (sourced from Table 11a). The median salary for UK domiciled full-time first degree female leavers was £24,000 which had increased from £18,500 at the Early Survey stage. It should be noted that median salaries have been calculated to the nearest £500. UK domiciled full-time first degree male leavers experienced a similar increase from a median salary of £20,000 at the Early Survey stage to £26,000 reported on 24 November 2014. Further detailed salary figures can be viewed in Table 11a. Table 11b shows similar salary information disaggregated by subject and level of qualification obtained in 2010/11. Across all first degree leavers the largest median salary was observed for UK domiciled leavers in full-time employment who had studied Medicine & dentistry (£40,000) which had increased from £30,000 at the Early Survey stage, a 33.3% increase.
Table 11c provides salary growth information for UK domiciled leavers in full-time paid UK employment in both surveys. At all levels of qualification, the most common salary increase was between £2,500 and £5,000 (22.0% of postgraduate, 19.2% of first degree and 26.0% of other undergraduate). In contrast to this, 3.7% of postgraduate leavers, 3.7% of first degree leavers and 6.8% of other undergraduate leavers experienced a salary decrease of up to £2,500.
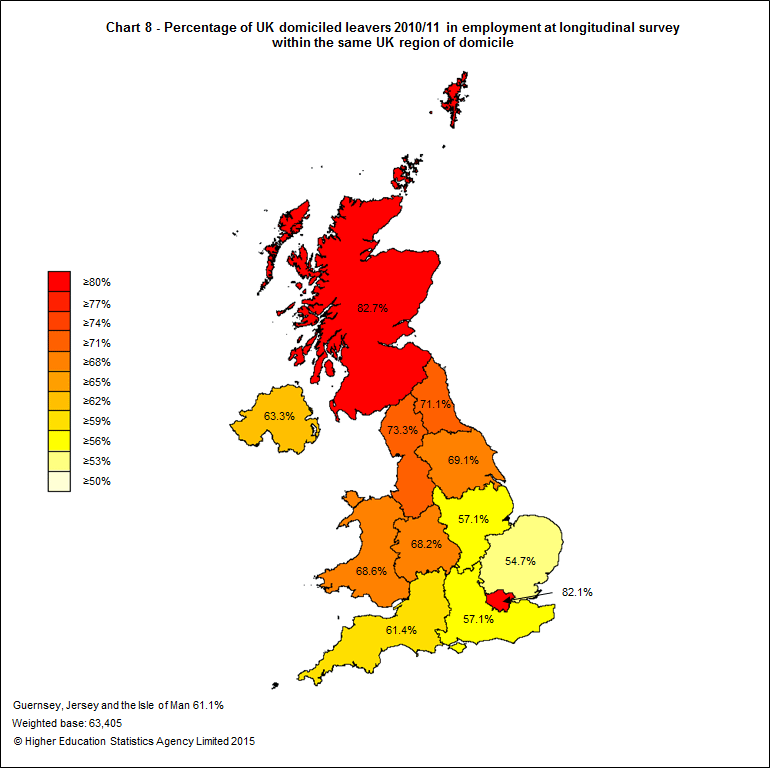
Comparing leavers’ responses to their Early DLHE Survey activities enables analysis of the movement of leavers across UK regions. Chart 8, Chart 9 and Chart 10 are heat maps which show the percentages of UK domiciled leavers in UK employment in the same region as their domicile on entering HE, region of HE provider and region of employment at the Early DLHE Survey. These are sourced from Table 12, Table 13, and Table 14 which also show the regions leavers are moving to by level of qualification.
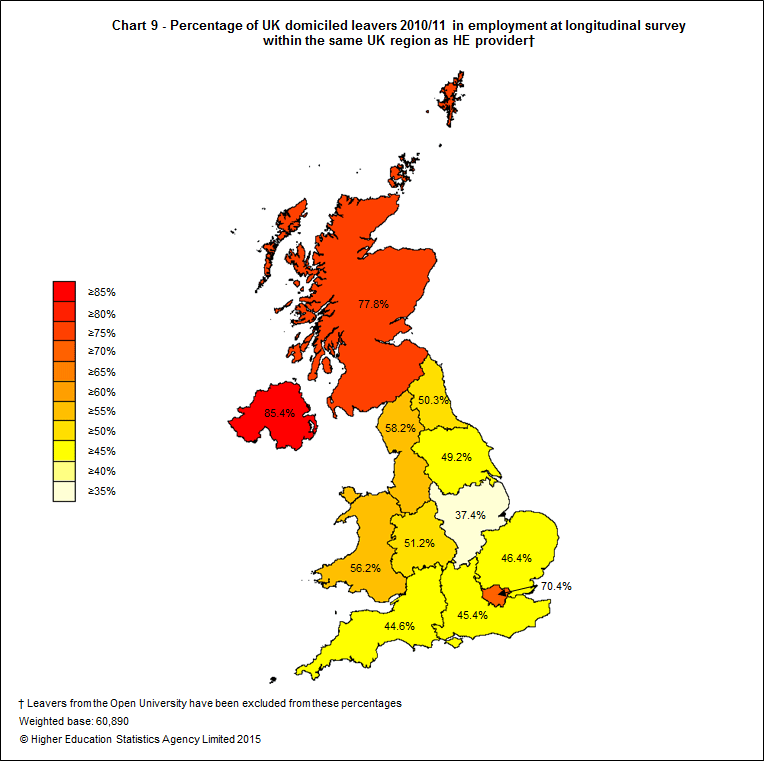
Chart 9 shows the variation across the regions for the percentages of leavers who were working in the same region where they had studied 3.5 years earlier. The highest percentage was observed in Northern Ireland (85.4%) and the lowest in the East Midlands (37.4%). 17.9% of the leavers from HEPs in the East Midlands were working in London by the DLHE Longitudinal date.
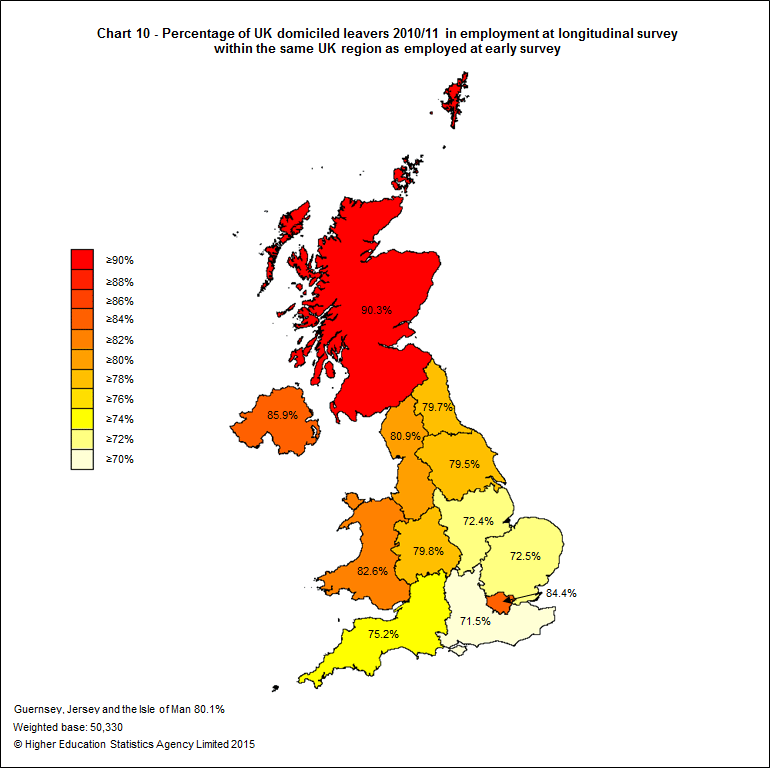
Chart 10 shows there was also movement of leavers between regions for those who were in UK employment at the Early and Longitudinal survey dates. Of the UK domiciled leavers who were employed in Scotland at the Early survey 90.3% were still working there 3 years later. In comparison, less than three quarters of those who were working in the South East (71.5%) stayed in that region with 15.2% moving to work in London.
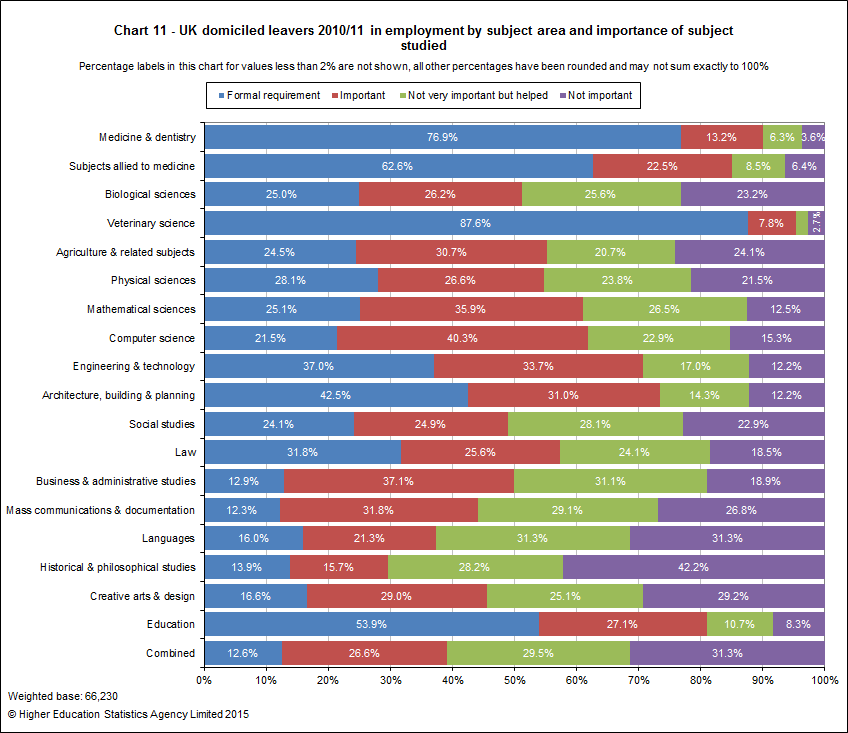
All leavers in employment on 24 November 2014 were asked to consider how important they felt certain factors about the course they undertook were to their employer when gaining the job they were doing on the census date. Table 15 provides a break down of the responses to these questions by level of qualification and subject area. Generally, leavers indicated that the type of qualification they gained and the subject studied were either a formal requirement or were important to their employer. 34.0% of UK domiciled leavers in employment indicated that the type of qualification they gained was a formal requirement and a further 28.5% indicated that it was important. Similarly 31.0% indicated that the subject they studied was a formal requirement and a further 27.9% that it was important. Leavers also indicated that evidence of skills and competencies was more important than the class or grade of qualification (35.3% formal requirement and 47.1% important versus 13.0% and 30.3% respectively). Chart 11 below shows leavers’ responses to the question about how important their subject of study was to their employer by the subject they studied. Leavers who studied more vocationally-orientated subjects were much more likely to indicate that the subject was a formal requirement when gaining their job than those who studied subjects with less specific career pathways.
Further Study (including work and further study)
Of all leavers who responded to the survey, 5.1% were engaged in work and further study and an additional 6.4% were only in further study on 24 November 2014. Chart 12 below shows the level of qualification that first degree leavers were aiming for (sourced from Table 16). Nearly a third of first degree leavers were aiming for a higher degree mainly by research (29.6%).
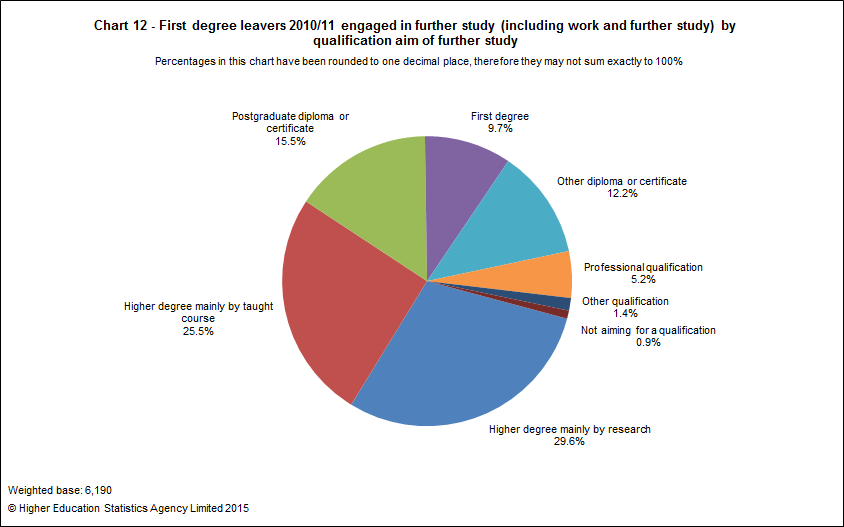
When analysed by various factors, differences are apparent in the qualification aims of leavers who were engaged in further study (including work and further study) which can be seen in Table 16. The majority of postgraduate taught leavers (63.1%) were aiming for a higher degree mainly by research and 33.9% of other undergraduate leavers were aiming for a first degree. There were also differences by region of HE provider attended in 2010/11 and HE provider group. HE providers in Northern Ireland have the highest percentage of leavers aiming for a higher degree mainly by research (43.2%) and a professional qualification (12.5%) whereas HE providers in Wales and England had the highest proportions of leavers going on to study for a higher degree mainly by taught course (23.7% and 22.9%, respectively).
Leavers from Russell Group HE providers were most likely to be studying for a higher degree mainly by research (54.0%). The largest percentage of leavers going on to study for professional qualifications was observed amongst those who had studied at Million+ HE providers (14.0%).
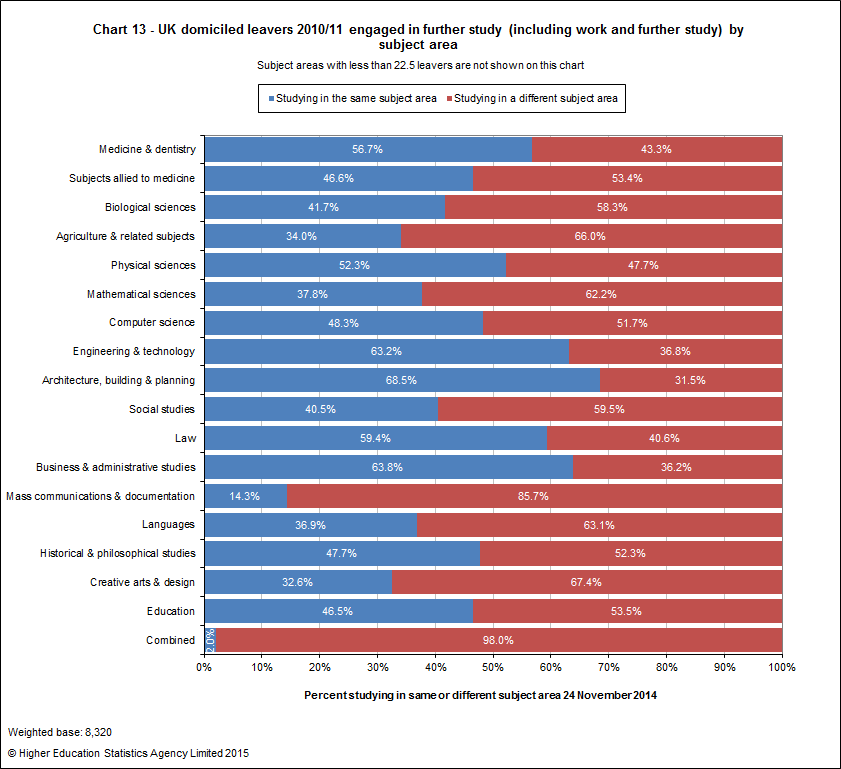
For all those leavers in either further study or work and further study, Chart 13 above (sourced from Table 17) compares the subject area of the qualification obtained by UK domiciled leavers in 2010/11 with the subject area that they were studying on 24 November 2014. Over two-thirds (68.5%) of Architecture, building & planning leavers who were engaged in further study (including work and further study) were studying in the same subject area 3.5 years later. It should be noted that it is a requirement to complete a further qualification before leavers become qualified architects. Only 14.3% of leavers from Mass communications & documentation continued to study this subject area 3.5 years later. The most common subject area for further study (including work and further) was Education (13.8%) which attracted varying proportions from subject areas other than Education, most notably 23.4% of Creative arts & design leavers were studying Education as were 23.0% of Mass communications & documentation leavers.
All leavers were asked about any further qualifications that they had obtained since the qualification they gained in 2010/11. 27,710 leavers indicated that they had gone on to achieve another qualification. Chart 14 below summarises these responses by the level of the qualifications obtained (sourced from Table 18).
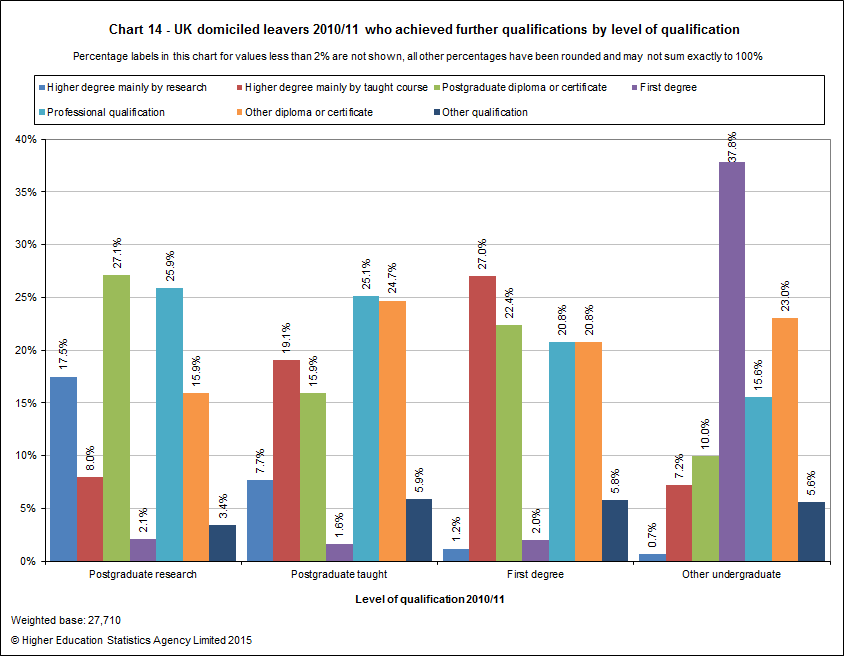
Over a third of other undergraduate leavers (37.8%) who went on to obtain another qualification since 2010/11 had gained a first degree. Chart 14 also highlights that around a fifth of leavers who obtained a first degree or higher then went on to gain some type of professional qualification. Table 18 provides more detail by level of qualification, sex and HE provider group and region.
Satisfaction and Higher Education experience
The final section of the questionnaire asked all leavers a set of questions about their experience of higher education and their satisfaction with their career to date. Chart 15 below summarises leavers’ responses to a question about how likely it was that they would change aspects of the course that they completed in 2010/11 (sourced from Table 19). Leavers were asked to consider the subject of study, the HE provider, the qualification type and whether they would chose to do something other than study or research.

In general leavers felt that it was ‘Not very likely’ or ‘Not likely at all’ that they would change the course that they completed in 2010/11, which was similar to the percentages reported in the 2008/09 DLHE Longitudinal . Table 19 provides a more detailed breakdown of these responses by level of qualification, sex, HE provider group and subject area. The most variation in responses was observed when analysed by subject area.
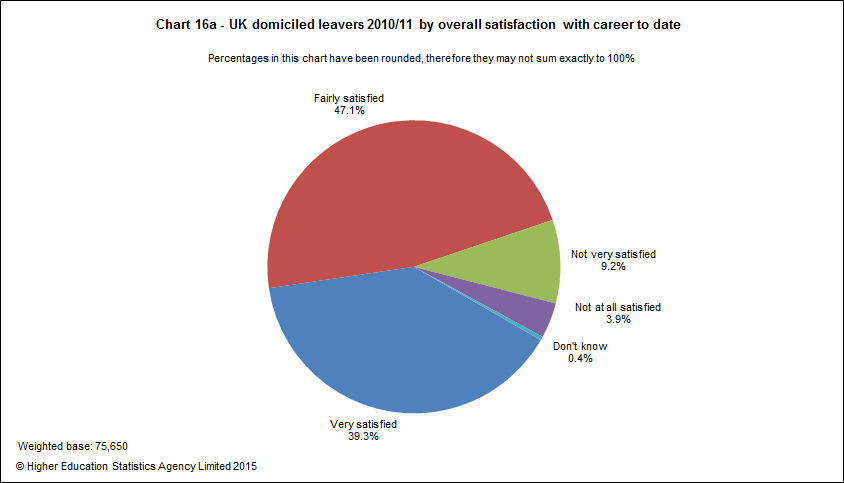
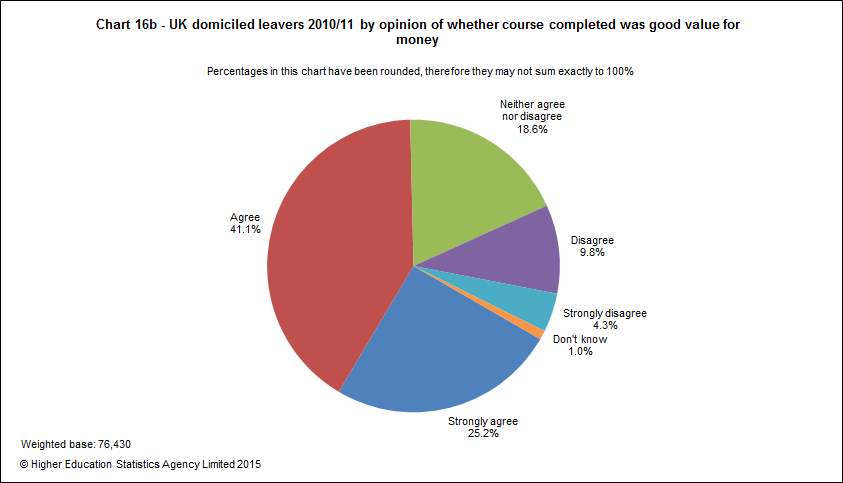
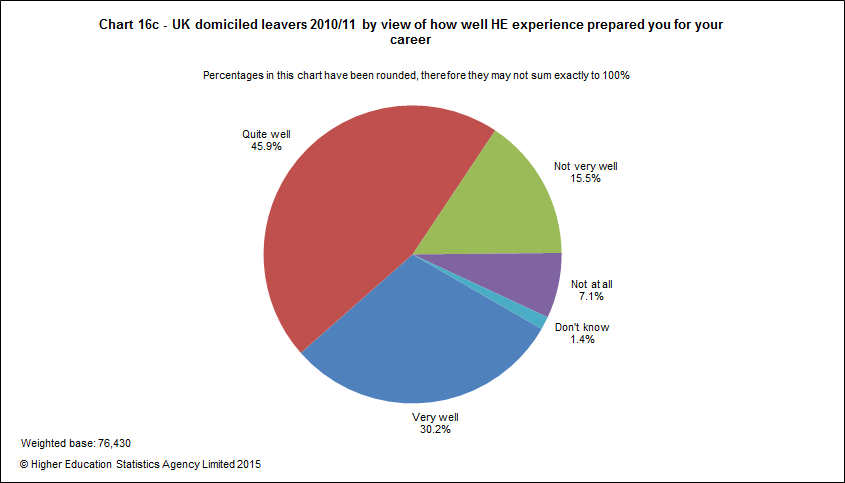
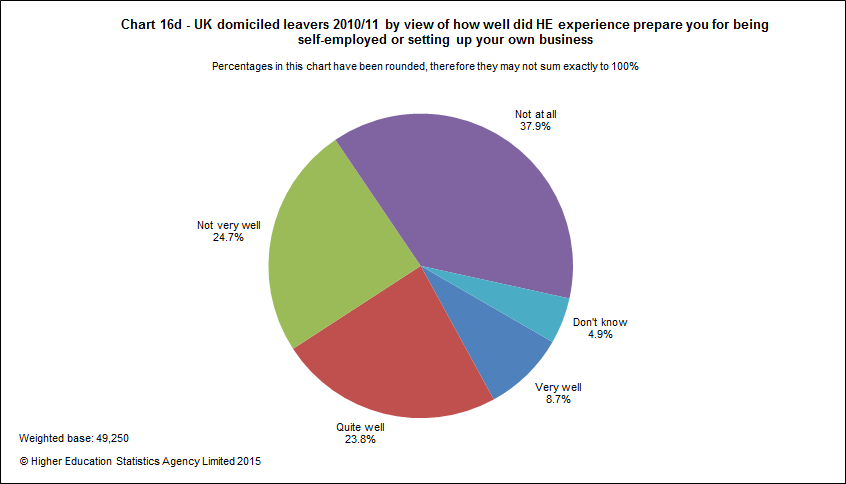
Chart 16 below (sourced from Table 20 and Table 21) displays the responses to the questions about whether or not leavers were satisfied with their career to date, their views about whether or not their course was good value for money and if their higher education experience prepared them for their career or for being self-employed. Table 20 and Table 21 provide more detail of leavers' opinions by level of qualification, sex, subject of qualification and activity on 24 November 2014.
For all questions the most variation in responses was observed across subject areas and activities on the survey date. In general female leavers were slightly more likely to say they were ‘Very satisfied’ with their career to date, 40.3%, compared to male leavers, 37.9%, although 48.6% of male leavers said they were ‘Fairly satisfied’ compared to 46.1% of female leavers.
An additional set of questions were added to the survey asking leavers the extent to which their higher education experience had enabled them to be innovative in the workplace, solve problems at work, communicate effectively at work, make good decisions at work, work effectively with others, take initiative and personal responsibility at work, make effective use of information and communication technology at work and work effectively with numbers. Table 22 provides the responses to these questions by level of qualification, sex, HE provider group, subject area and activity. 42.4% of leavers felt their HE experience had enabled them to take initiative and personal responsibility in their work to a great extent and 39.7% felt their HE experience enabled them to a great extent to communicate effectively at work.
