Using Census data to generate a UK-wide measure of disadvantage
Expand this box for more information.
Further work on our measure of disadvantage revealed an error in the generation of HESA measure deciles. Our output area files for England, Wales and Scotland contained statistics for higher level geographies (either local authorities, regions and/or countries), which had not been removed prior to the formation of the deciles.
HESA measure deciles have been recreated based on a total of 232,296 output areas (181,408 in England and Wales, 46,531 in Scotland and 4,537 in Northern Ireland). Around 1% of output areas changed from quintile 1 to a higher quintile or vice versa. Approximately 5% of output areas were affected when undertaking an analysis by decile. We have found the impact of this to be minimal and the conclusions of our research are not materially altered.
2022-05-11
Executive summary
Introduction
In all four countries of the UK, there is a desire for prosperity and growth to become more evenly distributed, alongside an ambition for continued progress in the levels of social mobility across society by ensuring there is equal opportunity for all. Governments in all four nations have outlined the importance of higher education providers in enabling those in disadvantaged communities to consider and access education (e.g. through more flexible modes of learning that are accessible throughout adulthood), so that they can make choices that allow them to achieve their full potential and contribute their skills within the local economy. Outreach and other widening participation activity have been highlighted as key initial steps in the process of achieving such objectives. However, existing measures used in this field (e.g. Participation of Local Areas (POLAR) and state school marker) vary in their relevance and usefulness among the home nations. Furthermore, despite the ability to compare statistics across domains being one of the pillars of quality outlined within the European Statistical System Quality Assurance Framework, there is currently a paucity of measures that adequately meet this aim.
While the potential benefits of individual-level information on disadvantage for the contextual admissions process have been highlighted in previous research (as well as the possible drawbacks of using area-based measures for such individual-level decisions), this does not preclude a need for area-based measures. Indeed, there are aspects of the widening participation agenda where drawing upon individual measures may not be possible or practical, such as forms of outreach work within disadvantaged communities. Furthermore, given current policy objectives around equality of opportunity and equitable growth, as well as the role that higher education is expected to play in achieving these aims, it is important for providers to be able to identify those areas that would be most beneficial to support. In such instances, appropriate area-based measures can be helpful in enabling providers to pinpoint the localities in which they should prioritise their outreach activities.
As a statistics producer, HESA aspires to regularly assess the value of the data we supply to users. In line with our strategic and statutory ambitions, the principal purpose of this study is to utilise Census 2011 to develop an area-level measure of socioeconomic disadvantage that has UK-wide applicability and the potential to support decision-making among our data users in ways such as those set out in the previous paragraph. It is not intended that this variable should be utilised in an individual setting, such as contextualised admissions, for which there are more suitable indicators beginning to emerge within the sector, which we highlight in this report.
Our measure of disadvantage
The smallest geographic domain at which Census data is released to the public is output area level (or ‘small areas’ in Northern Ireland). Such localities typically contain 125 households in England and Wales, with the corresponding figure being 160 in Northern Ireland. In Scotland, the number of households in an output area tends to range between 20 and 78. Using the key statistics disseminated about each output area in the UK, we are able to derive the following;
- Proportion of residents in an output area aged 16 and over with below level 4 qualifications
- Proportion of residents in an output area aged 16 to 74 in NSSEC groups 3 to 8 (those that couldn’t be classified were excluded from the calculation)
After highlighting why these two variables are suitable to incorporate in developing a measure of socioeconomic disadvantage, we explain the statistical rationale behind taking their average and ranking all 232,296 UK output areas on the basis of this calculation. Those areas that were situated within the bottom 20% (based on having the highest average proportions of residents with below level 4 qualifications/in occupations that fell within NSSEC groups 3 to 8) were identified as disadvantaged localities.
Comparing to POLAR and IMD – a subsequent assessment
One of the distinguishing features of this measure relative to both POLAR and the Indices of Multiple Deprivation (IMD) (irrespective of the nation being considered)[1] is that it relies on a smaller geographic territory. After deriving our variable, we proceed by conducting an exploration into how the composition of students in the 2011/12 academic year within the HESA Student record (corresponding to the year Census 2011 was collected) varies between (quintile 1 of) this new measure, POLAR and IMD. While POLAR is not in itself a measure of socioeconomic disadvantage, the initial research around it did indicate a correlation between the two. Additionally, with a number of universities using POLAR as part of their outreach work (e.g. as stated in their access and participation plans), we believe it is valuable to incorporate this into our investigation.
The examination illustrates how all three measures can have a part to play in supporting widening access, as well as the additional advantages our variable brings to complement existing area-level measures utilised within the sector. In particular, the measure is able to capture socioeconomic disadvantage more broadly across the UK and thereby overcome some of the known limitations of POLAR and IMD.
Below, we illustrate this through a series of maps. Using our population of interest (UK domiciled full-time first degree entrants aged 18-20 in the academic year 2011/12), we explore how the proportion of students from various localities differs across the three measures we investigate. This is done for each nation separately, with London additionally split out from the rest of England, given the lack of visibility of the capital in the national map.
A darker shade of blue indicates that a greater proportion of students in quintile 1 were domiciled in that part of the country, whereas a lighter shade shows the converse. A red area indicates that no students from that locality appeared in quintile 1 of the variable. Indeed, it is the lack of red areas in our measure that illustrates its potential to capture disadvantage across a greater span of the UK.
Our paper concludes by outlining limitations, as well as possible next steps in this programme of work.
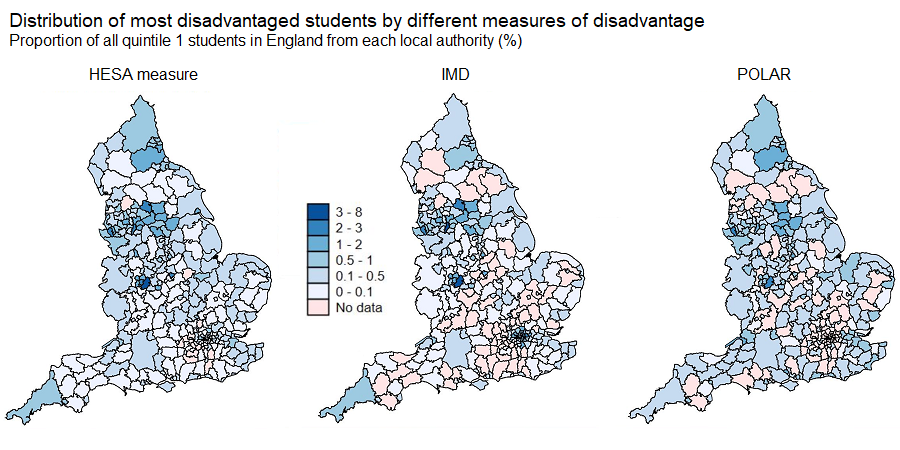
Map 1: Distribution of most disadvantaged students by different measures of disadvantage (England)
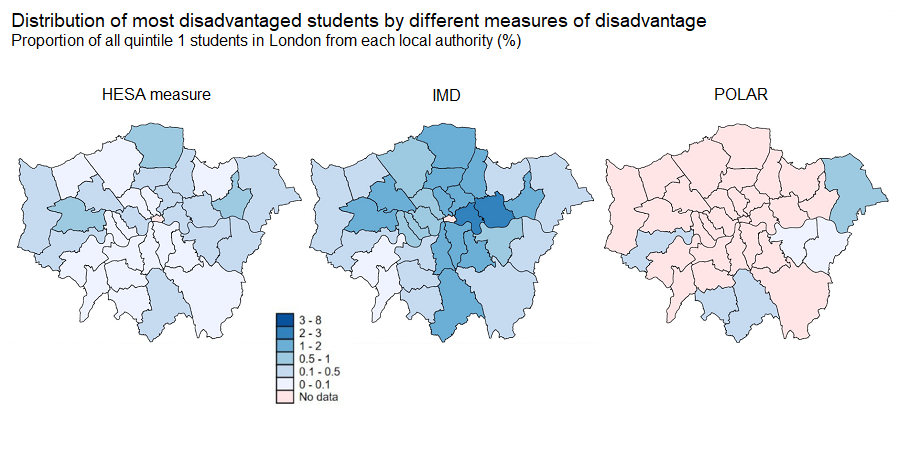
Map 2: Distribution of most disadvantaged students by different measures of disadvantage (London)
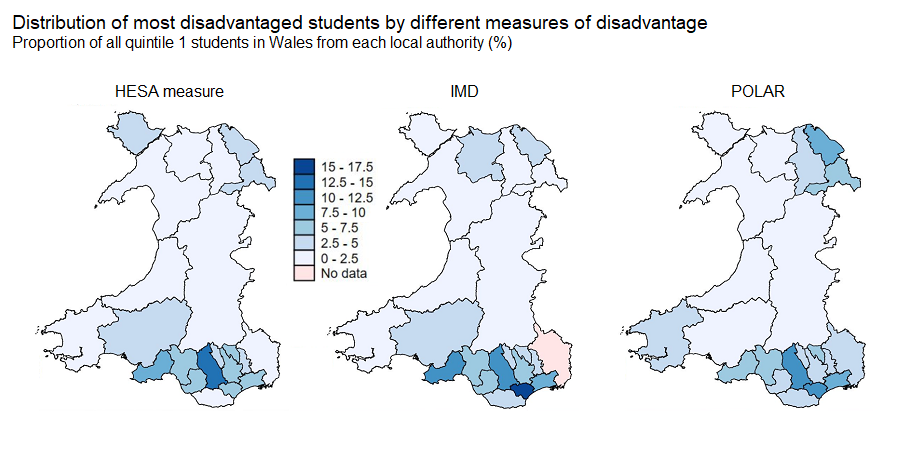
Map 3: Distribution of most disadvantaged students by different measures of disadvantage (Wales)
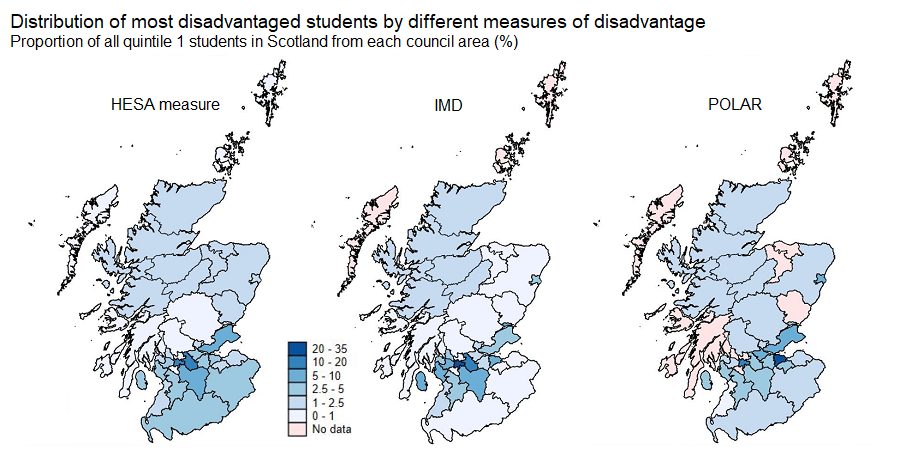
Map 4: Distribution of most disadvantaged students by different measures of disadvantage (Scotland)
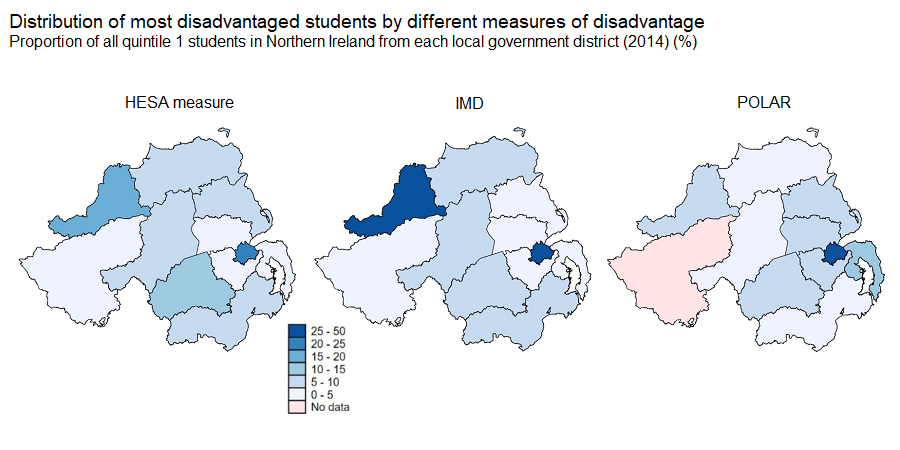
Map 5: Distribution of most disadvantaged students by different measures of disadvantage (Northern Ireland)
Next: 1. Introduction and policy context
[1] Each of the four nations adopt slightly different approaches in deriving IMD, hence this measure is country-specific.

Jenny Bermingham

Siobhan Donnelly

Tej Nathwani
Contents
- Executive summary
- 1. Introduction and policy context
- 2. Widening participation: What measures are available?
- 3. Data
- 4. The derivation of a new measure of disadvantage
- 5. Results
- 6. Further remarks and next steps
- Appendix 1: English domiciled entrants
- Appendix 2: Welsh domiciled entrants
- Appendix 3: Scottish domiciled entrants
- Appendix 4: Northern Irish domiciled entrants
