Using Census data to generate a UK-wide measure of disadvantage - Derivation
Expand this box for more information.
Further work on our measure of disadvantage revealed an error in the generation of HESA measure deciles. Our output area files for England, Wales and Scotland contained statistics for higher level geographies (either local authorities, regions and/or countries), which had not been removed prior to the formation of the deciles.
HESA measure deciles have been recreated based on a total of 232,296 output areas (181,408 in England and Wales, 46,531 in Scotland and 4,537 in Northern Ireland). Around 1% of output areas changed from quintile 1 to a higher quintile or vice versa. Approximately 5% of output areas were affected when undertaking an analysis by decile. We have found the impact of this to be minimal and the conclusions of our research are not materially altered.
2022-05-11
4. The derivation of a new measure of disadvantage
Prior to outlining our approach to developing a new area-based measure of disadvantage, it is perhaps useful at this stage to summarise the contribution we wish to make to this field. As well as the requirement for a UK-wide measure of disadvantage, current measures such as IMD and POLAR are argued to not sufficiently capture this in particular parts of the UK (as discussed in section 2 of this paper). Present policy objectives centre around equality of opportunity and ensuring nobody is left behind, alongside the desire for more even growth. As we note in section 1, higher education and/or employers have been highlighted as key mechanisms through which this can be achieved. In supporting these policy aims, providers are likely to implement outreach activity, which will often (but not always) be based in their local region. We have already highlighted that area-based measures of disadvantage have their merits in such a sphere, though this still leaves a need for providers to have access to data that assists them in identifying the disadvantaged communities in their locality, which may not always be possible with existing measures. As such, we believe it would be helpful for the higher education sector to have a UK-wide variable available to them that can complement existing measures by helping to overcome some of their known limitations.
The focus in this study is on socioeconomic disadvantage, so a natural question that arises is what Census data may best capture this and simultaneously help us with meeting the goals sketched out in the previous paragraph. In the UK, Section 1 of the Equality Act 2010 was never commenced by the national government, though both Scotland and Wales have introduced legislation around this in recent years.[1] Indeed, the consultation run within Scotland prior to its implementation illustrates the difficulty in trying to define socioeconomic disadvantage, though it is noted that low income/wealth, material deprivation (e.g. access to internet) and socioeconomic background (encompassing aspects such as parental education/employment) are all likely to play a part.[2] The UK Equalities Office also indicated the role of income/poverty in socioeconomic disadvantage, alongside other factors such as housing, education and family background.[3] As noted earlier, there is no income data contained within the Census, though car/home ownership do potentially offer an indication of wealth. Meanwhile, education and employment data can supply an insight into socioeconomic background, though there is little information available in the Census on material deprivation.
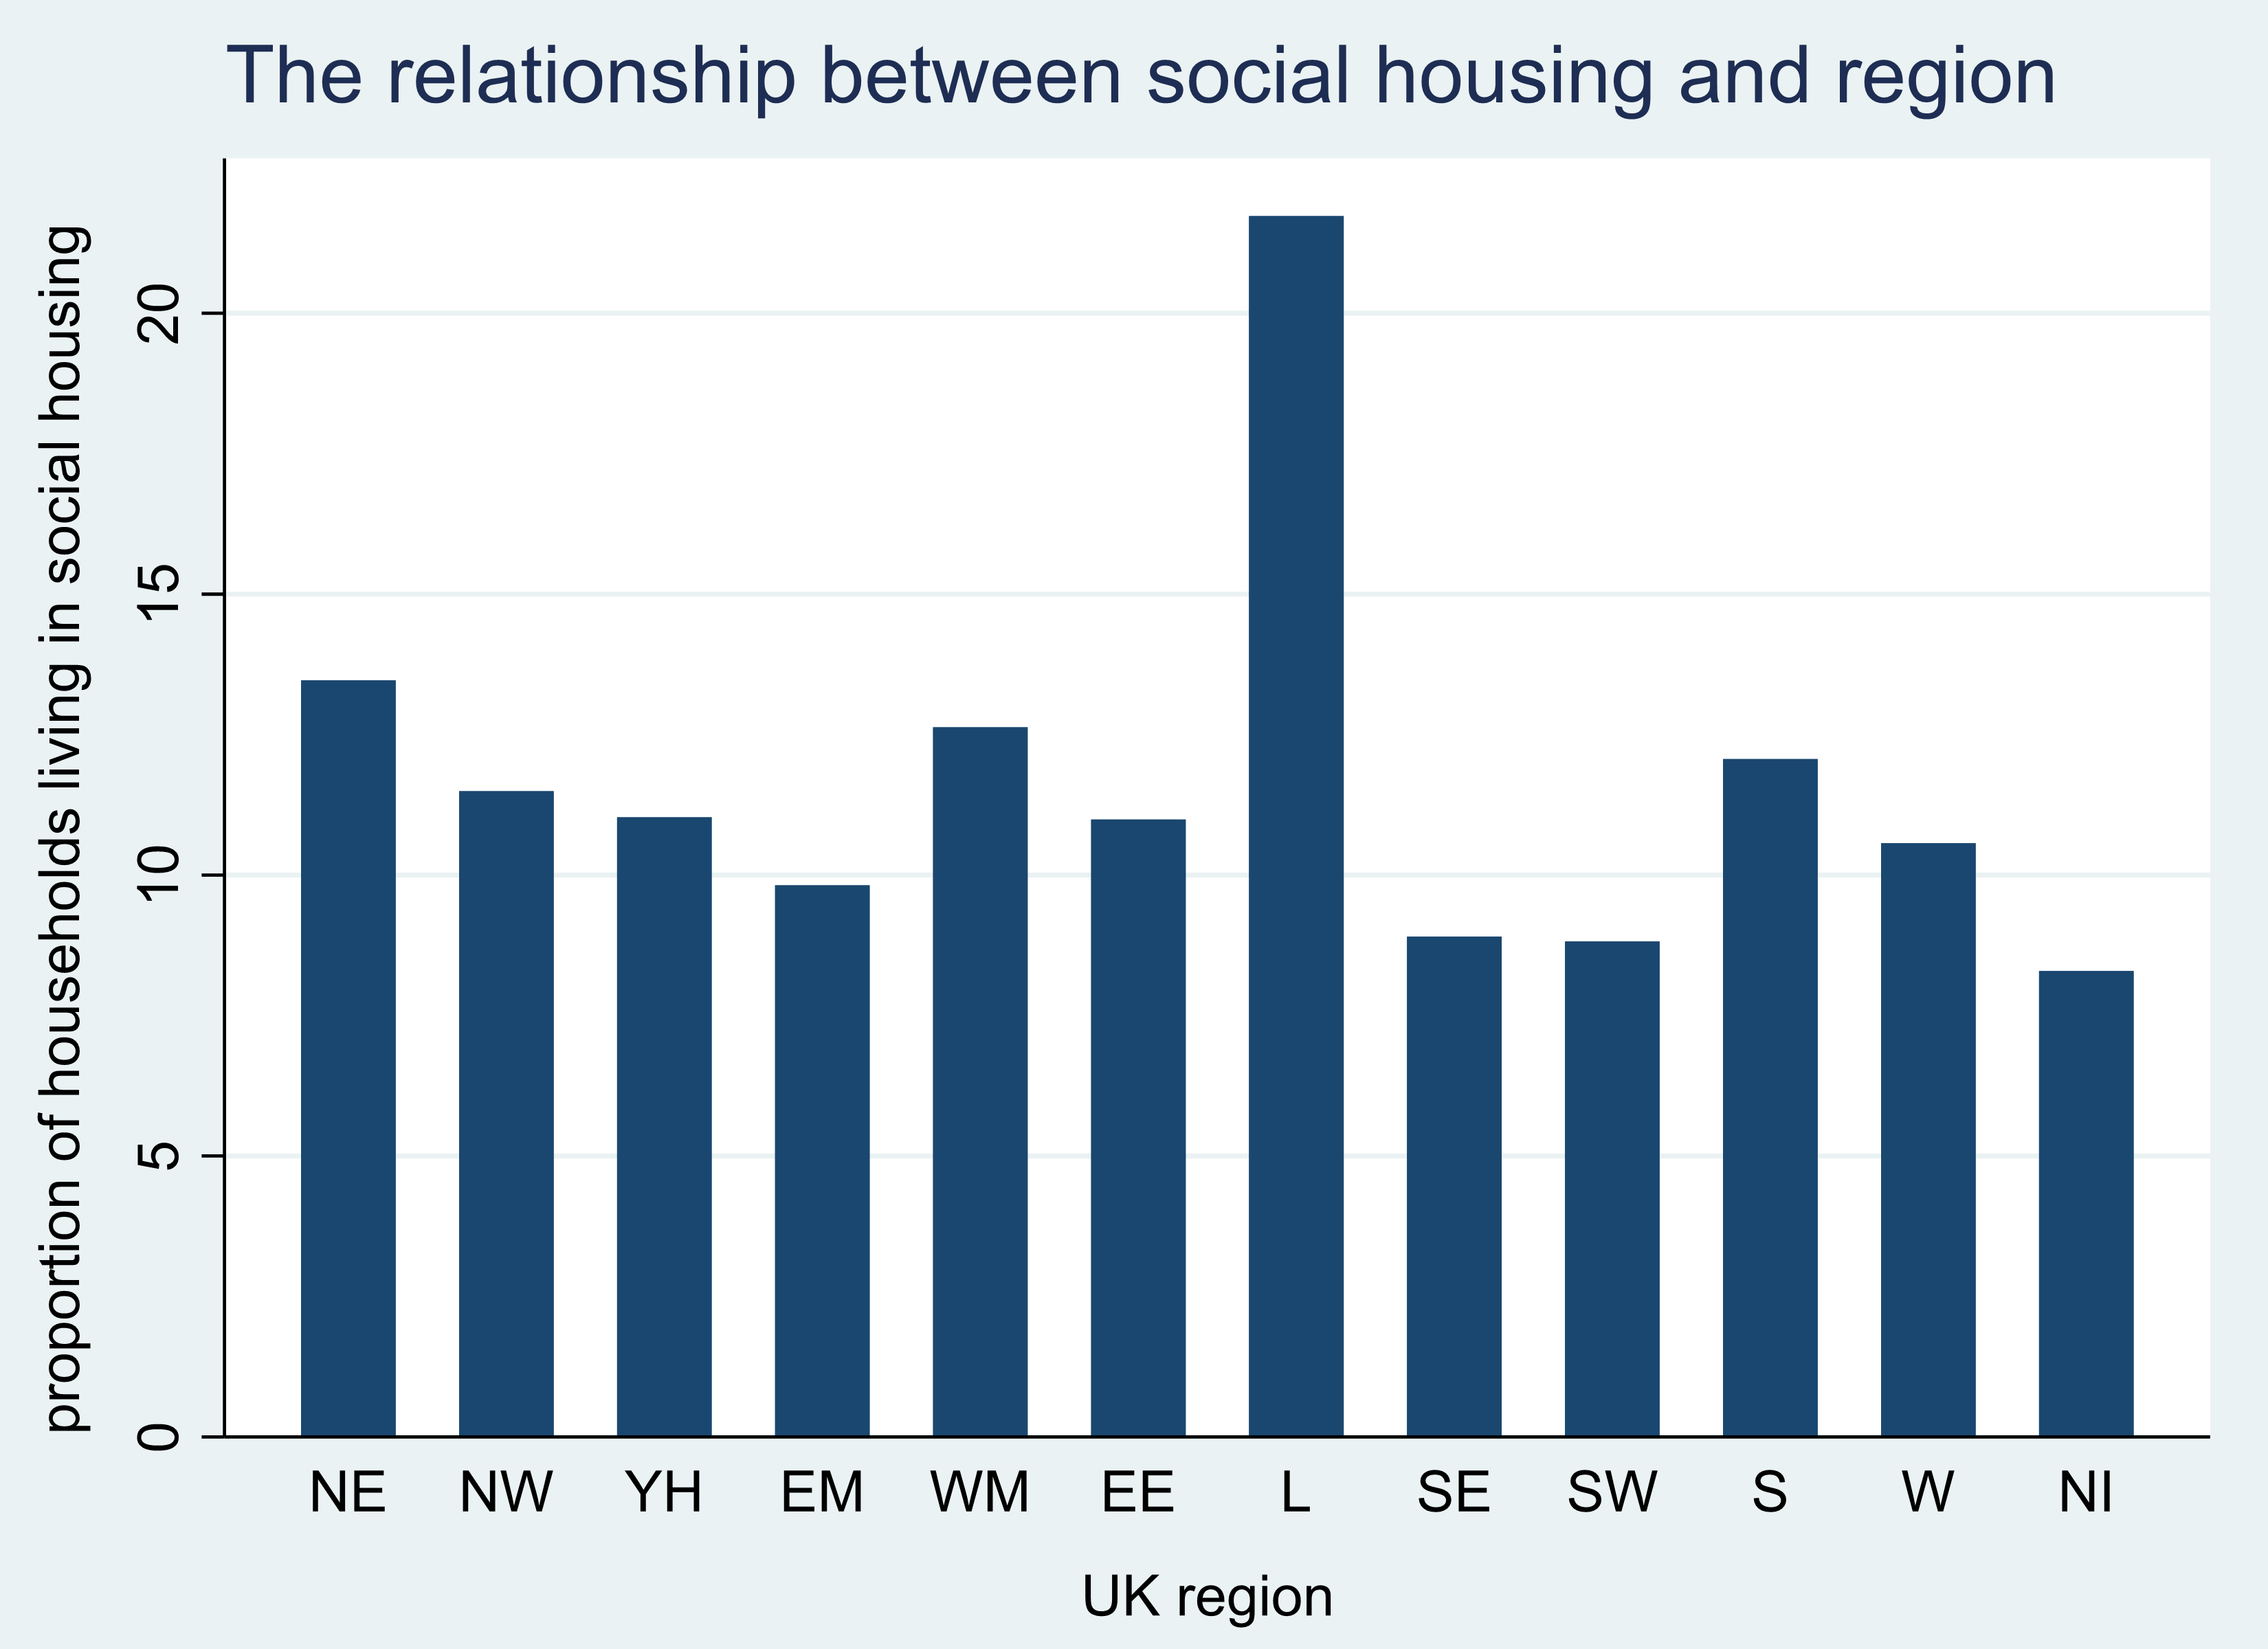
Our starting point was to firstly assess the suitability of each of the four transformed variables for use in the creation of a measure of socioeconomic disadvantage through analysis of the final linked dataset. For example, while housing may be an indicator of wealth, the functioning of the UK housing market varies substantially across regions. Indeed, the ability of a household to obtain social housing will be influenced by the supply and demand for such accommodation in their area, which is known to vary regionally (with higher stock levels found particularly in London).[4] Furthermore, there will be localities in the country where socioeconomically disadvantaged households are unable to access social housing as a consequence of limited supply and are therefore required to rely upon the private sector. Accordingly, in the Census data, we are likely to see large variation in the proportion of households in social housing by region and this is illustrated in Figure 1. This therefore draws into question the usefulness of such a variable in developing a UK-wide measure of disadvantage, as we will be unable to, for example, adequately capture disadvantaged households in areas where social housing is in restricted supply (resulting in them being unable to obtain such accommodation despite a demand for it).

Figure 1: The relationship between social housing and region[5]
With respect to vehicle ownership, the unique transport network in London reduces the need to own a car or van (as Figure 2 demonstrates). Conversely, in rural areas with limited public transport, purchasing a vehicle may be a necessity even among poorer households.[6] This consequently also raises doubts over the appropriateness of this variable too. For these reasons, it was concluded that these two Census variables we had created should not be used in devising our measure.

Figure 2: The relationship between vehicle ownership and region
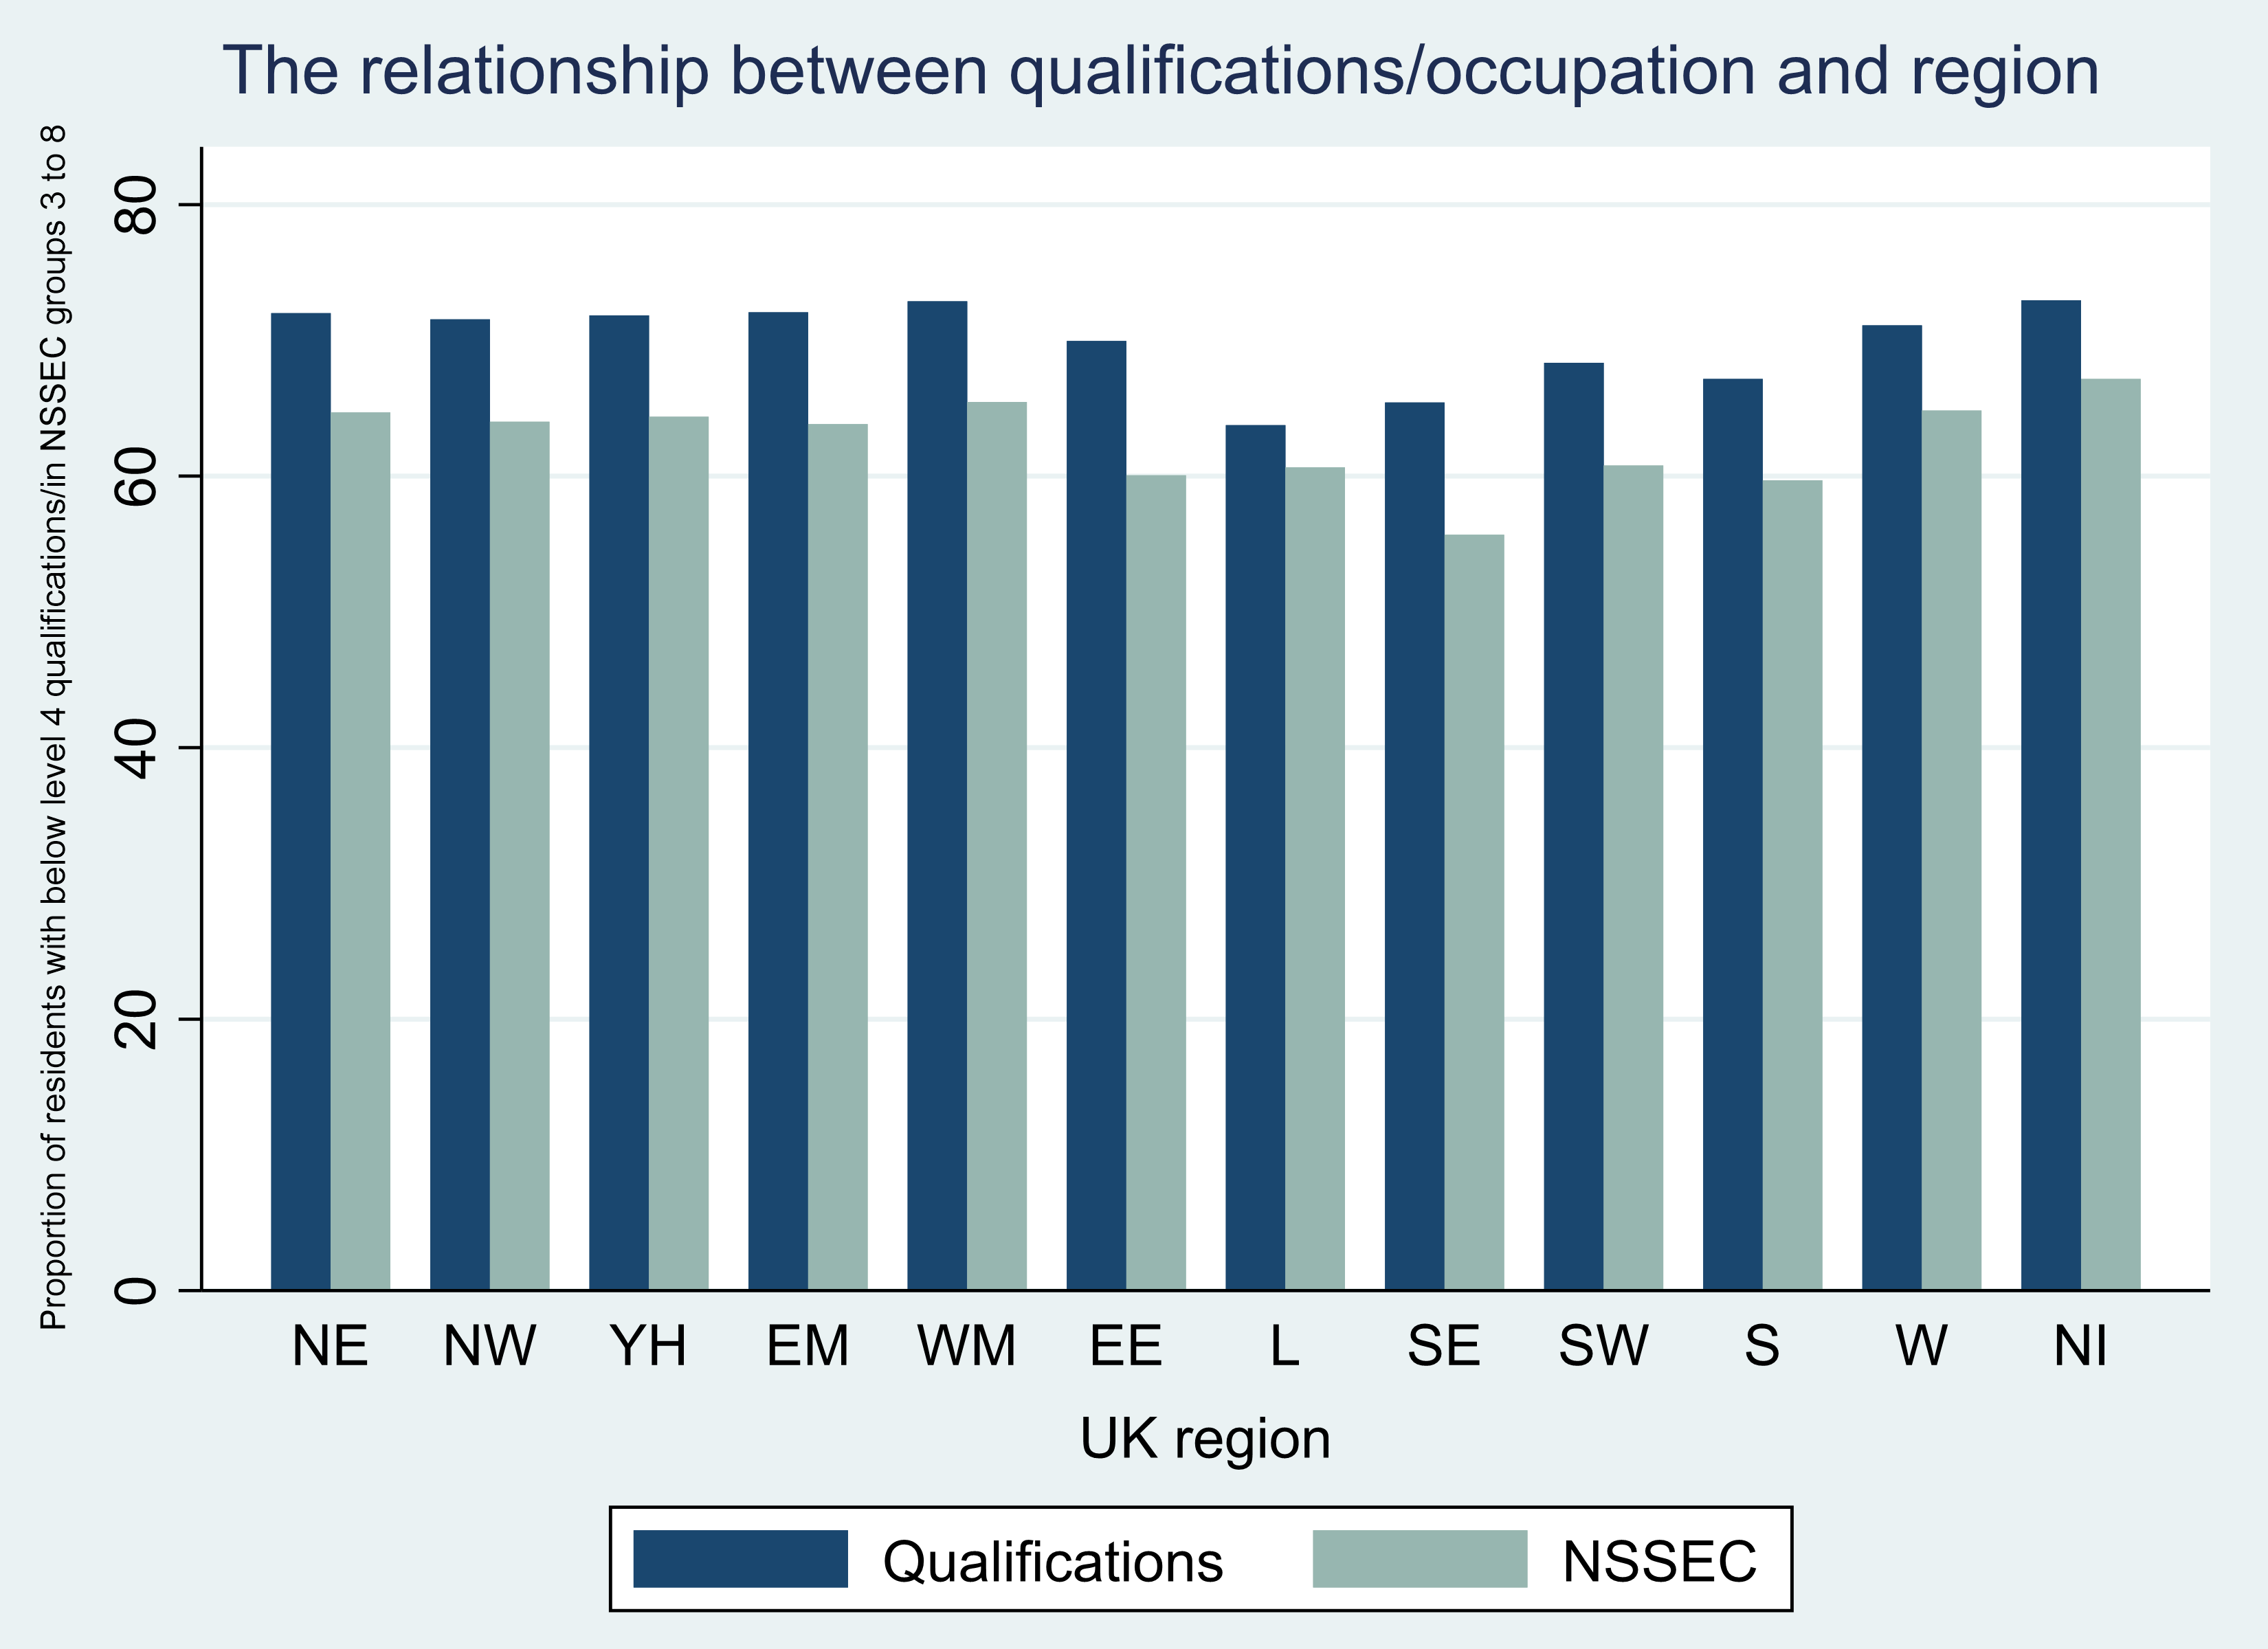
Figure 3 displays the association between qualification levels/NSSEC and region. Though there is variation across the different regions of the UK, with a greater proportion of residents in central/northern England, Wales and Northern Ireland holding below level 4 qualifications or being based in an occupation that falls under NSSEC categories 3 to 8, we do not witness the more extreme patterns observed with housing and vehicle ownership. With education and employment identified as potential contributing factors to socioeconomic disadvantage and given our aims to develop a UK-wide measure that overcomes known limitations of existing variables by better capturing deprivation throughout the country, these two variables were deemed suitable for inclusion in generating our measure. Furthermore, with education and employment expected to play an important part in achieving more equal opportunity and even growth across the UK, our measure is directly relevant to current policy objectives.

Figure 3: The relationship between qualifications/occupation and region
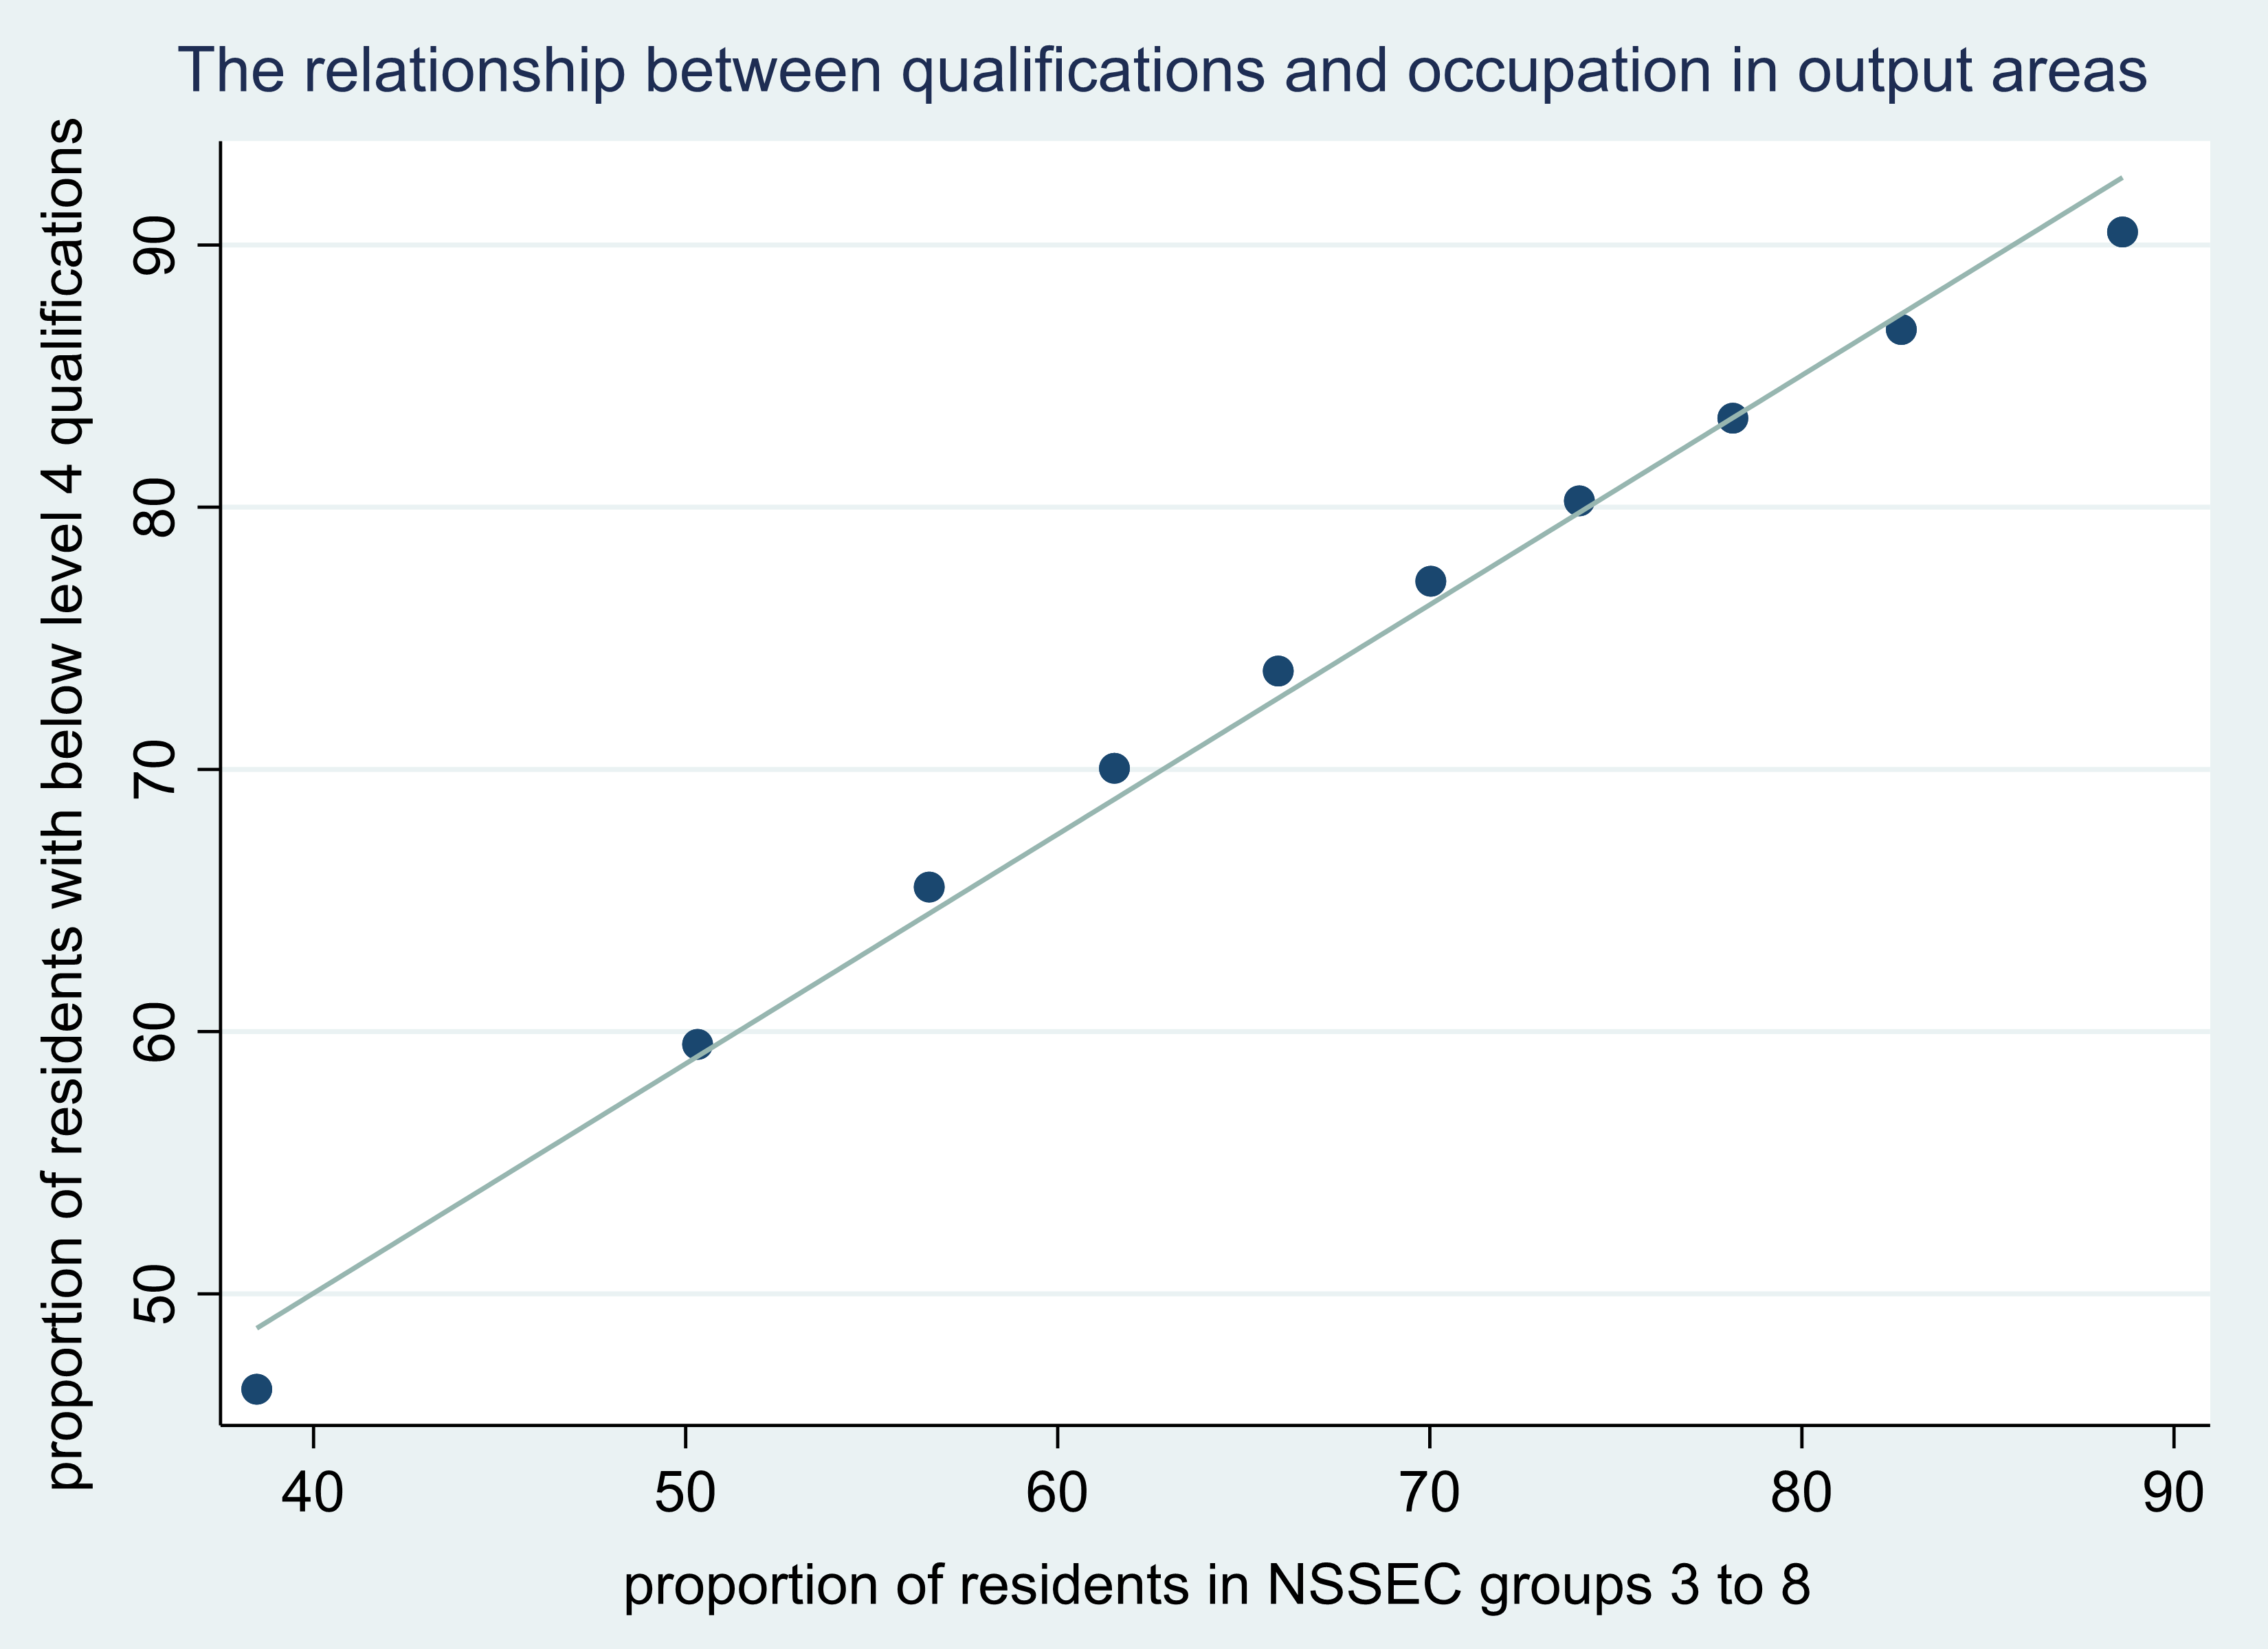
We therefore reverted to our original Census file (data source 1) and assessed the correlation between the transformed qualifications and occupation variables. This was found to be highly positive (0.91), with the linear relationship highlighted in Figure 4. To create a single measure based on these variables, one may employ data reduction methods, such as principal components analysis. For example, such a procedure was utilised by Bourne (2016) when developing a cognitive ability measure in the Next Steps birth cohort study using Key Stage English and Maths scores.[7] However, when we implemented such a strategy in this instance, we found both variables would essentially contribute equally to the composite variable. For simplicity purposes, we therefore created our measure of disadvantage by taking an average of these two proportions for each of the 232,296 output areas in the UK. These were then ranked, with those areas that were situated within the bottom 20% (based on having the highest average proportions of residents with below level 4 qualifications/in occupations that fell within NSSEC groups 3 to 8) identified as disadvantaged localities.

Figure 4: The relationship between qualifications and occupation within UK output areas
In what follows, we utilised our linked dataset to undertake an assessment of our measure in the context of higher education. In particular, we were interested in how the composition of students that are classified as falling within the bottom quintile of three area-level measures relevant to widening participation policy varies across the UK.[8] The data we hold on POLAR in the HESA record informs us of the quintile group a particular individual sits in. It is this feature of our data that contributed to our choice of focusing on the bottom quintile in our analysis. One of the key variables missing from the Census that would have been helpful to evaluate in the creation of our socioeconomic disadvantage measure is income. In its absence, we have ensured that throughout our discussion of the results, we have referred to external data/reports to assess whether our measure (as well as POLAR and IMD) is picking up those areas that have greater levels of poverty or have been identified as having experienced economic decline/low levels of social mobility.
Back: 3. Data Next: 5. Results
[1] https://www.gov.scot/publications/fairer-scotland-duty-interim-guidance-public-bodies/pages/2/ and https://gov.wales/sites/default/files/publications/2021-03/a-more-equal-wales.pdf
[3] https://www.equalrightstrust.org/ertdocumentbank/Tackling%20Socio%20Economic%20Disadvantage%20Making%20Rights%20Work.pdf
[5] NE = North East, NW = North West, YH = Yorkshire and The Humber, EM = East Midlands, WM = West Midlands, EE = East of England, L = London, SE = South East, SW = South West, S = Scotland, W= Wales and NI = Northern Ireland.
[7] https://www.spi.ox.ac.uk/sites/default/files/spi/documents/media/bourne_2016_measuring_cognitive_ability_in_the_ncds_bcs70_lsype_and_alspac.pdf
[8] There may be some output areas that do not emerge at all in our analysis of data linked to HESA records, as a result of no students being in higher education from these parts of the country in the 2011/12 academic year.
Contents
- Executive summary
- 1. Introduction and policy context
- 2. Widening participation: What measures are available?
- 3. Data
- 4. The derivation of a new measure of disadvantage
- 5. Results
- 6. Further remarks and next steps
- Appendix 1: English domiciled entrants
- Appendix 2: Welsh domiciled entrants
- Appendix 3: Scottish domiciled entrants
- Appendix 4: Northern Irish domiciled entrants
