Using Census data to generate a UK-wide measure of disadvantage - Results
Expand this box for more information.
Further work on our measure of disadvantage revealed an error in the generation of HESA measure deciles. Our output area files for England, Wales and Scotland contained statistics for higher level geographies (either local authorities, regions and/or countries), which had not been removed prior to the formation of the deciles.
HESA measure deciles have been recreated based on a total of 232,296 output areas (181,408 in England and Wales, 46,531 in Scotland and 4,537 in Northern Ireland). Around 1% of output areas changed from quintile 1 to a higher quintile or vice versa. Approximately 5% of output areas were affected when undertaking an analysis by decile. We have found the impact of this to be minimal and the conclusions of our research are not materially altered.
2022-05-11
5. Results
In this section, we therefore compare and contrast the measure we have defined above to POLAR and IMD to understand more about how they differ. While POLAR is not a measure of socioeconomic disadvantage, it is useful to include this in our investigation here given the original research on the variable highlighted a correlation between low participation and socioeconomic disadvantage, as well as its ongoing use within widening access activity. To do so, we must conduct our examination on a country-by-country basis, given that IMD is not applicable at a UK-wide level. As illustrated in the first two tables of appendices 1 to 4, when cross-tabulating our measure against POLAR and IMD (separately), we tend to find a very high proportion (over 90% across all instances) of those who fall in quintiles 2 to 5 under our methodology also do so according to POLAR and IMD. However, when considering quintile 1 of our measure, we see far lower proportions of individuals sitting within the lowest POLAR or IMD quintile.
To explore this further, we generated a range of summary statistics using demographic characteristics in our linked dataset. In the forthcoming discussion, we pay particular attention to the disparities in the localities that feature within the quintile 1 group across these three variables, but also the extent to which they appear to correlate with other published information relating to deprivation.
England
Appendix 1 provides the findings for England. Looking firstly at region, we see that under the POLAR definition, very few individuals from London fall into quintile 1, as expected. However, almost 30% of students in the lowest IMD quintile in our dataset resided in the capital prior to starting higher education. It is likely that those from London feature so predominantly under this measure, as a result of the region’s relatively worse performance on specific domains of the IMD. Housing affordability, crime and living conditions do tend to be worse here than in other areas within England.[1] Almost four-tenths of those in POLAR quintile 1 were from southern parts of the country (East of England, London, South East and South West), whereas under our measure, this proportion is just below 25%. In comparison, our variable consists of a far higher proportion of students from the North and Midlands. Having linked in local authority name data supplied by the ONS into our dataset, we are able to look more finely at the exact vicinities each of these variables is picking up.
Beginning with our measure, we see that towns and cities in central/northern England, which have previously been identified in other research as having experienced economic decline and/or increasing deprivation feature high on the list. This includes areas such as Oldham, Bolton, Rochdale, Sandwell and Walsall.[2] Though it is the case that the south has experienced superior economic outcomes in relative terms over recent decades, there remain numerous localities experiencing deprivation and/or where social mobility levels remain low. Back in 2016, a Social Mobility Index was released that highlighted the parts of the UK that were ‘cold spots’ for social mobility.[3] POLAR quintile 1 appears to better capture some of these cold spots in parts of the south, including coastal areas. Examples include Norwich, Poole and Thanet. We also assessed the exact places within these areas that students in POLAR quintile 1 tended to be located before enrolling into university. In Thanet, we found them to be principally from MSOAs such as Dane Valley, Newington, Salmestone and Cliftonville West, which are known for high levels of deprivation where a key local focus is improving education and employment opportunities.[4] Earlham, University and Avenues, as well as Catton Grove and Airport were all examples of the main MSOAs in Norwich that appear when analysing the residences of students from this part of the country – all localities that have below average incomes (relative to England and Wales).[5] In Poole, POLAR quintile 1 students were commonly from areas such as Hamworthy, Newtown, Canford Heath East and Rossmore (Alderney), with nearly all being associated with higher levels of income poverty.[6] Hence, while the POLAR marker in itself is not a measure of socioeconomic disadvantage like our own variable or IMD, there are parts of England where it appears to be correlated with it and may therefore be useful in widening participation among those from low socioeconomic backgrounds. Finally, when looking at IMD, in the initial tables by region, we see quite high percentages appear in the North West and West Midlands, alongside London. This additional breakdown illustrates that it is the major cities of these areas (e.g. Birmingham, Manchester and Liverpool) that appear to primarily account for this. Indeed Table A7 in Appendix 1 demonstrates that IMD in England largely captures major and minor conurbations, with very few rural areas emerging in the bottom quintile.
One of the potential worries about both our measure and POLAR is that they are both based on data collected/generated a decade or so ago. However, the research reports we refer to in the previous paragraph are all more recent publications. To address this possible concern further, we add supplementary context to the results by looking at child poverty statistics as reported by the Health Foundation.[7] These figures relate to the years 2014-2019 and are based on data from the Department for Work and Pensions, as well Her Majesty’s Revenue and Customs. We see that areas such as Wolverhampton, Sandwell and Walsall have some of the highest rates in the Midlands region, alongside Birmingham. In the North, the vicinities of Oldham, Bolton, Rochdale and Bradford are examples of areas with particularly large proportions of child poverty. While levels appear lower in the south more generally, places like Thanet and Norwich all have relatively large poverty rates, which our analysis has shown are picked up under the POLAR marker.
The above exploration illustrates the importance in remembering that all of these measures can play a part in helping providers and policymakers in widening opportunity throughout the country and meeting the ambition of more equitable growth across the regions. Access and participation plans devised by providers will often entail local elements, such as undertaking outreach activities within the community, with such programmes making use of area-level measures in determining the most effective strategy. Within such localised settings, there will be instances where an area-level measure that can be used by providers in assessing socioeconomic disadvantage in one part of the country may not be deemed appropriate for use in other areas. We have already discussed the high participation levels in London resulting in few students from the city falling into POLAR quintile 1. Yet, given Poole’s relative affluence, IMD and our own measure may not sufficiently catch local deprivation here. Indeed, very few students in this locality were based in the bottom IMD quintile in our analysis. Consequently, providers around the south coast that wish to encourage participation among those from areas of socioeconomic disadvantage in the region may find IMD a less useful tool than POLAR.
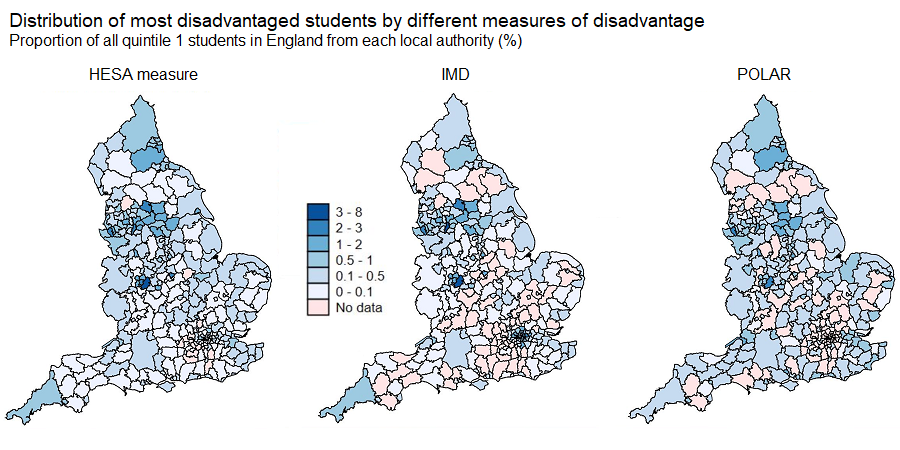
Map 1: Distribution of most disadvantaged students by different measures of disadvantage (England)
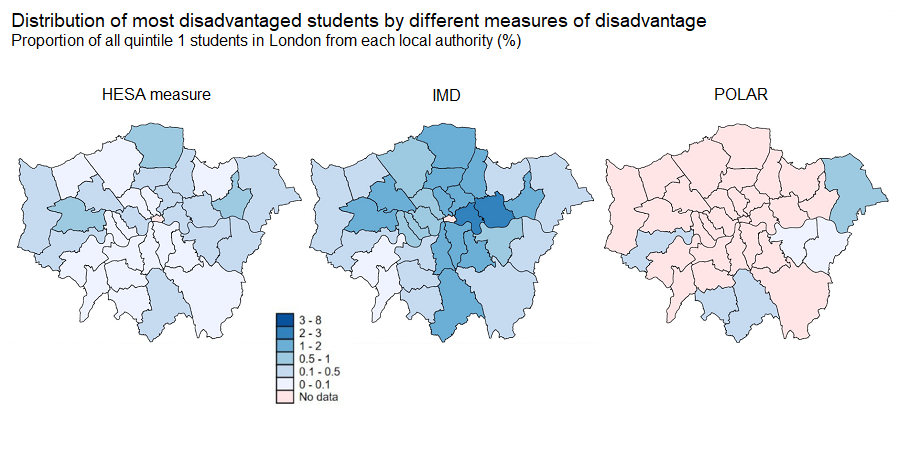
Map 2: Distribution of most disadvantaged students by different measures of disadvantage (London)
Wales
Relevant tables for Wales can be found in Appendix 2. Firstly, focusing on our measure, we note that areas such as Rhondda, Caerphilly and Carmarthenshire all feature more prominently here than in the tables by POLAR and WIMD. Looking more closely at the MSOAs that make up these local authorities, we find that Ystrad & Llwynypia (Rhondda), Tonypandy East (Rhondda), Llanelli South (Carmarthenshire), Pengam & Cefn Fforest (Caerphilly), Bargoed (Caerphilly) and Risca East (Caerphilly) are some of the most common localities that students from these areas lived in before they began tertiary education. Though no longer running, these were also the types of places that were targeted as part of the Communities First programme first established by the Welsh Government in 2001 to tackle poverty, in which eligibility was largely determined by the 2000 WIMD.[8]
There are also some noticeable differences in the areas within the cities that seem to be caught by these three measures. For example, in Swansea, we see Landore – a known area of deprivation - is the most common MSOA for both IMD and our own variable, but it does not emerge at all in the POLAR4 measure.[9] However, Townhill, Penderry and Bon-y-maen are found to be examples of some of the other most featured areas of Swansea across all three measures. Meanwhile, within Cardiff, there are also discrepancies in the distribution of MSOAs picked up by these three variables. Of the students from Cardiff who live in a POLAR4 quintile 1 area, half are from either Adamsdown, Llanrumney North, Llanedeyrn, Cathays North or Pentywn. The latter three localities either do not feature or do so in smaller numbers under our measure and IMD when analysing the city. In the case of IMD, the highest proportions are found to be for Adamsdown, South Riverside, Grangetown (North and South), Llanrumney South, Trowbridge and Ely East. Around one third of students from Cardiff who were in the bottom quintile of our measure were from the final three vicinities discussed in the previous sentence, though very few were found to be from Adamsdown. Previous research has indicated that Ely, Llanrumney, Fairwater, Caerau and Adamsdown all have high levels of poverty (according to 2015 CACI Paycheck data).[10] However, it appears that Fairwater (North and South) is not captured at all under POLAR.
Another distinction we note between the three variables in Wales is that the POLAR measure has a greater number of students from areas such as Pembrokeshire and Monmouthshire. Indeed, Monmouthshire does not emerge under IMD. When we look at the MSOAs that students lived in within these counties, we find that Pembroke Dock, Haverfordwest (North) and Milford Haven West are the localities covered by POLAR within Pembrokeshire, which have been identified as areas with higher levels of deprivation.[11] Abergavenny North and Caldicot South are the two places of residence for students in POLAR quintile 1 from Monmouthshire, with the former having once been part of the Communities First initiative. As we saw in England therefore, there appear to be instances where POLAR is correlated with socioeconomic disadvantage (despite itself not being a variable that seeks to capture this), with no single area-level measure adequately picking up deprivation in all regions of the country. An additional similarity to the findings for England is that IMD again generally picks up predominantly urban parts, with both quintile 1 of our measure and POLAR encompassing a greater proportion of rural areas.
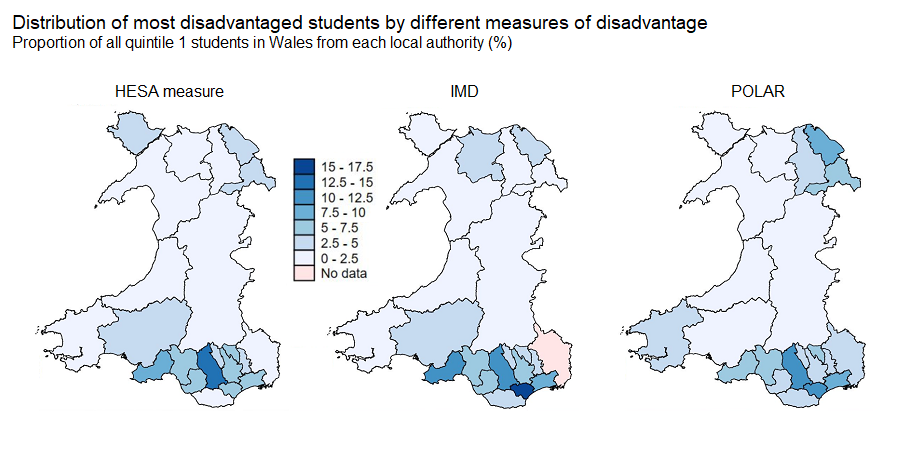
Map 3: Distribution of most disadvantaged students by different measures of disadvantage (Wales)
Scotland
While we do have IZ names for Scotland, breakdowns at this level lead to very small numbers, so we concentrate on data at the council area level. The limitations of POLAR in Scotland have been discussed earlier, though we do provide further detail using this variable. As Appendix 3 shows, the number of Scottish students classified in POLAR quintile 1 is very low, whereas the other two measures do comprise a much greater overall count. Furthermore, another issue with POLAR in Scotland is that over a third of those in the lowest quintile are from Scotland’s two major cities and thus this measure seems restricted in the extent to which it can identify those who are disadvantaged across the country.
However, a similar argument could be made against IMD, where students from Glasgow, Edinburgh and Dundee account for almost half of those in the lowest IMD quintile. Contrary to POLAR, it is now Glasgow that emerges as the dominant city to be picked up by the measure, whereas it was Edinburgh in the case of POLAR. In section 2 of this paper, we noted concerns that SIMD does not sufficiently capture deprivation in rural parts of the country. The key discrepancy between our measure and IMD is the coverage across the country within the lowest quintile, including within rural areas and remote small towns (as Table C6 illustrates). Falkirk, Angus, Dumfries and Galloway, as well as the Scottish Borders are all examples of areas that feature in greater numbers under our measure. Modelled income estimates generated by Heriot-Watt University relating to the year 2008/09 are available in the public domain.[12] Analysis of these figures indicates that the areas such as Dumfries and Galloway and the Scottish Borders also tended to have estimated net median incomes (irrespective of whether housing costs and family composition were considered) that fell below the average in the country. Furthermore, looking at the child poverty statistics reported by the Health Foundation, we see that child poverty rates are high in areas such as Glasgow, North Ayrshire and North Lanarkshire. As with England and Wales where we have tried to add further context using recent related statistics to mitigate concerns around the usefulness of our measure today (and its correlation with income), it does appear that the definition we have created using 2011 Census data does comprise of areas that continue to experience poverty and deprivation.
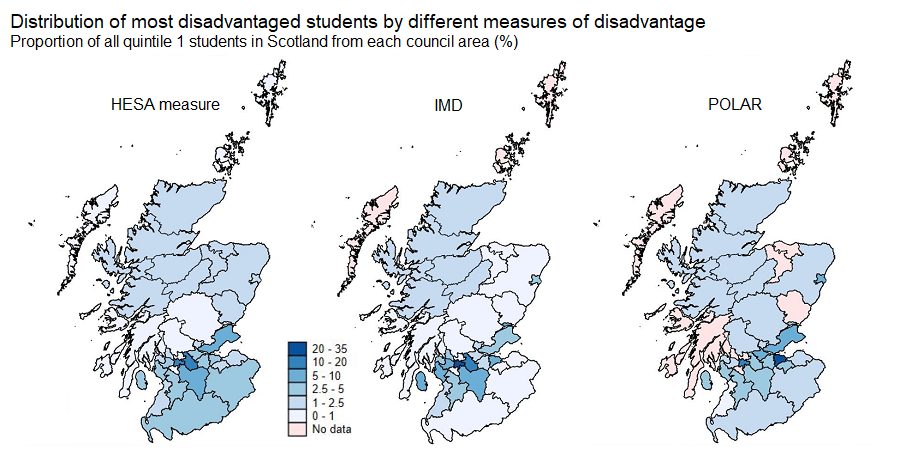
Map 4: Distribution of most disadvantaged students by different measures of disadvantage (Scotland)
Northern Ireland
In a similar fashion to what we see in Scotland, both the lowest POLAR and IMD quintiles tend to be more dominated by a major city relative to our measure. Despite this difference between the three variables, we do find that they all seem to pick up similar areas of the capital. The four most common DEAs that emerge in all three measures are Black Mountain, Collin, Court and Oldpark. Though Belfast is the LGD containing the highest proportion of students in all instances, there are clear discrepancies thereafter between our measure, IMD and POLAR.
Firstly, we note that while the ordering of LGDs is not too dissimilar between our measure and IMD, we do see a more even division across LGDs under our variable. As in Scotland therefore, one of the distinguishing features of our measure is its ability to encompass parts of the country that lie outside the major cities. Within our data for Northern Ireland, we also have a proxy rural-urban marker, which indicates that just 4% of those in POLAR quintile 1 are from a rural part of the country. This rises to 11% under IMD and 23% under our own measure. The distribution across LGDs under the POLAR measure differs quite noticeably to both our measure and IMD. A far smaller proportion of those in quintile 1 of POLAR are from Derry/Londonderry City and Strabane, with Ards and North Down featuring far more prominently. In particular, it is the Bangor (central/west) and Newtownards DEAs within the latter LGD that POLAR appears to encapsulate. Furthermore, Fermanagh and Omagh is not captured at all, with the most likely cause of this being the relatively high levels of higher education participation in this district.[13]
In 2003, the government of Northern Ireland launched the Neighbourhood Renewal programme, designed to improve the quality of life among some of the most deprived parts of the country through interventions implemented by Neighbourhood Partnerships (consisting of, for example, those from the voluntary and private sector, as well as the community). The objectives involved community, economic, social and physical renewal, with education seen to play an important role in delivering these targets.[14] Derry/Londonderry Outer North (containing wards such as Shantallow in the Ballyarnett DEA[15]) and Triax Cityside[16] (comprising wards such as Brandywell and Creggan that are part of The Moor DEA[17]), as well as Strabane were chosen to be in the initiative from the north western region of the country.[18] Meanwhile, places such as Newry and Armagh also featured in the project. These programmes have continued to be administered over the last decade, with relevant action plans and annual reports published on aims and progress.[19] We note that these are all vicinities within Northern Ireland that are covered in our measure of disadvantage based on 2011 Census data. Wards such as Upper Springfield, Whiterock (both part of Black Mountain) and Ardoyne (Oldpark) were all parts of Belfast that were included in the programme, hence all three measures do seem to be picking up some of the most deprived neighbourhoods of the capital.
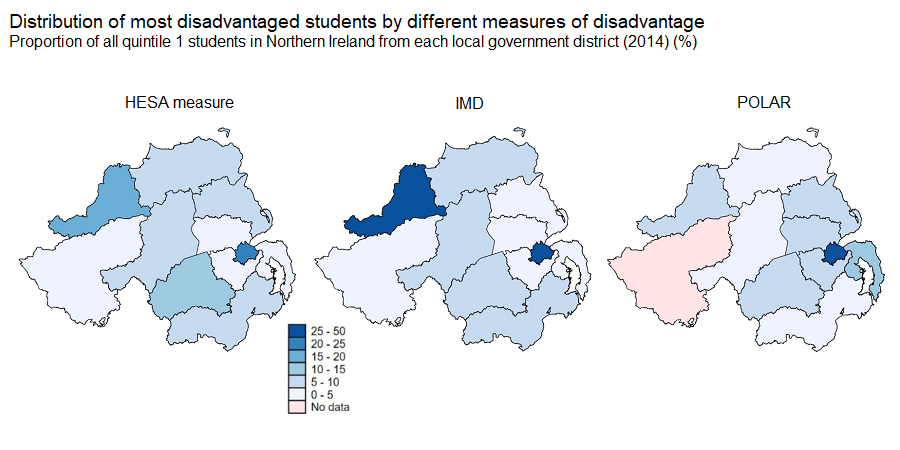
Map 5: Distribution of most disadvantaged students by different measures of disadvantage (Northern Ireland)
Back: 4. The derivation of a new measure of disadvantage Next: 6. Further remarks and next steps
[1] https://www.londoncouncils.gov.uk/members-area/member-briefings/local-government-finance/indices-deprivation-2019
[2] See, for example, https://barrowcadbury.org.uk/wp-content/uploads/2019/02/NPI-The-State-of-Economic-Justice-in-Birmingham-and-the-Black-Country_lo-res-for-web.pdf and https://www.jrf.org.uk/sites/default/files/jrf/files-research/tackling_declining_cities_report.pdf
[3] https://assets.publishing.service.gov.uk/government/uploads/system/uploads/attachment_data/file/496103/Social_Mobility_Index.pdf
[8] Relevant cluster maps can be found here https://statswales.gov.wales/Catalogue/Community-Safety-and-Social-Inclusion/Communities-First/Cluster-Maps
[10] https://www.caerdydd.gov.uk/ENG/Your-Council/Have-your-say/Ask%20Cardiff%20Library/Vulnerable%20Children%20and%20Families%20Programme%20Intelligence%20Report.pdf
[12] https://statistics.gov.scot/resource?uri=http%3A%2F%2Fstatistics.gov.scot%2Fdata%2Fincome-and-poverty-modelled-estimates
[13] https://www.fermanaghomagh.com/app/uploads/2019/10/Fermanagh-and-Omagh-Strategy-Review-to-Support-Community-Planning-Final-Draft-07102015.pdf
[15] https://www.derrystrabane.com/getmedia/4cd42d07-6434-45d4-ae01-c1bead779373/Deprivation-(Ward).pdf
[16] https://www.communities-ni.gov.uk/sites/default/files/publications/communities/triax-cityside-nra-annual-report-2018-19.PDF
[17] https://growderrystrabane.com/wp-content/uploads/2019/10/30776-Local-Growth-Plan-Moor-Amended-LOW-RES.pdf
Contents
- Executive summary
- 1. Introduction and policy context
- 2. Widening participation: What measures are available?
- 3. Data
- 4. The derivation of a new measure of disadvantage
- 5. Results
- 6. Further remarks and next steps
- Appendix 1: English domiciled entrants
- Appendix 2: Welsh domiciled entrants
- Appendix 3: Scottish domiciled entrants
- Appendix 4: Northern Irish domiciled entrants
