The impact of the COVID-19 pandemic on Graduate Outcomes 2019/20
Introduction and key findings
Our discussion of the impact of the pandemic on Graduate Outcomes 2019/20 begins with a look at the changing pandemic context of the past two years. The analysis that follows is split into two major sections, the first looking at the potential impact on survey response rates, and the second looking at whether the pandemic led to any observable changes in the graduate experience since the launch of the Graduate Outcomes survey.
Previous analysis of Graduate Outcomes has led us to conclude that there is no reason to weight our survey data to account for non-response bias, but we continue to monitor our data for any signs of potential bias. When we investigated survey response rates as part our analysis of the possible effects of the pandemic, the results supported our previous findings. Across three years of survey data, response rates have remained broadly stable or increased slightly. This is true both across the board and when we look at the response rates of graduates with different personal characteristics, leaving us with no reason to believe that the pandemic has contributed to non-response bias in our data.
In our investigation of the impacts of the pandemic on the graduate experience, we saw little overall change since the start of the pandemic. Although year-on-year changes were small, we saw some indications in the 2019/20 data that graduate employment is beginning to recover after a dip in the first year of the pandemic. Both the occupational classes and the industries in which graduates are employed have remained steady across three years of data. Graduates remain broadly positive in their subjective assessment of their experiences, but the contraction in highly positive responses which we saw in the 2018/19 data can still be seen in the 2019/20 data. Those differences which we have seen have been less marked between 2018/19 and 2019/20 than they were between 2017/18 and 2019/20; after a turbulent few years, it is possible that the rate of change is beginning to slow.
The pandemic context
The 2019/20 Graduate Outcomes cohort – those who completed their higher education studies during the 2019/20 academic year – are likely to have had a different experience of the COVID-19 pandemic than the previous cohort.
In last year’s analysis of the effect of the pandemic, we were considering part graduates who were at least seven months past the completion of their studies when the pandemic began. Most of those graduates, however, were surveyed during the pandemic, many under pandemic-related restrictions of varying levels of severity.
Despite some concern that response rates might decline under the pandemic circumstances of the 2018/19 survey year, response rates for the most part held steady, and we saw an overall increase compared to the first year of surveying. Although there were some changes in graduate activity compared to the 2017/18 data, with an increase in those graduates reporting themselves as unemployed and a decrease in those taking time off to travel, the increase in graduate unemployment which we saw was less striking than that reported by the Office for National Statistics (ONS) for young people in the general population over the same time period.
The pandemic context was different for the 2019/20 survey, and, in fact, for each 2019/20 cohort. While cohorts A and B finished their higher education courses before the start of the pandemic, the COVID-19 outbreak was declared a pandemic on 11 March 2020, as cohort C of the 2019/20 survey year was finishing their studies; cohort D completed their higher education courses between May and July 2020, during the gradual easing of the first national lockdown (Figure 1).
Figure 1. 2019/20 course completion dates in the context of the COVID-19 pandemic
Conversely, cohorts A and B were surveyed between December 2020 and May 2021, while COVID-19 restrictions were in place across the UK. Cohort C was surveyed between June and August 2021, as restrictions were gradually phased out, while cohort D was surveyed between September and November 2021, against a backdrop of rising case numbers but few legal restrictions on activity (Figure 2).
Figure 2. 2019/20 Graduate Outcomes survey contact periods in the context of the COVID-19 pandemic
In this year’s investigation we focused on two main questions. On the one hand, as we did last year, we wanted to ascertain whether the ongoing pandemic had had any identifiable impact on the willingness of graduates with different demographic characteristics to respond to the survey. Information about changes in response rate would give us an indication of the extent to which the Graduate Outcomes survey remained representative of the experiences of the target population, despite the evolving circumstances of the pandemic. On the other hand, we wanted to see whether there were any notable changes in how graduates responded to key survey questions this year. This, we hoped, would help us to understand how the experiences of those who graduated into the pandemic differed from the experiences of the 2017/18 graduates, who finished their studies before the pandemic began.
Rates of response to the 2019/20 Graduate Outcomes survey
When we began looking at the effects of the pandemic on the 2018/19 Graduate Outcomes data, we were concerned that, even though surveying had been able to continue as planned, the pandemic circumstances of the second half of the survey year might nonetheless affect response rates. On the one hand, there was a concern that those graduates who were struggling – either personally or financially – might feel some pressure only to respond if they could report positive outcomes and would therefore be less likely to respond than they would have been under ‘normal’ circumstances. It was also suggested that some graduates working in stressful frontline roles, such as medicine and education, might not feel they had the time to respond. On the other hand, the widespread move to homeworking, coupled with other restrictions on activity, may have left many graduates more than usually available to participate in the survey.[1]
Though we did see slight decreases in response rates for the final two cohorts of 2018/19 – those surveyed entirely during the pandemic – when compared with the equivalent 2017/18 cohorts, these decreases were very minor (less than one percentage point), and, given that it was only our second year of surveying, we could not be sure that they represented anything outside the bounds of normal year-on-year variation.
Looking at cohort-level response rates for the 2019/20 survey, we saw a pattern of response rates very similar to that which we observed in the 2018/19 data (Figure 3). Response rates for cohorts A and B – those who were surveyed beginning in December and March, respectively – have increased slightly in each of the three survey years. Response rates for cohorts C and D – surveyed beginning in June and September – held steady or decreased very slightly (by less than one percentage point).
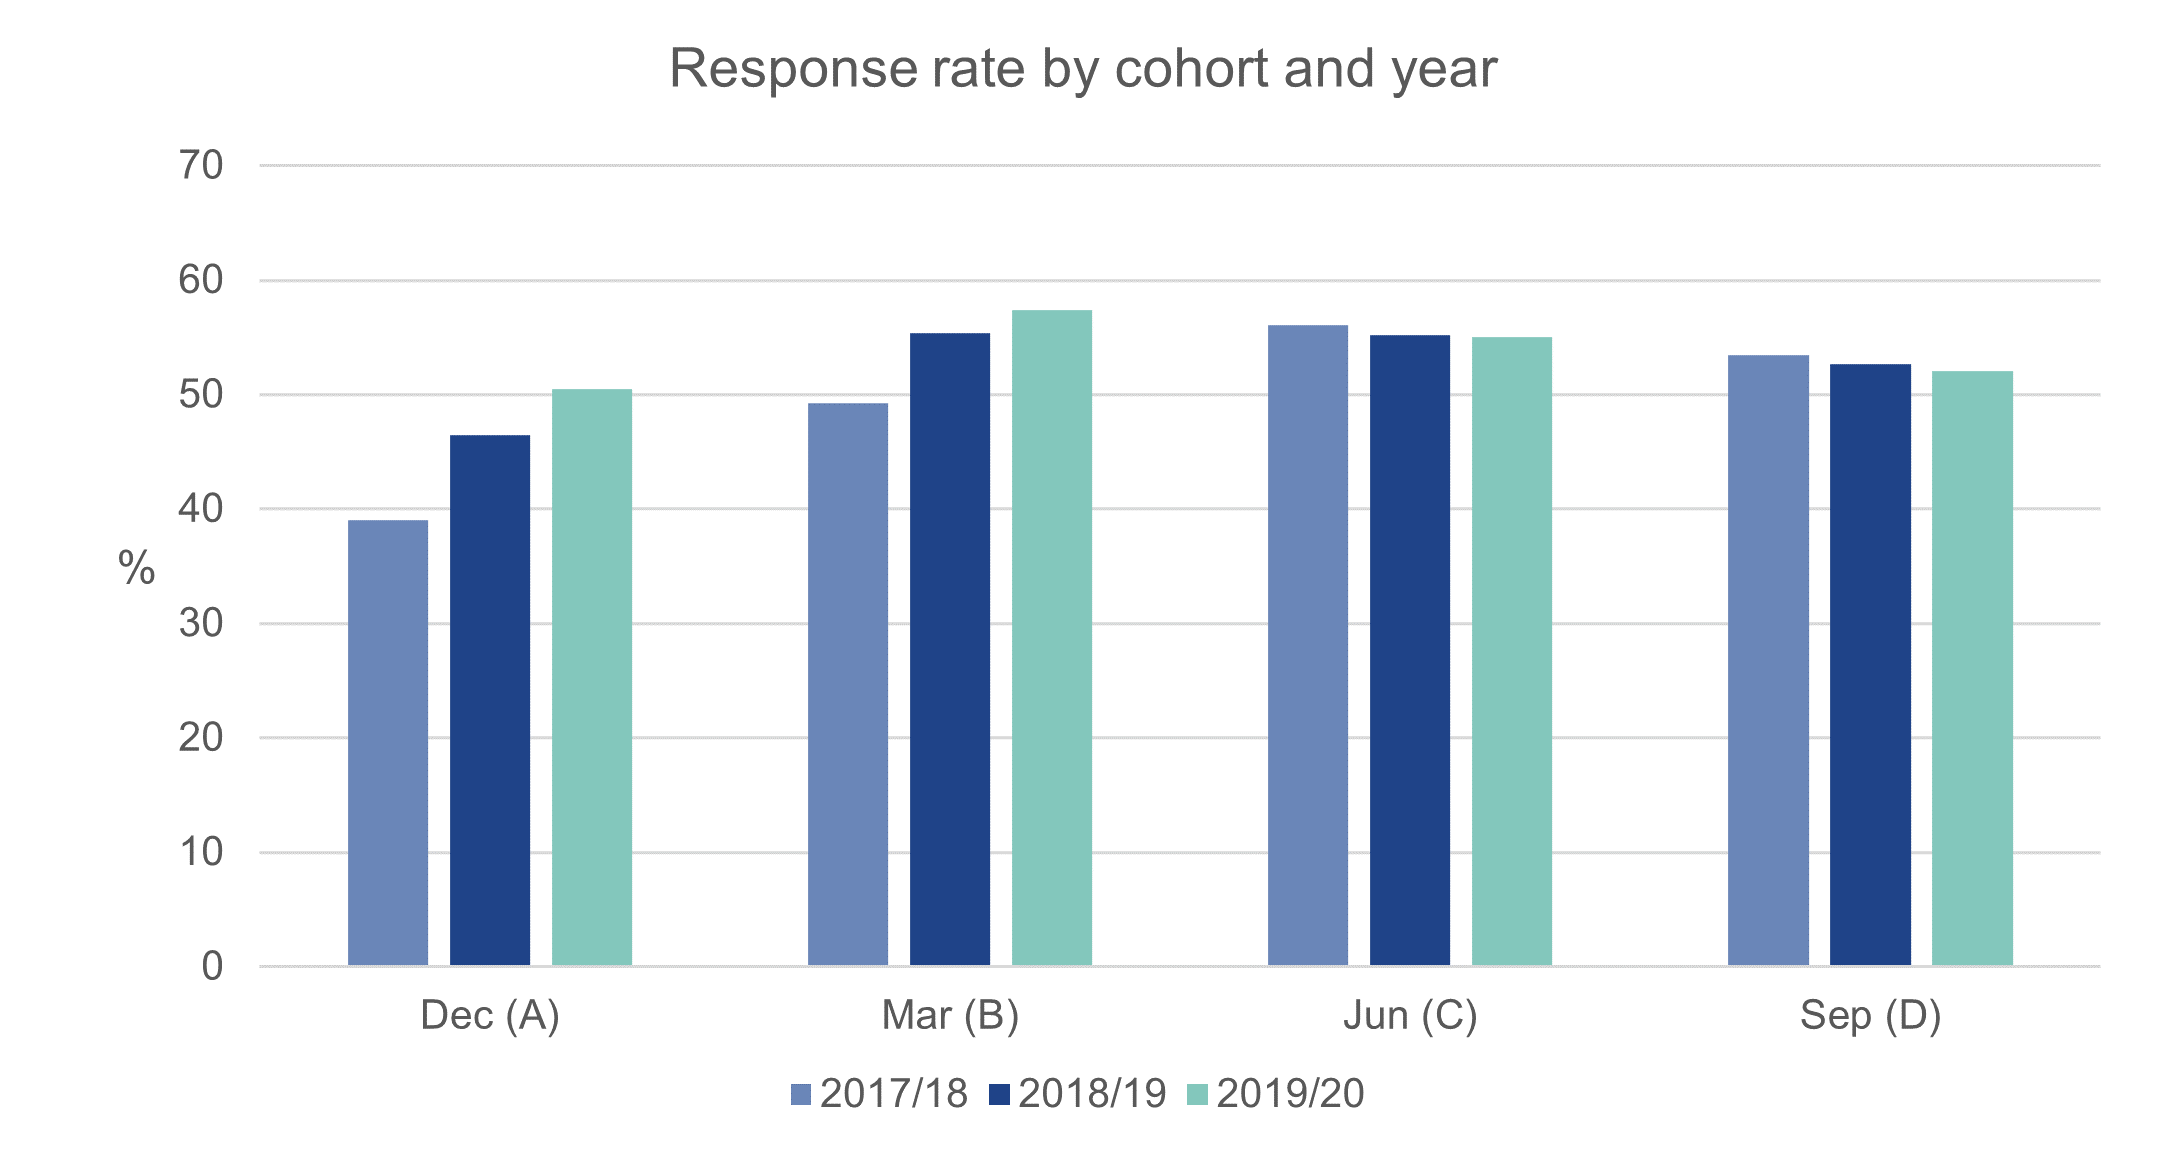
Figure 3. Response rates by cohort and survey year
In 2018/19, it seemed plausible that this difference between the first two and second two cohorts could be connected to the start of the pandemic before surveying opened for cohort C. As was the case in the 2018/19 survey, there are differences in the pandemic contexts of the first two and second two 2019/20 cohorts. The nature of these differences, however, varies from one year to the next: in 2018/19, the difference between cohorts A and B and cohorts C and D had to do with the circumstances under which the cohorts were surveyed, while, in 2019/20, the difference had to do with the circumstances under which they finished their higher education courses. It seems therefore that differences in response rates between cohorts are just as likely to represent underlying differences in the cohort populations as they are to represent the changing pandemic circumstances of each survey year.
As we did for the 2018/19 data, we looked not only at overall response rates by cohort, but also at the response rates for graduates with different personal characteristics. The effects of the pandemic have not been evenly distributed across society, with some groups experiencing more adverse health effects while others experienced more disruption in their working lives or needed to take on additional caring responsibilities.
Age
Both the health and the employment effects of the pandemic have been stratified by age. The most severe health effects of the pandemic have occurred in older people, with research showing that the infection fatality rate increased exponentially by age before the rollout of the COVID-19 vaccine.[2] Young people, on the other hand, many of whom work in industries which were severely affected by the pandemic, experienced the heaviest job losses. As we looked for the first time at graduates who finished their higher education during the pandemic, we wondered whether the difficult job market would depress response rates amongst younger graduates, who might hesitate to report suboptimal employment outcomes if they were struggling to find work.
We found, however, little change in response rates by age when we compared the 2019/20 data to that of earlier years (Figure 4). While graduates in our two youngest age brackets were somewhat less likely to respond to the survey than those in older age groups, those two age brackets represent only a very small portion of the Graduate Outcomes target population, and, more importantly, they have consistently had lower response rates than most other age groups, even before the start of the pandemic.
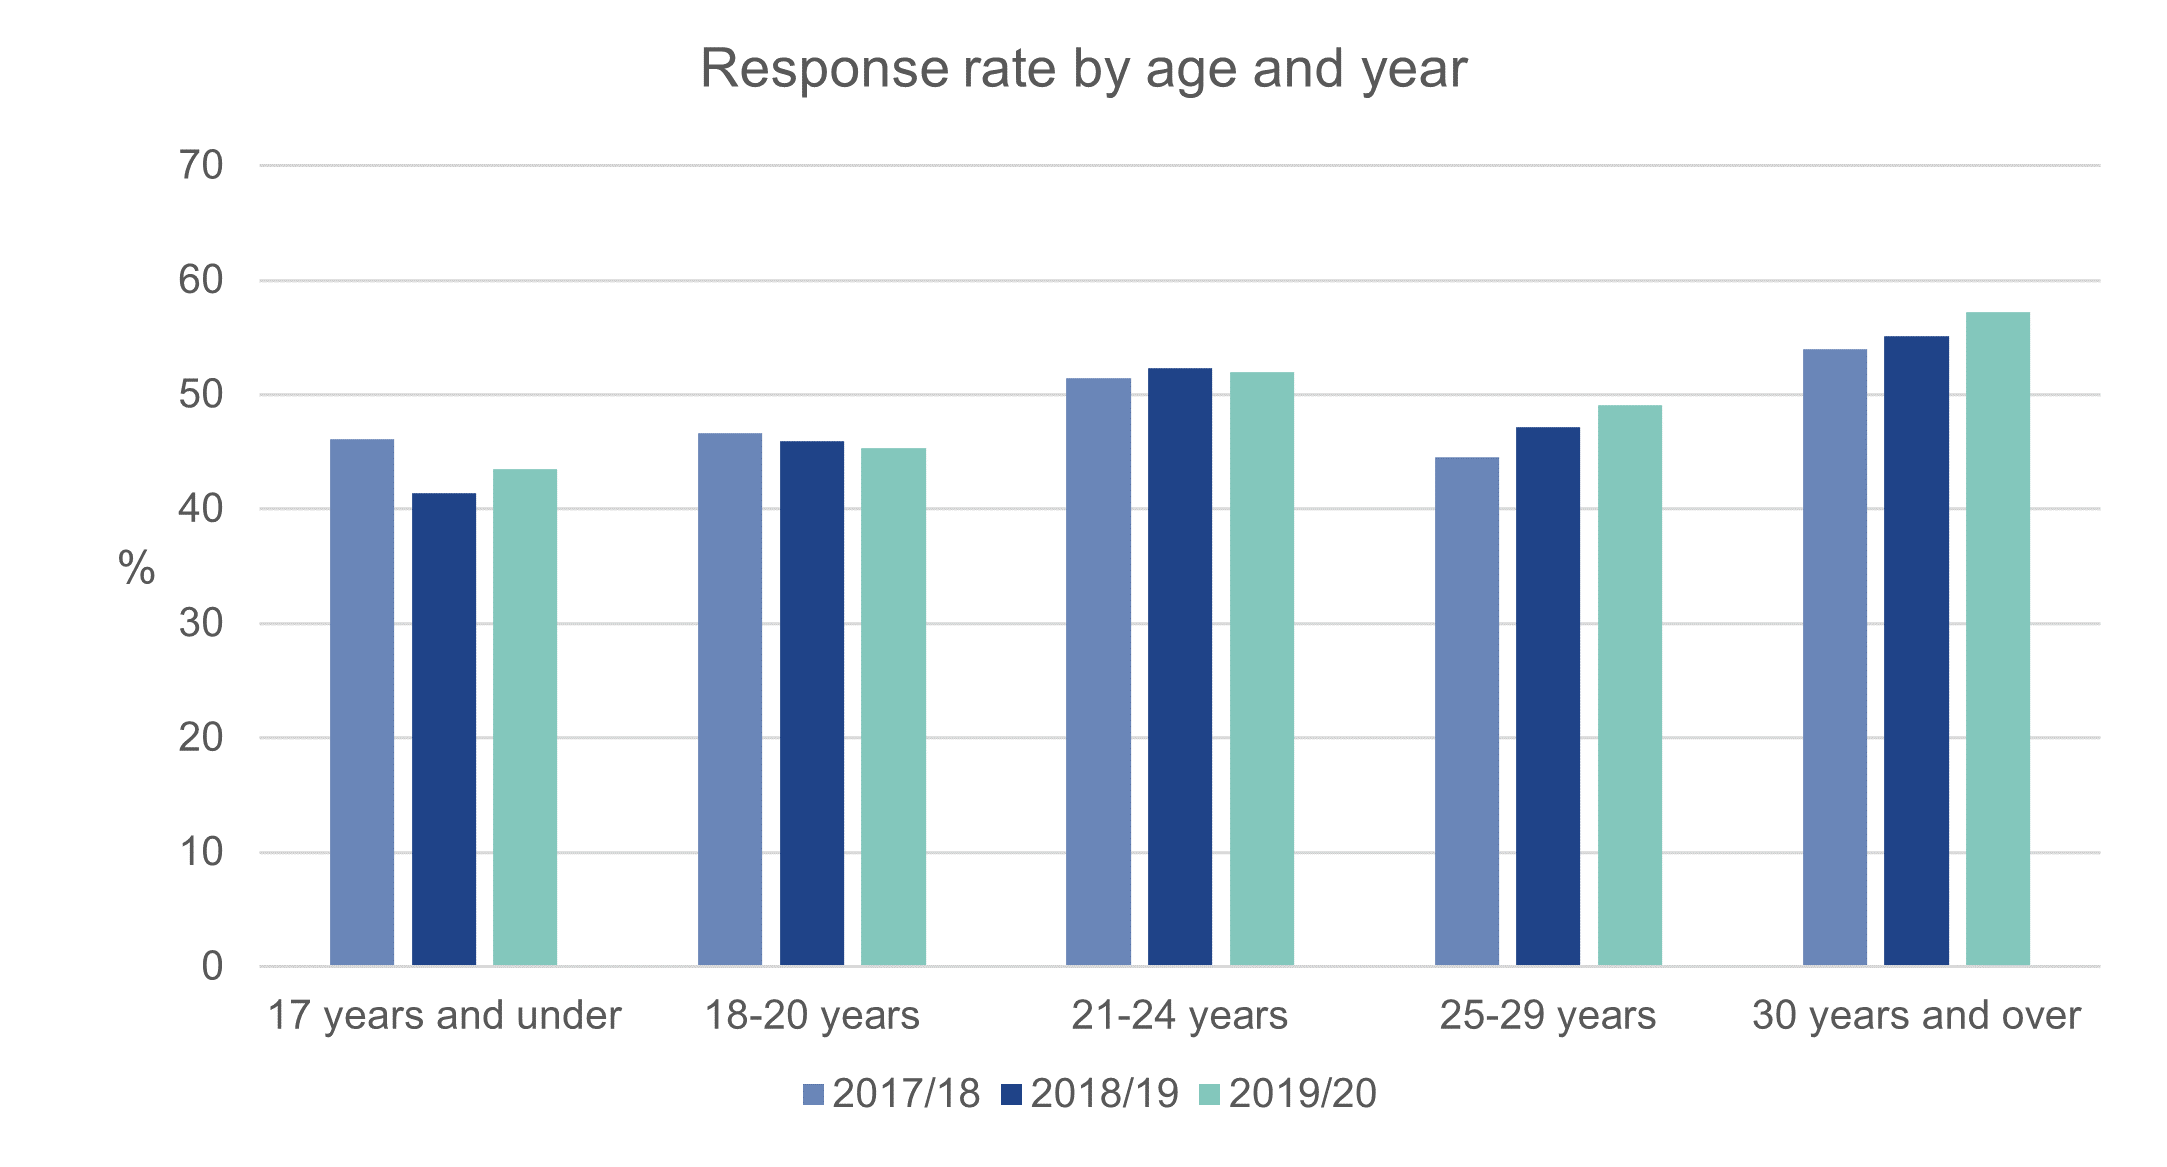
Figure 4. Response rates by age and survey year
Sex
We also revisited response rates by sex (Figure 5). It was already apparent last year that the pandemic was having a disproportionate effect on the employment of women; further research conducted as the pandemic continued confirmed that women were both more likely than men to report job losses and more likely to reduce working due to caring responsibilities.[3] In both the 2018/19 data and the 2019/20 data, however, we saw no change in response rate by sex following the start of the pandemic. Response rates for both men and women have increased very slightly (by one percentage point or less) for each of the three years of surveying. While we saw a one percentage point dip in the response rates for graduates whose sex was recorded as ‘other’ in 2018/19, the response rate for that group – which represents a very small proportion of the total population – increased again in 2019/20 and is now back to the level which we saw in 2017/18.
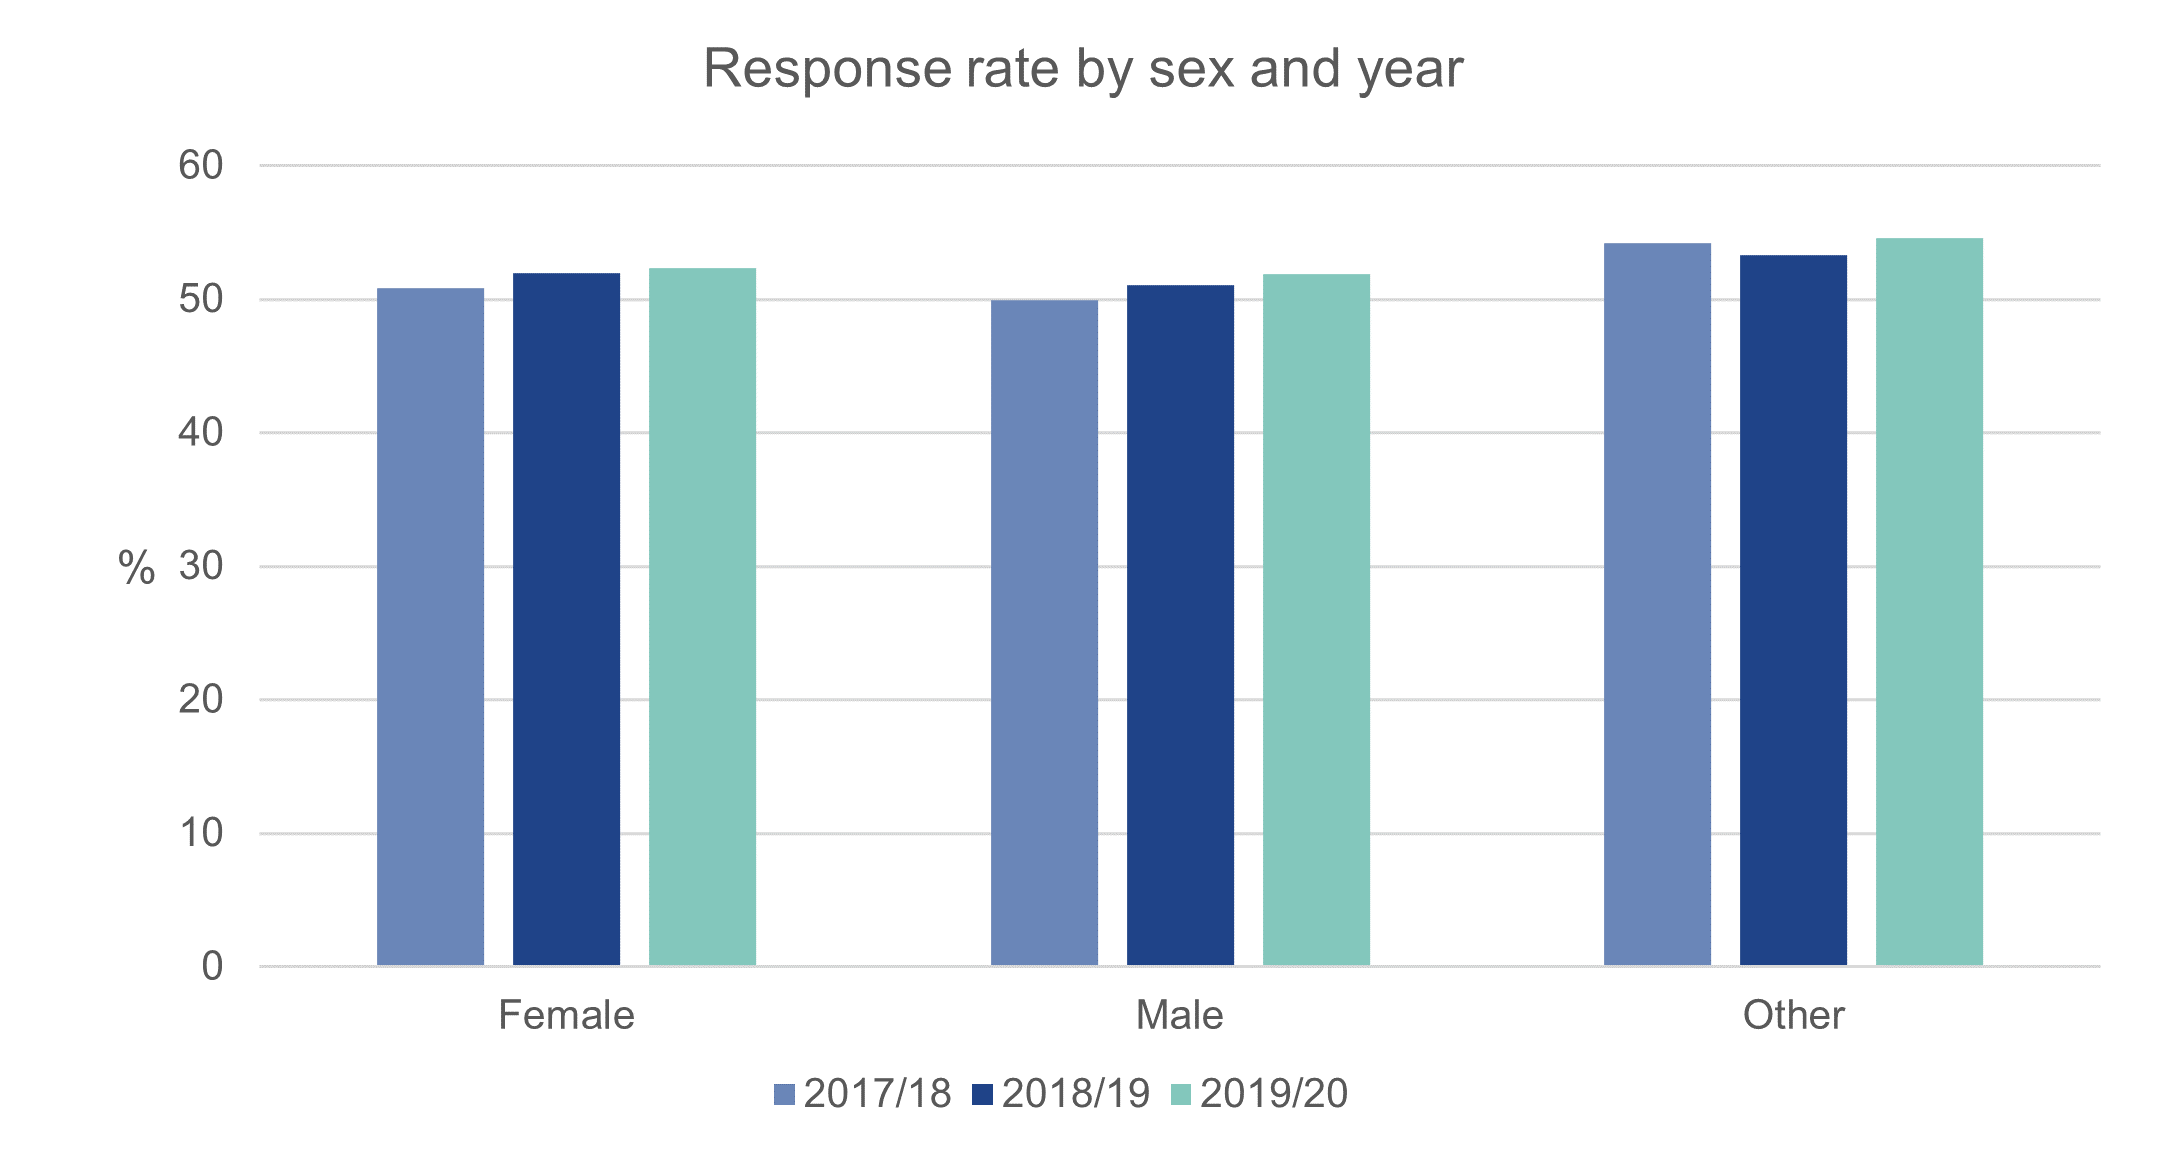
Figure 5. Response rates by sex and survey year
Ethnicity
As we did last year, we also looked at response rates for UK domiciled graduates from different ethnic groups. Throughout the pandemic, the health effects of COVID-19 have been unequally distributed across ethnic groups, with most ethnic minority groups experiencing higher rates of mortality than the White British group; since the start of the vaccination programme, moreover, members of ethnic minority groups have continued to be less likely to be fully vaccinated than their White British counterparts.[4] Although we see some variation in response rates by ethnicity, this variation does not correlate with the severity of pandemic effects; graduates of Chinese ethnicity, for example, have some of the lowest survey response rates, despite the fact that people of Chinese ethnicity in the UK have had relatively good health outcomes during the pandemic.[5] Moreover, we have seen no notable year-on-year changes in response rate for graduates from different ethnic groups, suggesting that the differing health impacts of the pandemic by ethnicity have not affected graduates’ willingness to respond (Figure 6).
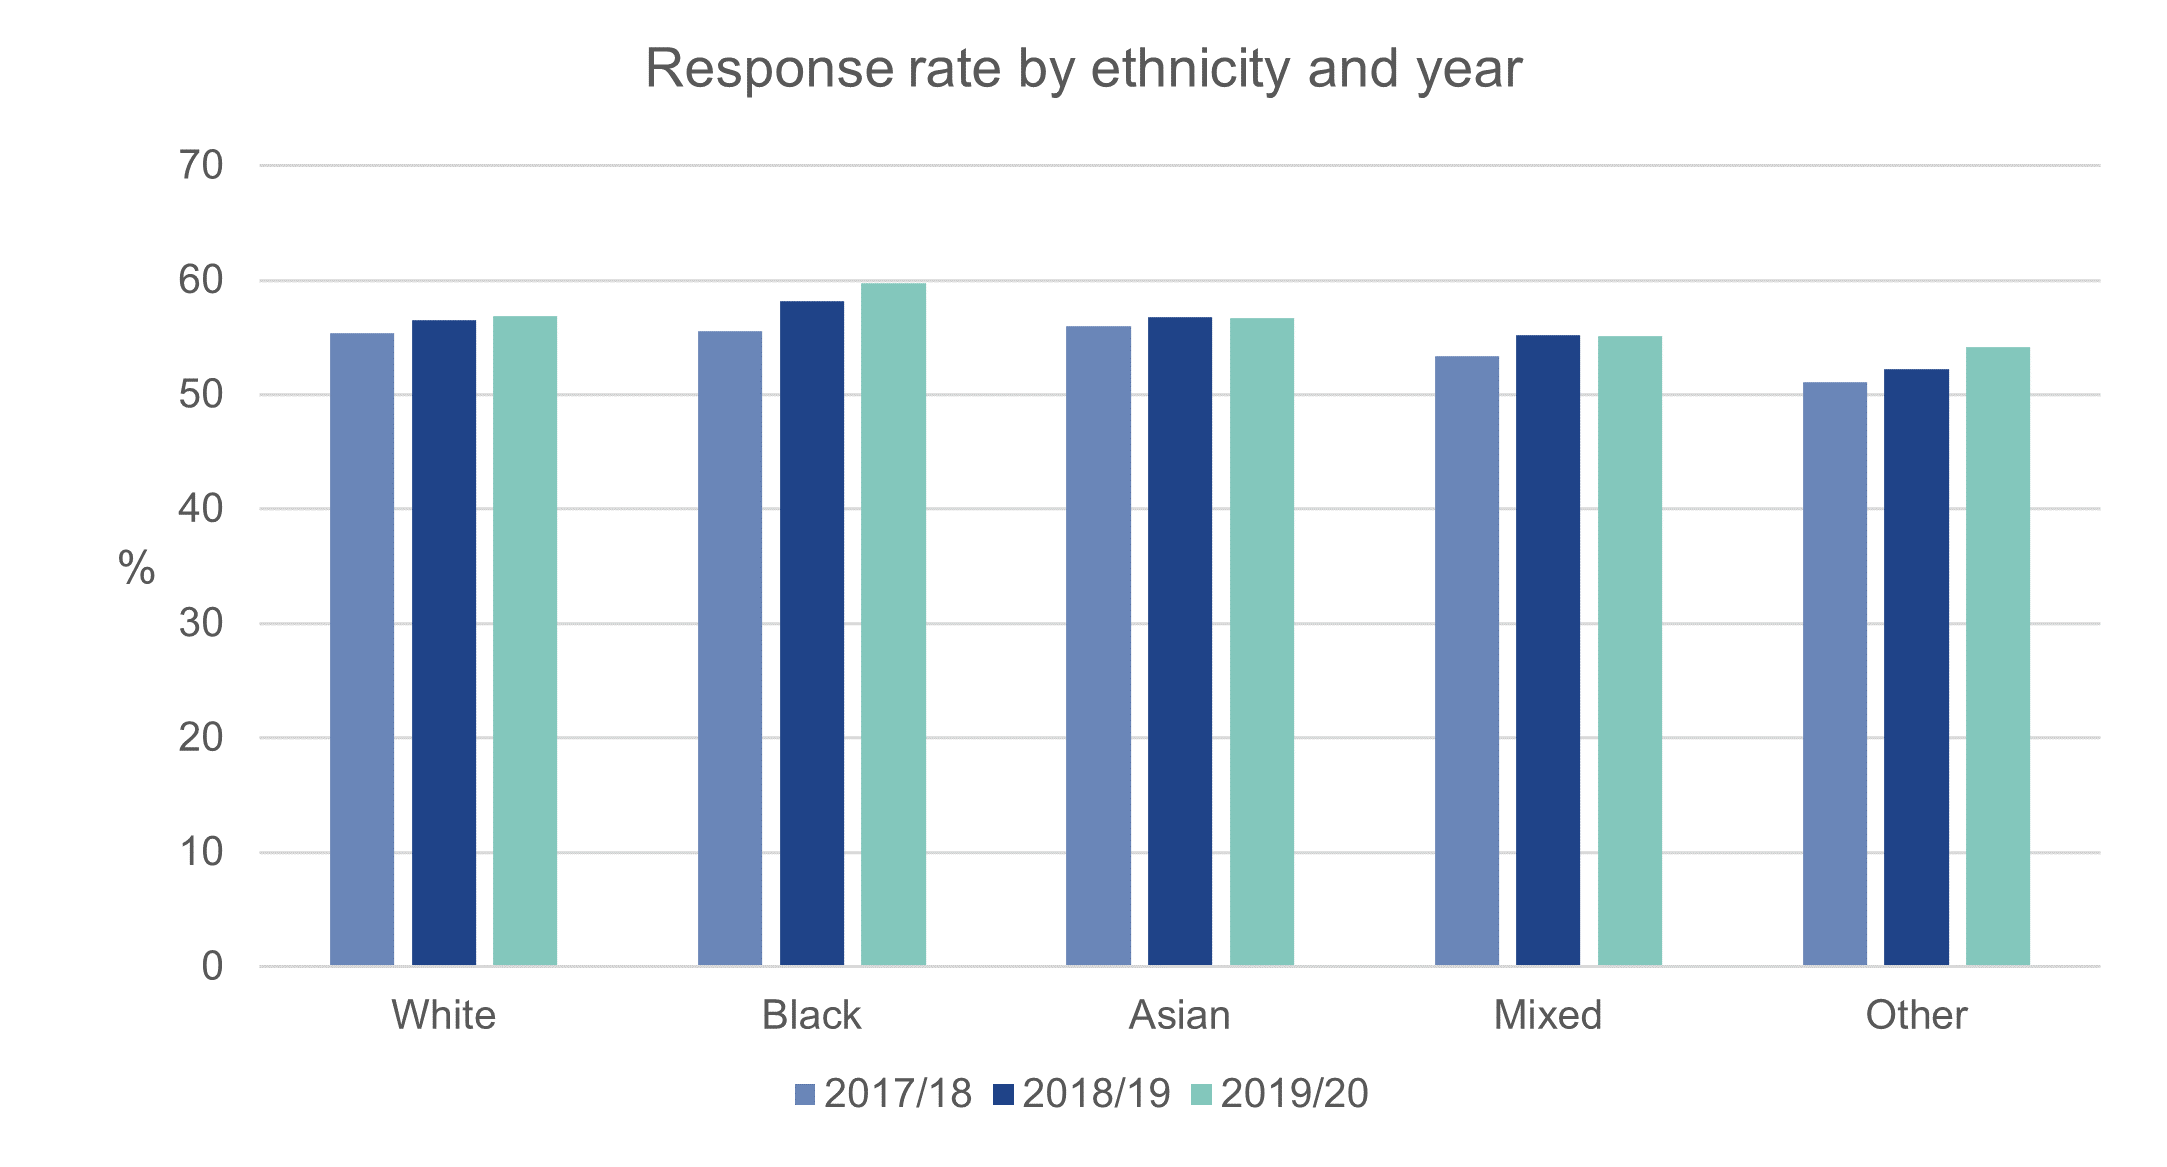
Figure 6. Response rates by ethnicity and survey year
Disability
The effects of the pandemic – including both the effects of COVID-19 itself and the effects of the restrictions put in place to reduce the spread of the virus – on people with disabilities have been marked. While the shift of many work and leisure activities to online formats due to lockdown enabled new levels of participation for some people with disabilities, these positive developments were typically outweighed by the fact that people with disabilities experienced more difficulties with access to routine health care, more adverse health effects due to COVID-19, and more damage to their mental health than those without known disabilities.[6] The differential effects of the pandemic on people with disabilities, however, do not seem to have led to changes in response rates. Graduates with disabilities have, over all three years of surveying, been more likely to respond to the survey than those with no known disabilities, and response rates for both groups have continued to increase very slightly year-on-year (Figure 7).
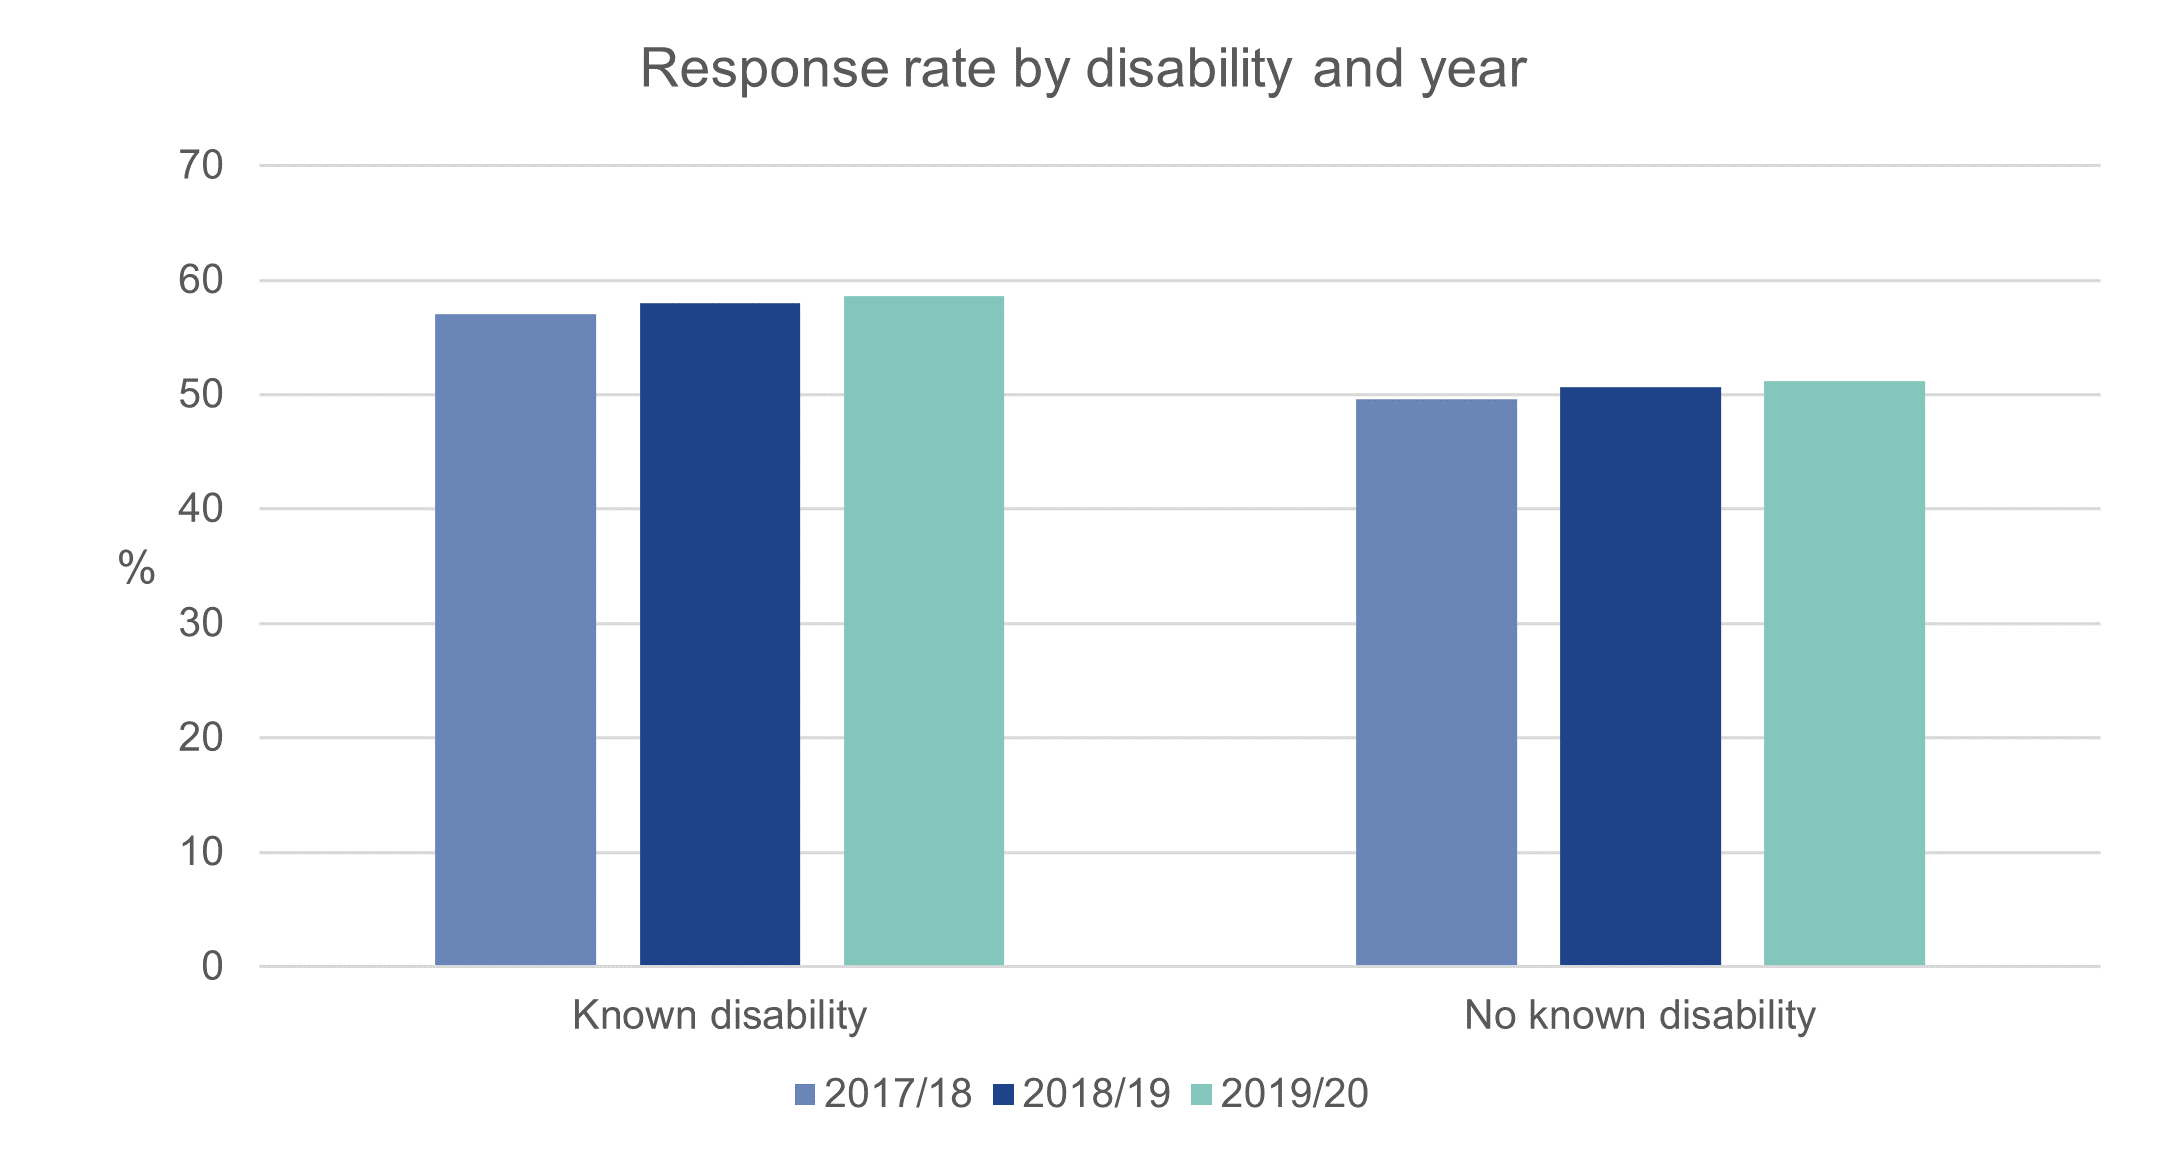
Figure 7. Response rates by disability status and survey year
Overall, as was the case in last year’s analysis, we saw no notable year-on-year changes in the response rates for graduates with different personal characteristics. Across the board, survey response rates held steady or continued to increase in the third year of surveying, despite the tumultuous times in which graduates were surveyed. Although the 2019/20 graduates will have had a different experience of the pandemic than the 2018/19 cohort, with many 2019/20 graduates finishing their higher education courses and beginning their careers under lockdown, the pandemic circumstances under which they graduated and received the Graduate Outcomes survey do not seem to have affected their willingness to respond.
Graduates in the second year of the pandemic
In addition to investigating whether the pandemic, in making some graduates less likely to respond than others, may have had an impact on the extent to which our data was representative of the target population, we also wanted to see what 2019/20 graduates were doing 15 months after completing their higher education courses and how they were feeling – both about their activities and about their lives more generally. We were interested in any possible effects of the pandemic which might distinguish the experiences of 2019/20 graduates from the experiences either of 2018/19 graduates or of the pre-pandemic 2017/18 cohort.
Last year, when we observed only minor changes which might be linked to the pandemic, we noted that the 2018/19 graduates were not yet those who graduated into the pandemic. This year, looking at a cohort of graduates, many of whom graduated into the pandemic and all of whom were surveyed against the backdrop of the ongoing pandemic, we expected to see more striking changes. Past research has shown that graduating into difficult economic circumstances can have lasting effects on graduates’ career success, and early examinations of the graduate labour market in late spring 2020 suggested a decrease in the availability of jobs for new graduates.[7] It seemed likely that 2019/20 graduates might struggle in ways that their 2018/19 counterparts, all of whom had at least seven months between finishing their courses and the start of the pandemic, had not.
Graduate activities, overall and by cohort
Looking at graduate activities across the whole of the 2019/20 survey year, we saw few notable changes since 2018/19, and the changes we saw were generally smaller in magnitude than those we observed between 2017/18 and 2018/19 (see Graduate Outcomes Figure 1 below).
Figure 1 - Graduate outcomes by activity
Academic years 2017/18 to 2019/20
Although we saw only minor changes, the direction of those changes is worth noting. In most cases, the changes observed in the 2019/20 survey data go some way towards reversing the trends we saw in the 2018/19 data. Thus, unemployment (including those unemployed and due to start work or study), which had increased from 4.9% in 2017/18 to 6.7% in 2018/19, is down slightly in 2019/20, to 6.0% (although note that, due to rounding, this change is not visible in the figure above). Similarly, full-time employment, which had decreased from 58.8% to 56.2% between 2017/18 and 2018/19, has gone up to 57.1% in 2019/20. The full-time employment rate which we see in the 2019/20 data has not quite returned to the level of our pre-pandemic data, but employment rates may be recovering. This possibility is supported by ONS data covering the same period, which shows an overall employment rate for November 2021 which is 1.1 percentage points lower than before the pandemic, but 0.5 percentage points higher than in the previous year.[8] While we expected to see an increase in graduates pursuing further study in the face of labour market uncertainty, we saw no noticeable year-on-year change.
When we split our activity data by graduates’ personal characteristics, the small sizes of the groups in each activity category mean that changes between years did not lead to noticeable changes in the percentage of graduates in each group. That said, we can make a few observations. When we look at the activities of 2019/20 graduates in different age bands, we see the biggest (albeit still quite small) increases in full-time employment and decreases in unemployment amongst graduates aged 21-24, the same group whose full-time employment rate had fallen most sharply between 2017/18 and 2018/19. We see a similar trend when we look at activities by ethnicity, with White graduates seeing the sharpest decrease in full-time employment in 2018/19 and the sharpest increase in full-time employment in 2019/20.
A different story potentially emerges when we look at disability. Between 2017/18 and 2018/19, the biggest changes we saw were in the employment outcomes of graduates with no known disability, whose levels of full-time employment decreased, while their levels of part-time employment and unemployment increased. Between 2018/19 and 2019/20, on the other hand, the biggest changes we saw were in the employment outcomes of graduates with disabilities, whose levels of full-time employment, which had remained steady from 2017/18 to 2018/19, rose above the pre-pandemic baseline. This presents an interesting contrast to ONS data on employment rates for people with disability in the workforce as a whole, which are now returning to pre-pandemic levels, but only after a sharp drop in the second half of 2020.[9] It may be that, while the pandemic restricted employment opportunities for people with disabilities in the wider workforce, graduates with disabilities were better placed to benefit from the increasing potential for remote working in many professional occupations.[10]
Given the different contexts in which graduates in each of the four 2019/20 cohorts finished their higher education studies and were surveyed 15 months later, we also looked at the 2019/20 activity data on a cohort-by-cohort basis. In terms of both full-time employment and unemployment, we seem to see a difference between those graduates in cohorts A and B and those in survey cohorts C and D (Figure 8).
Figure 8 - Graduates activities by cohort
Academic years 2017/18 to 2019/20
For the 2019/20 cohorts A and B, the rate of full-time employment is lower than it was for the equivalent 2018/19 cohorts, while unemployment is higher. 2019/20 cohorts C and D, however, have higher rates of full-time employment and lower rates of unemployment than their 2018/19 counterparts, and, in fact, look much like the equivalent 2017/18 cohorts. The explanation for this pattern seems to lie in the context under which the different cohorts were surveyed, with those who were surveyed under stringent pandemic restrictions, i.e., cohorts C and D in 2018/19 and cohorts A and B in 2019/20, experiencing relatively high rates of unemployment and relatively low rates of full-time employment. The rates of unemployment for the cohorts surveyed under restrictions are about a percentage point higher than those of the equivalent pre-pandemic cohort, while full-time employment rates are about a percentage point lower. The 2019/20 cohorts C and D may have graduated into lockdown, but they were surveyed under relatively loose restrictions, and, as far as employment outcomes are concerned, the relative lack of restrictions under which they were surveyed seems to have been more important than the difficult circumstances under which they finished their studies.
Employment by level and industry
The first years of the COVID-19 pandemic are known to have had an adverse effect on the labour market, with falls in employment in every over-16 age bracket between the start of the pandemic and the end of 2021.[11] From the Graduate Outcomes data for 2018/19 and 2019/20, we have seen that graduate employment was likewise affected, with slightly fewer graduates in full-time employment in the two ‘pandemic years’ than were in full-time employment before the pandemic began. Given that the employment impacts of the pandemic were not evenly distributed across different sectors of the economy, it therefore seemed sensible to ask whether we would see changes in the kinds of jobs held by graduates during the pandemic.[12]
The kinds of jobs carried out by graduates can be categorised in two different ways on the basis of Graduate Outcomes data. On the one hand, jobs fall into different Standard Occupational Classification (SOC) groups, which, broadly speaking, refer to the type and level of skill required to do a job. On the other hand, jobs contribute to different industries and consequently are assigned to different sections of the Standard Industrial Classification (SIC).
When we look at the percentage of graduates in employment working in different SOC groups over the past three years, we see very little change over time (Figure 9). Since many professional jobs and other jobs frequently held by graduates are among the jobs which could most easily be carried out remotely under lockdown restrictions, it is unsurprising that the percentage of graduates working in these occupations did not decrease after the start of the pandemic.[13] We saw increases of one percentage point each in employment in sales and customer service occupations and elementary occupations in the 2018/19 data, followed by a corresponding decrease in 2019/20; while this may reflect increased demand during the pandemic for certain occupations, such as supermarket cashiers and delivery drivers, it is just as likely that this represents normal year-on-year variation.
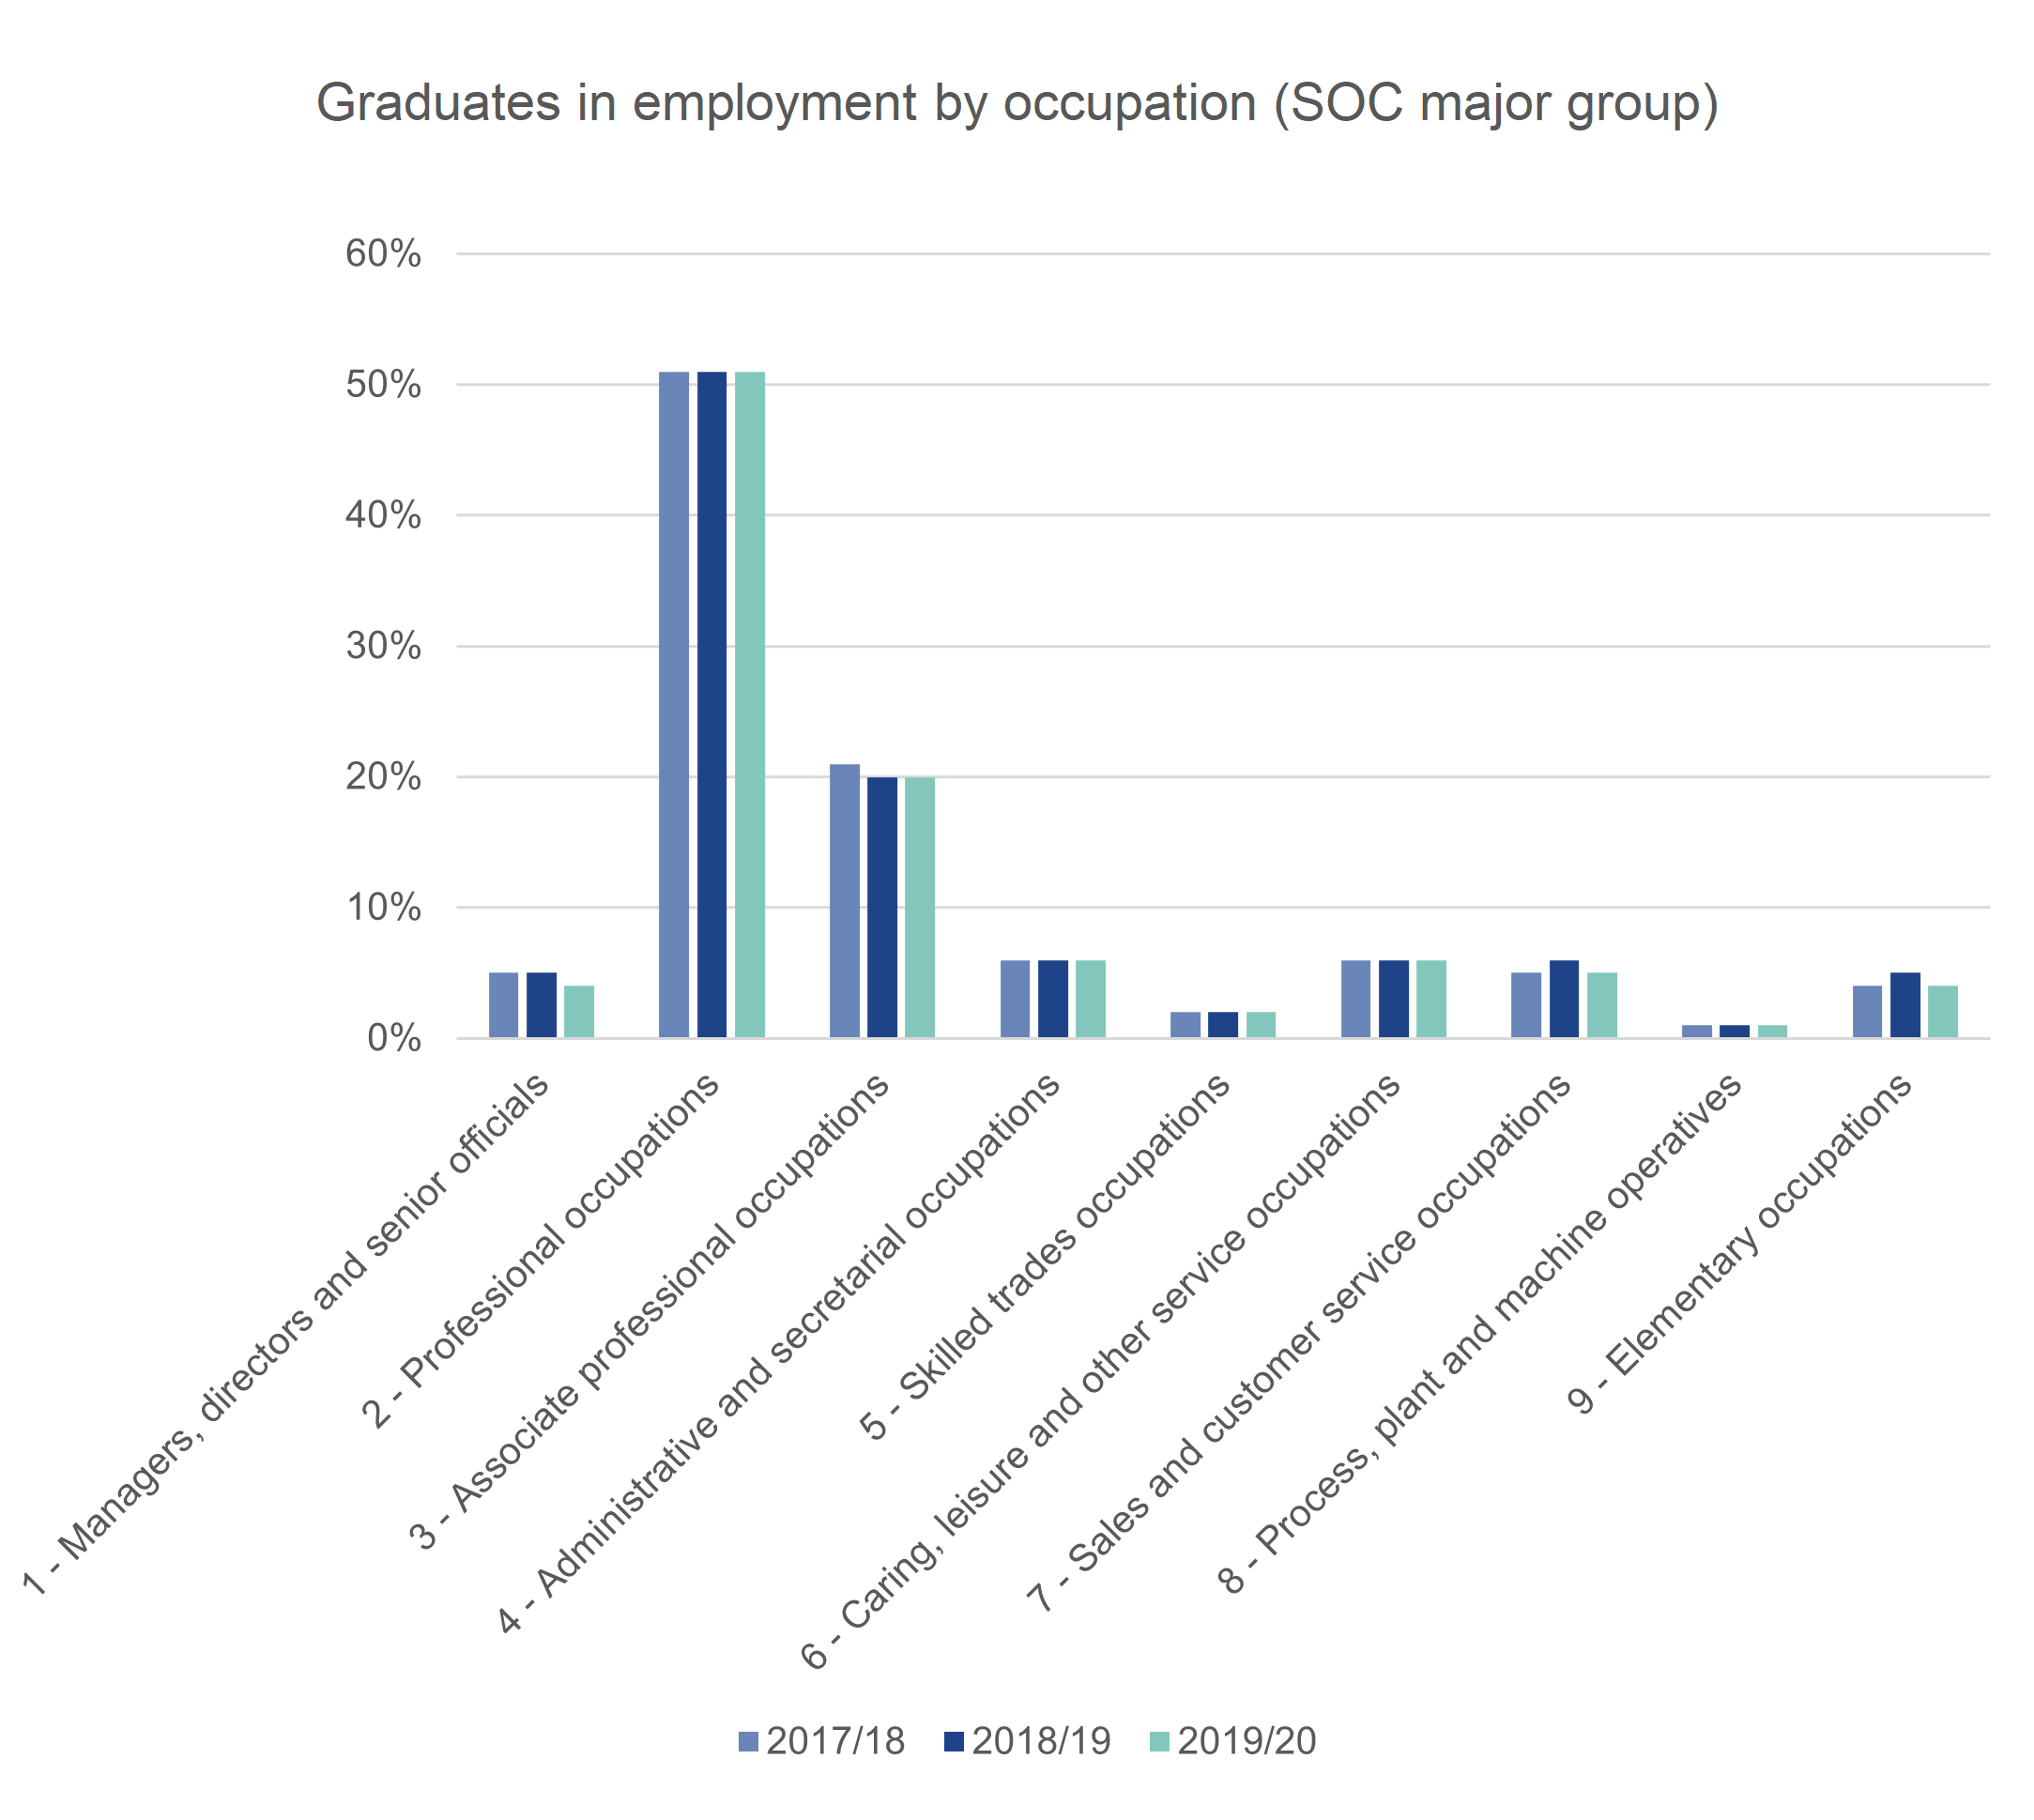
Figure 9. Graduates in employment, by SOC major group
When we group the nine SOC major groups into three broad skill levels, we likewise see little change in the employment outcomes of graduates over the past three years (Figure 10). Around three quarters of graduates in employment are employed in highly skilled occupations; this was true for 2017/18 graduates and has remained fairly steady since the start of the pandemic. This echoes other research on the impact of the pandemic on the labour market, which shows that graduates in highly skilled occupations were shielded from some of the more drastic effects of the pandemic on employment.[14] Although we do see a dip in the proportion of graduates in highly skilled employment of one percentage point in 2018/19, followed by a rise of one percentage point in the following year, there is no reason to think that this goes beyond the level of variation that would normally be expected between one year and the next.
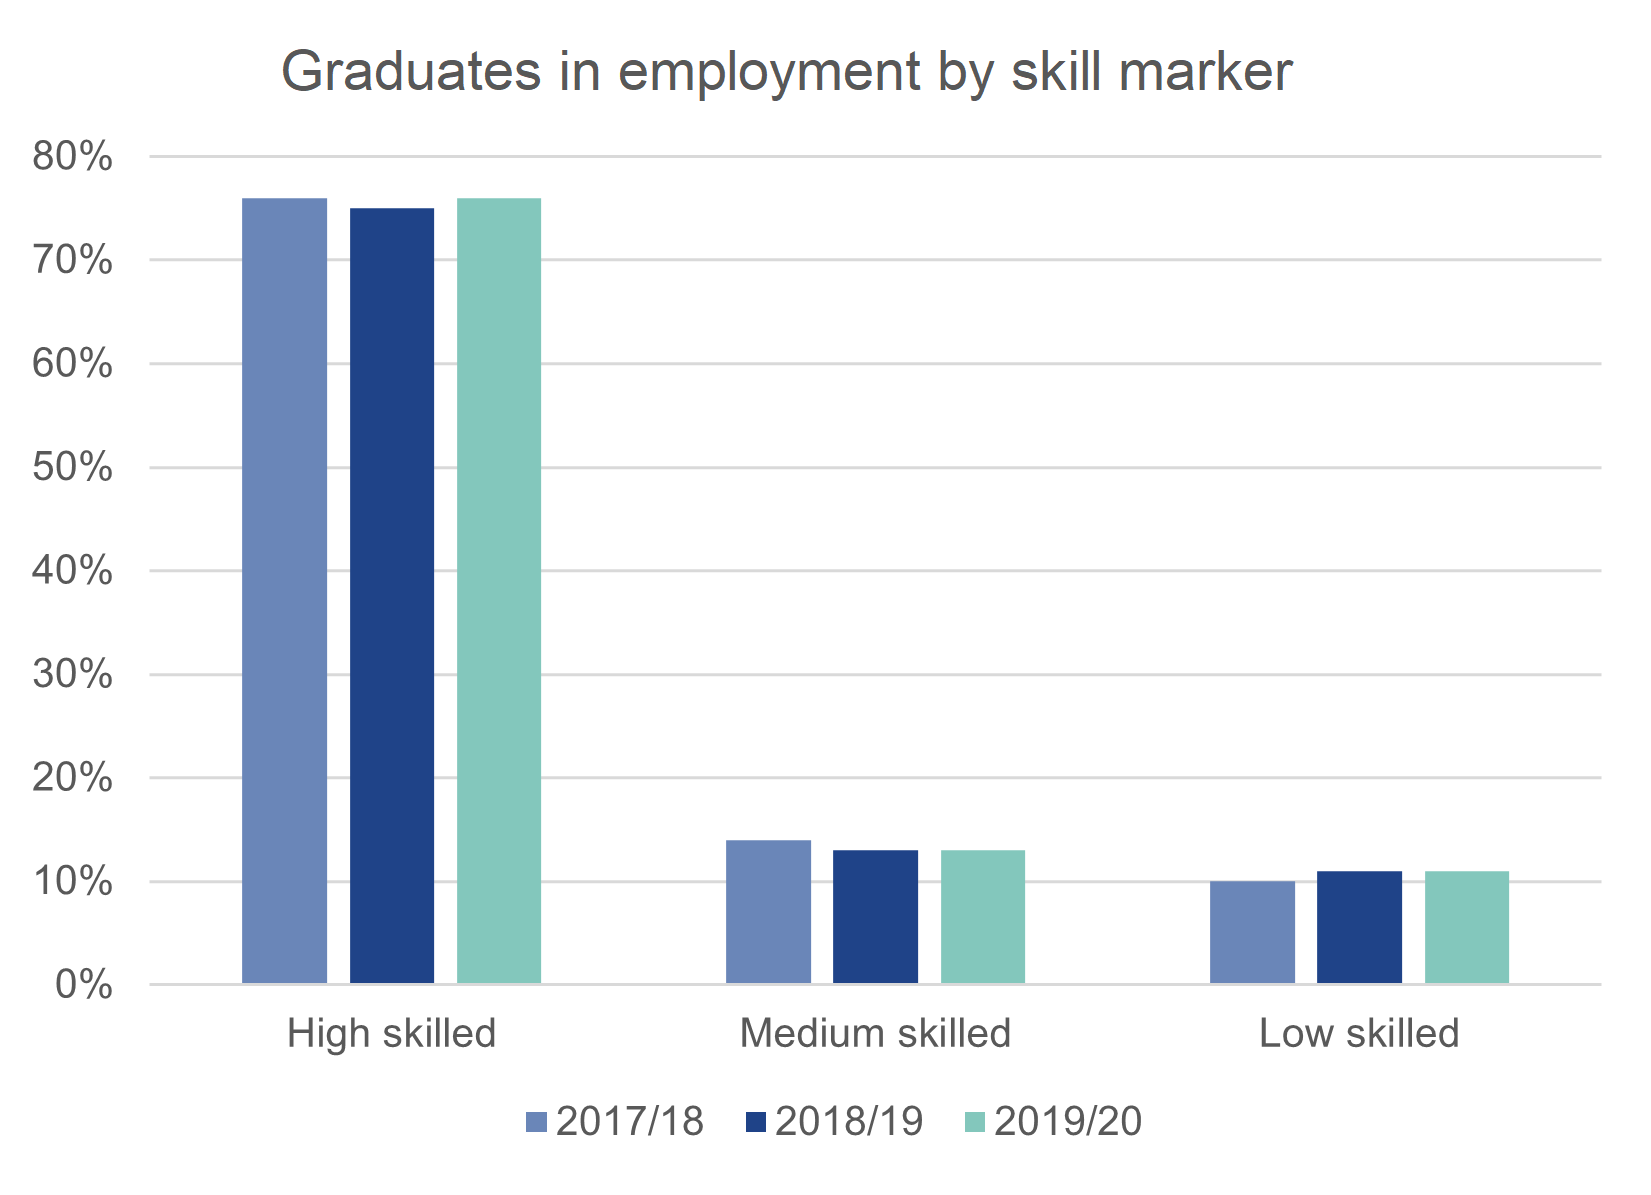
Figure 10. Graduates in employment, by skill marker
We expected to see slightly more noticeable changes in the industries in which graduates were working. Given that many arts venues and hospitality businesses were unable to operate as usual while pandemic restrictions were in force, we expected the percentage of graduates working in those industries to decrease. Conversely, given the high visibility of medical professions since the start of the pandemic, it seemed plausible that we might see more graduates working in health-related fields. We saw no notable change in the rate of graduate employment in accommodation and food service activities, but we did see a slight decrease (of 0.6 percentage points) in the 2018/19 data in graduates working in arts and entertainment and a slight increase (of 1.2 percentage points) in graduates working in human health and social work activities. These changes, however, like the changes we saw in occupational group, are so small that we cannot be sure they reflect anything beyond normal variation. Research by the ONS covering graduate employment during the pandemic comes to the same conclusion, noting that at ‘[the] aggregate level, graduates’ employment within industries has not been greatly affected by the pandemic.’[15]
Some subjects of study tend to feed graduates into certain occupations and industries, so it would have been interesting to assess whether there were any changes in activity during the pandemic for graduates who studied different subjects. However, HESA changed its subject coding frame from JACS to HECoS for the 2019/20 academic year, meaning that there is a break in subject coding between the 2017/18 and 2018/19 data and the 2019/20 data. Work is currently planned to assess the suitability of the Common [subject] Aggregation Hierarchy (CAH), our subject mapping system, to enable time-series analysis of subject data. Until that work is complete, we have reached the conclusion that we cannot confidently present subject time-series comparisons that span the change in subject coding frames.[16]
Graduate reflections and subjective wellbeing
The widespread shift to homeworking at the start of the first lockdown, coupled with the furloughing of many employees who could not work from home, has been thought to have had potentially lasting effects on people’s attitudes towards work.[17] At the same time, it is widely accepted that the impacts of the COVID-19 pandemic over the past two years have extended beyond changes in economic activity and the health impacts of the virus itself to encompass mental health and subjective wellbeing. In last year’s analysis of the impact of the pandemic on the 2018/19 data, we looked at how responses to the graduate reflections and subjective wellbeing questions had changed since the start of the pandemic. We found few notable changes beyond a slight contraction in highly positive responses to the subjective wellbeing questions. This year, we have extended our analysis to see whether the different pandemic experiences of the 2019/20 graduates seem to have affected their responses.
The three graduate reflections questions ask graduates to what extent they feel their current activities are meaningful, fit with their future plans, and allow them to utilise what they have learned in their studies. When we compare responses to the graduate reflections questions for 2019/20 as a whole to responses from the previous two years, we see for all three questions a year-on-year decrease in the proportion of graduates who say they strongly agree and an increase in the proportion of graduates who say they agree, with the biggest differences between 2018/19 and 2019/20; the other three response categories have remained broadly stable over the three years of the survey.
At the cohort level, we see the biggest decreases in ‘strongly agree’ and increases in ‘agree’ since 2018/19 in cohort D of 2019/20, who were surveyed starting in September 2021 (Figures 11 to 13 below). Cohort A, who were surveyed starting in December 2020, show a slight increase in ‘strongly agree’ and a decrease in ‘agree’, when compared to the equivalent 2018/19 cohort. While we cannot be entirely certain about the reason for this difference between survey cohorts, it may be that the pandemic restrictions under which cohort A was surveyed tended to polarise their feelings about their activities; cohort D, who were surveyed under looser restrictions, in an atmosphere that felt increasingly normal, may have tended towards more moderate responses.
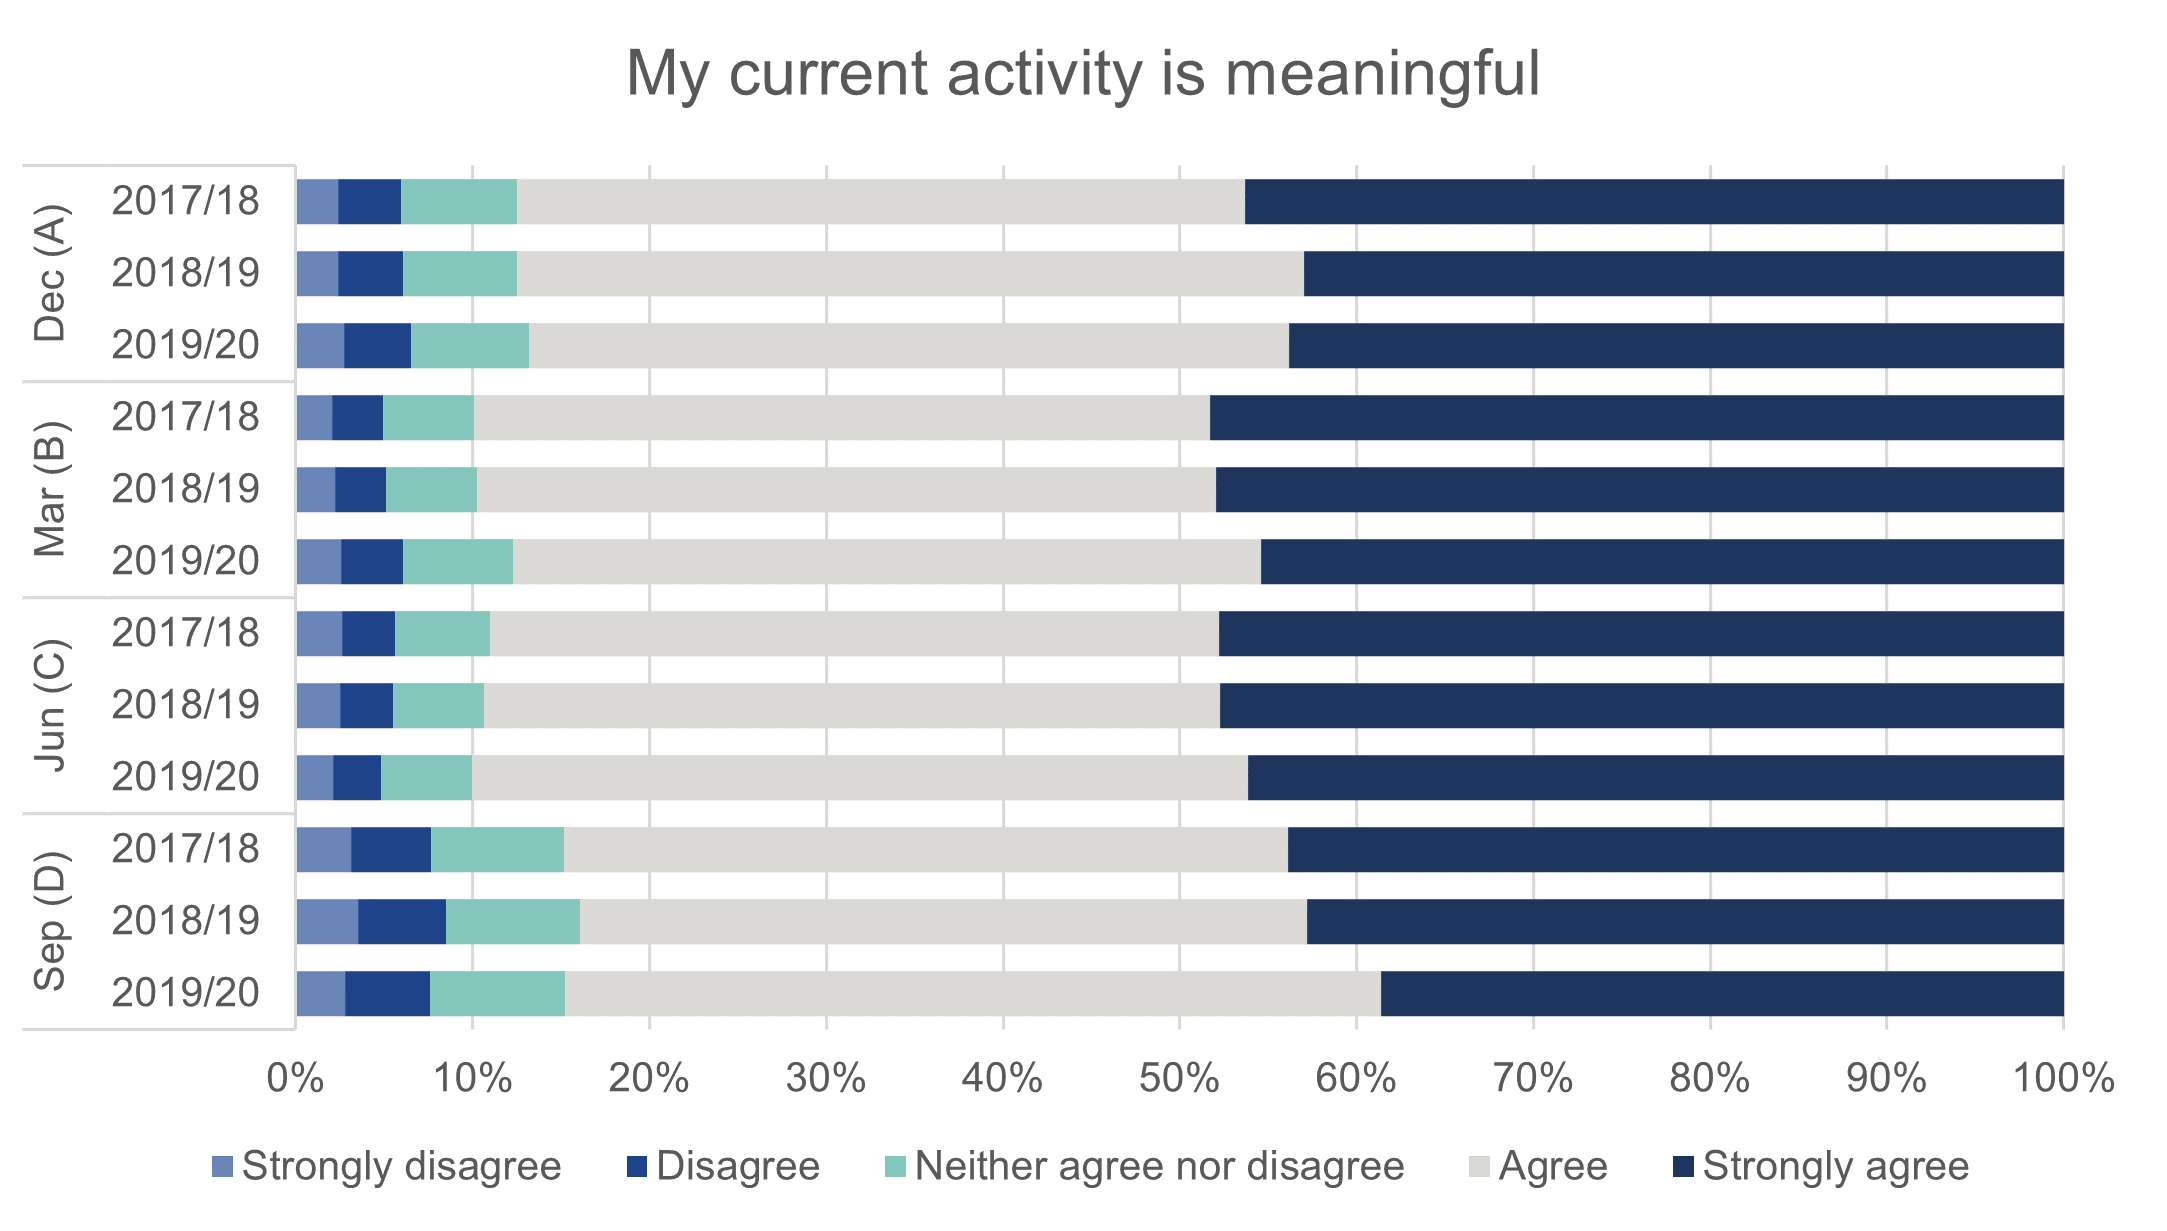
Figure 11. Graduates’ agreement with the statement ‘My current activity is meaningful’, by year and survey cohort
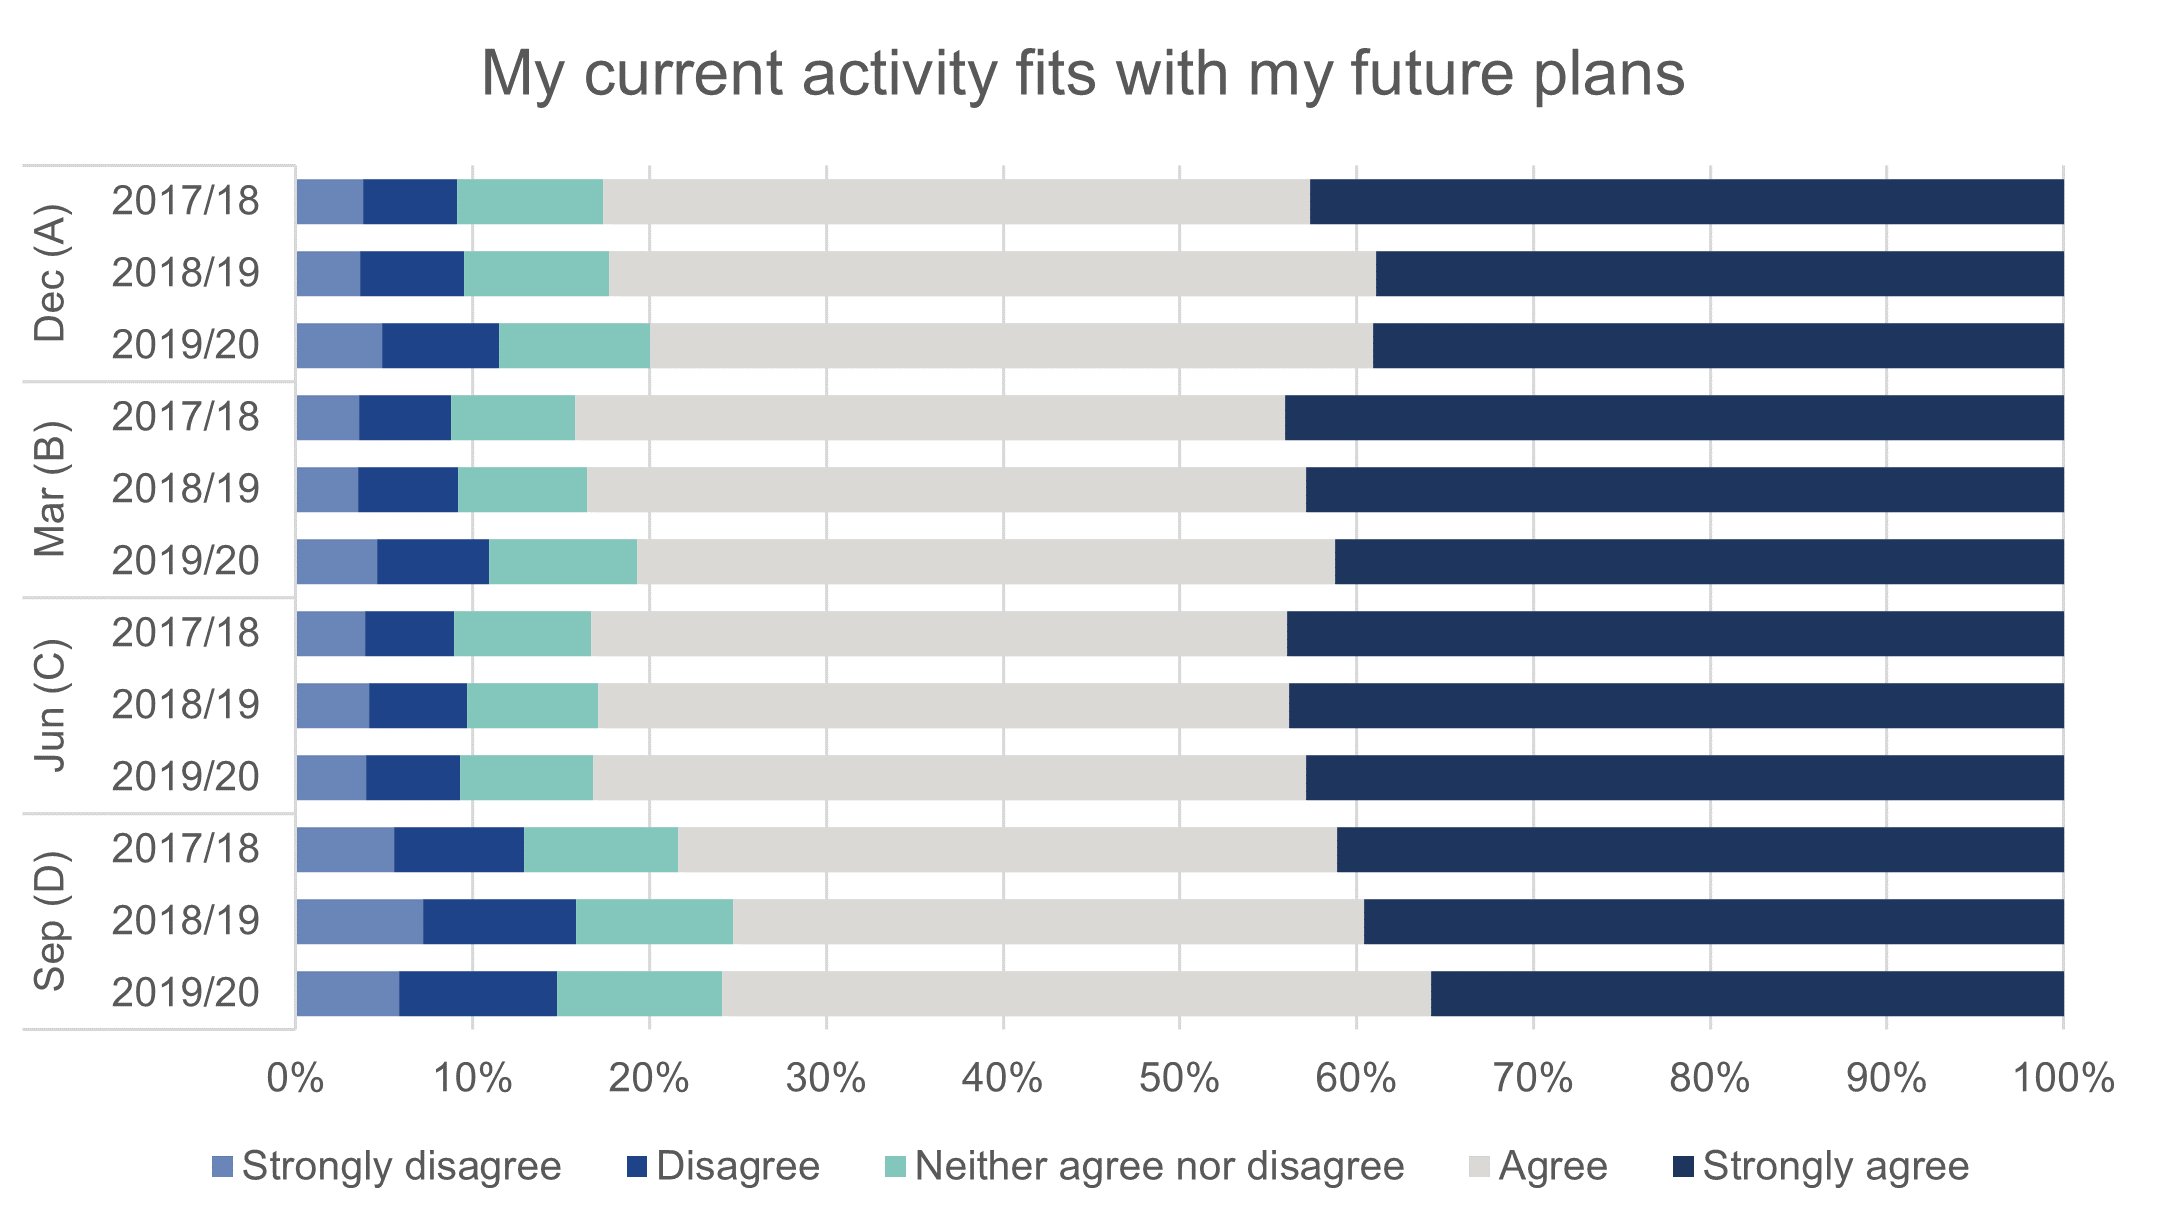
Figure 12. Graduates’ agreement with the statement ‘My current activity fits with my future plans’, by year and survey cohort
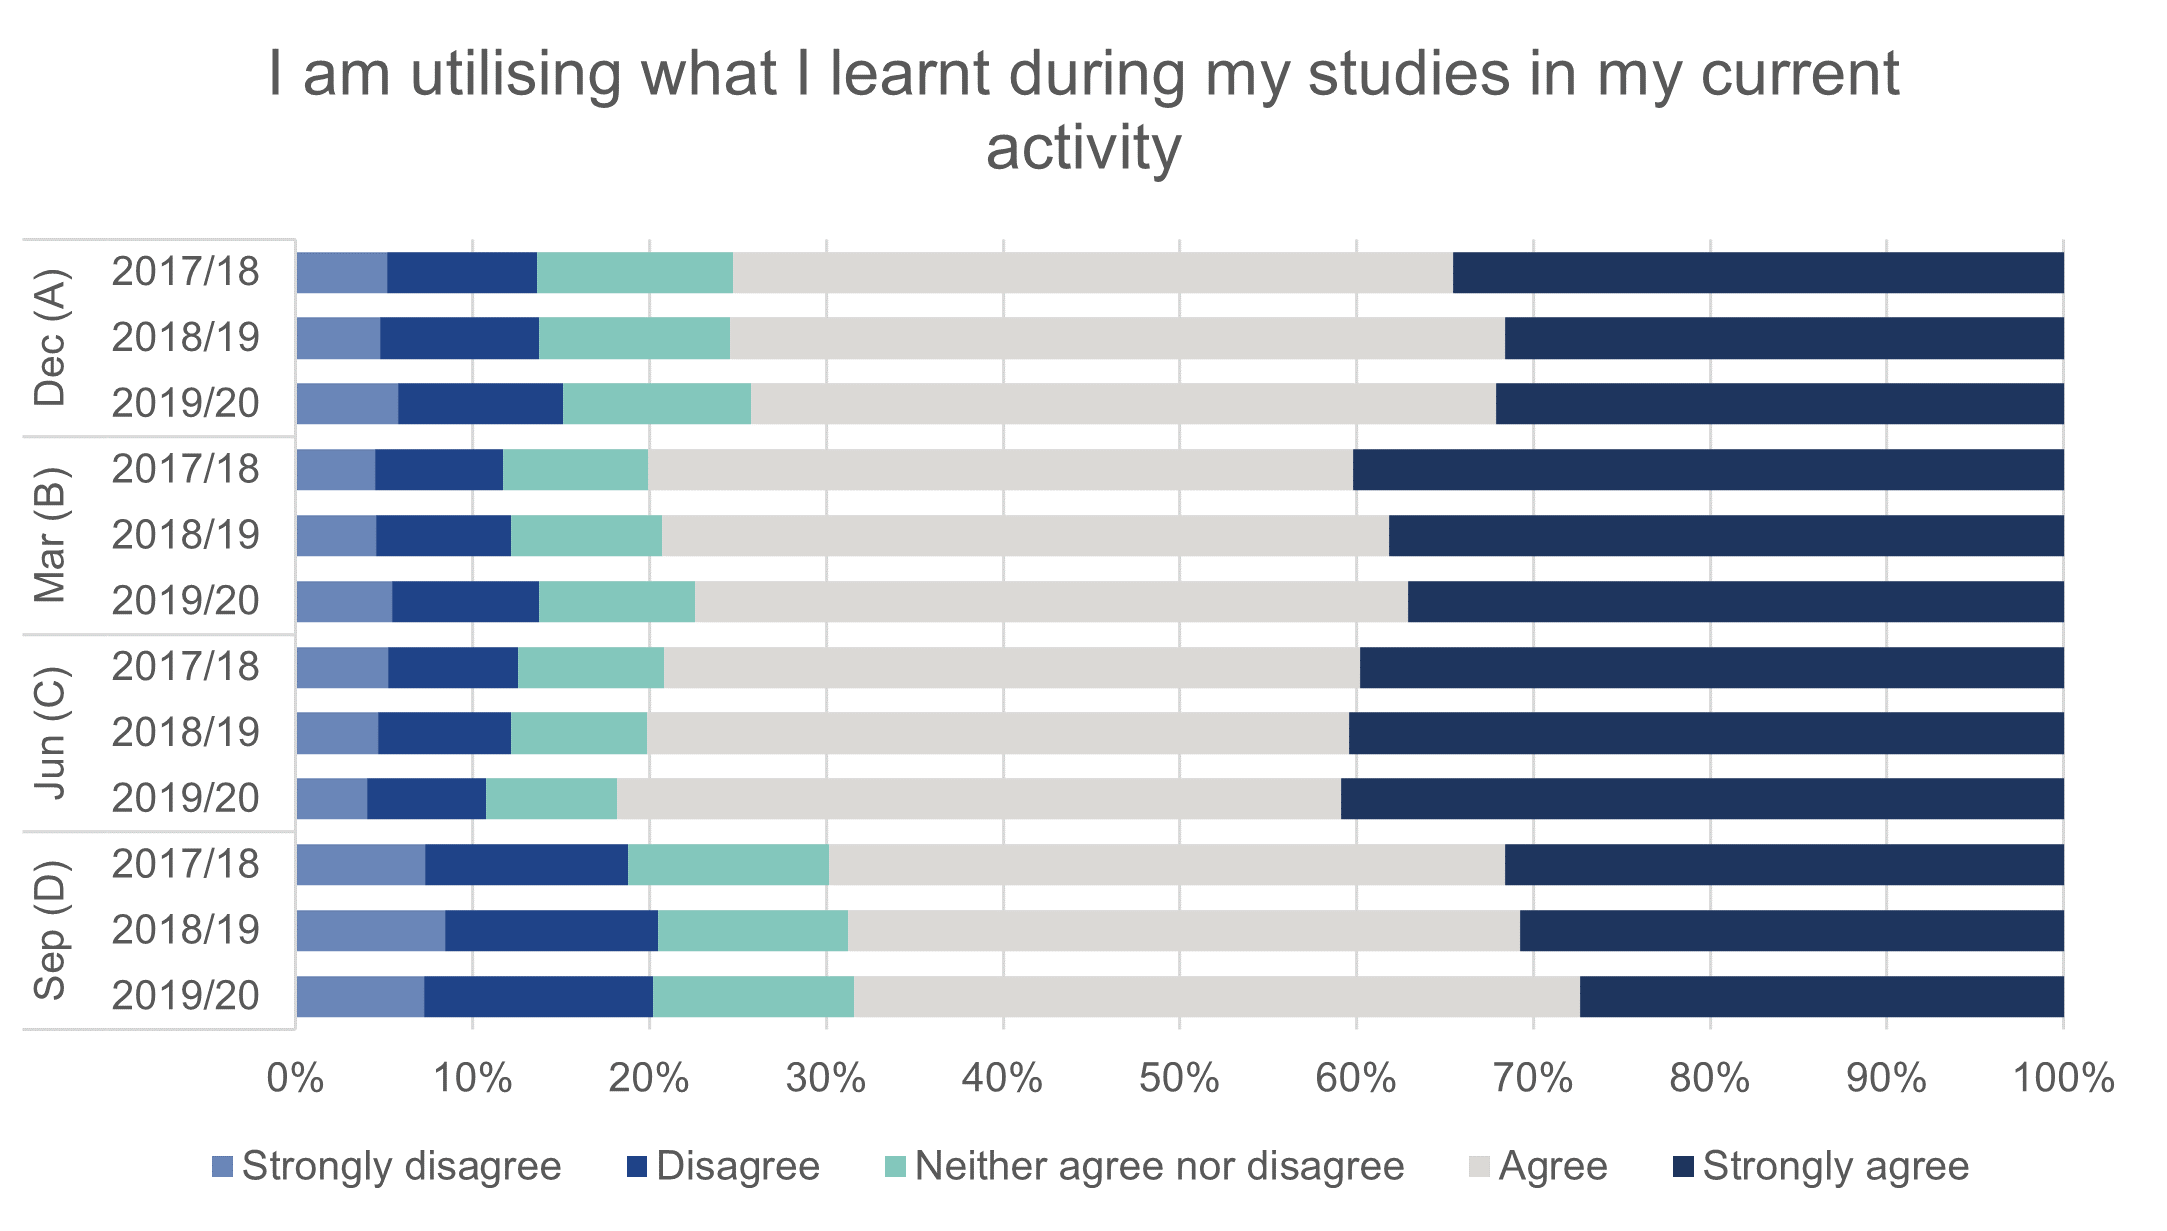
Figure 13. Graduates’ agreement with the statement ‘I am utilising what I learnt during my studies in my current activity’, by year and survey cohort
Since the start of the pandemic in March 2020, the ONS has recorded generally lower levels of subjective wellbeing across society, with the sharpest decreases in wellbeing generally correlating with more stringent restrictions.[18] When we compared 2019/20 responses to the four subjective wellbeing questions with responses from earlier years, we saw a continuation of last year’s decrease in highly positive responses. For the questions about anxiety and happiness, we saw the biggest changes between 2017/18 and 2018/19, with less dramatic changes between 2018/19 and 2019/20; the other two questions showed a steadier year-on-year progression. Even as other aspects of life have started to return to normal, it seems that graduate subjective wellbeing has not started to return to pre-pandemic levels.
Looking at the four subjective wellbeing questions by cohort, the picture is slightly more complicated (Figures 14 to 17 below). Cohort A shows a particularly marked increase in graduates reporting high levels of anxiety and decreases in graduates reporting themselves as very happy or very satisfied with life. In cohort B, surveyed beginning in March 2021, we see an increase in the proportion of graduates reporting very low levels of anxiety, as well as increases in graduates reporting high or very high levels of happiness. Cohorts C and D show smaller changes between 2018/19 and 2019/20 than we see in the previous two cohorts. In cohort A, the contrast in subjective wellbeing which we see between 2018/19 and 2019/20 most likely reflects the difference between the pre-pandemic circumstances under which cohort A of 2018/19 was surveyed and the rising case numbers and tightening restrictions which marked the same period in the following year. When surveying for cohort B of 2019/20 began in March 2021, lockdown restrictions were still in place, but falling case numbers and the rapidly progressing vaccination programme may have allayed some anxiety and encouraged graduates to think more positively about their lives.
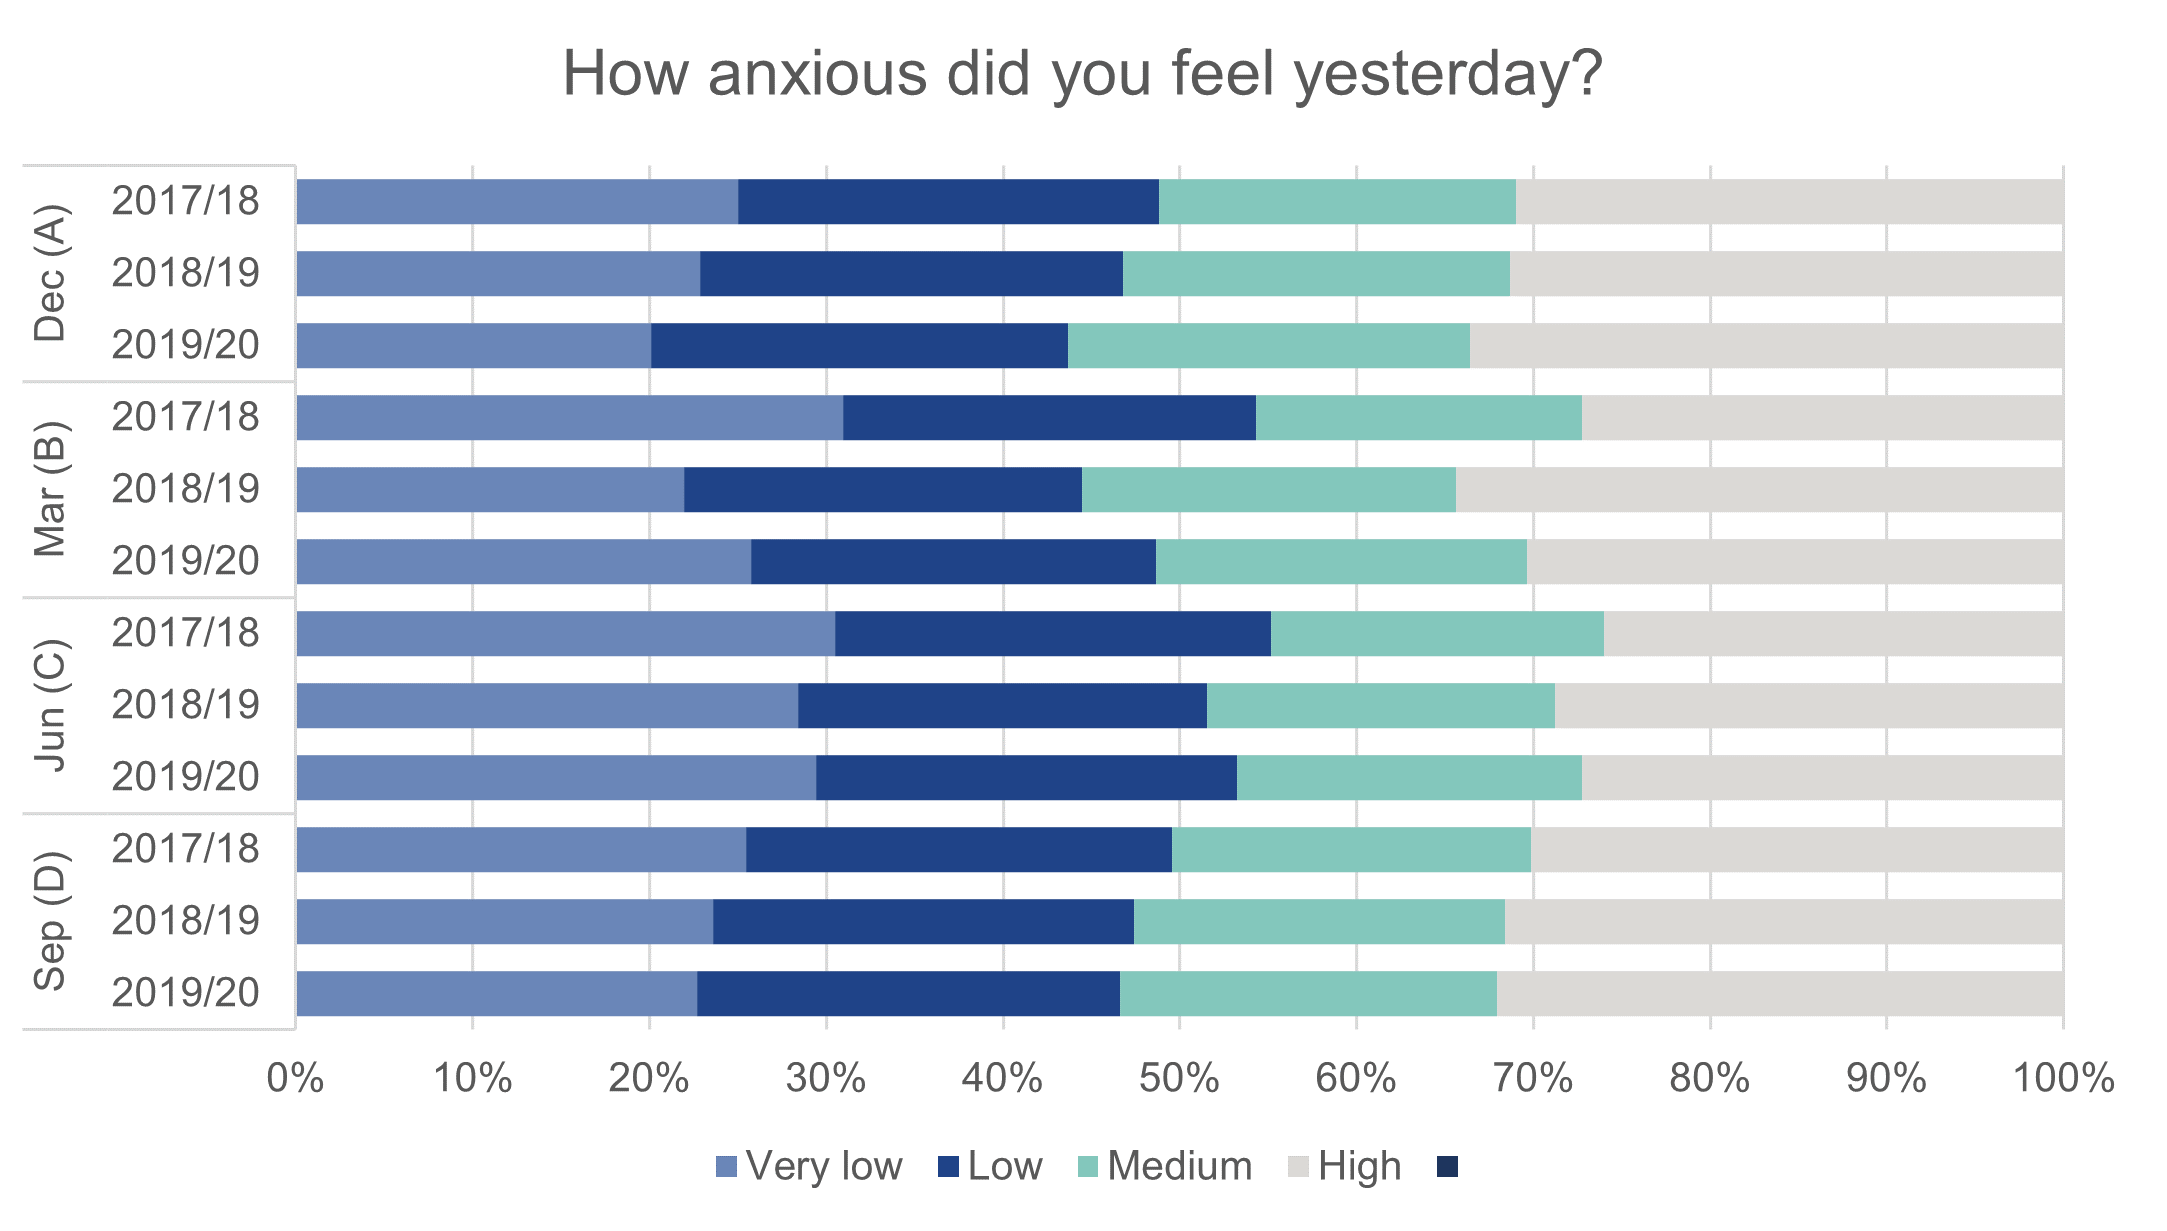
Figure 14. Graduates' own assessment of their anxiety, by year and survey cohort
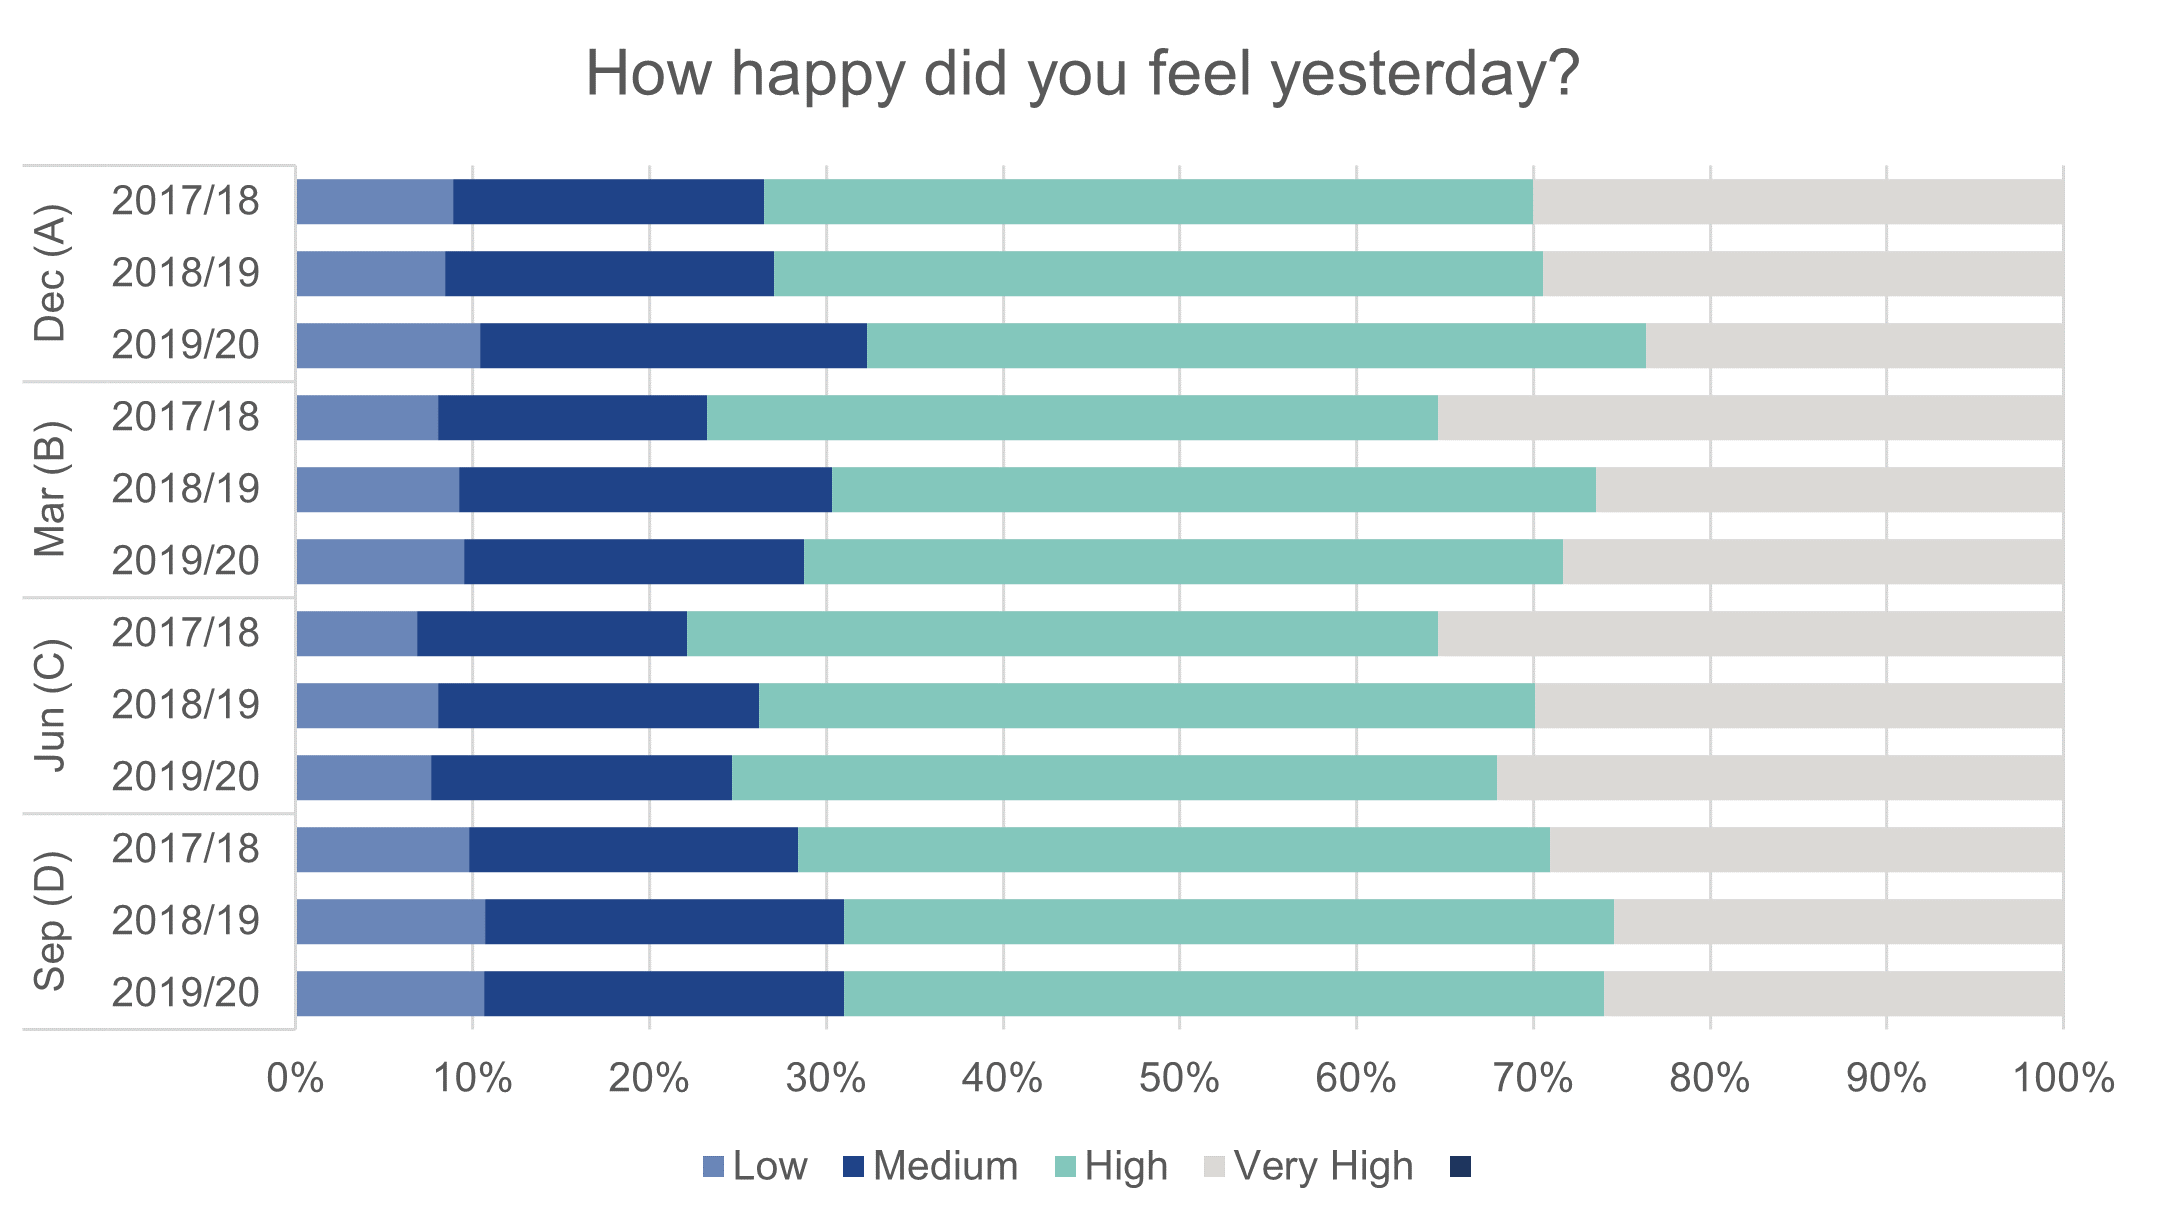
Figure 15. Graduates' own assessment of their happiness, by year and survey cohort
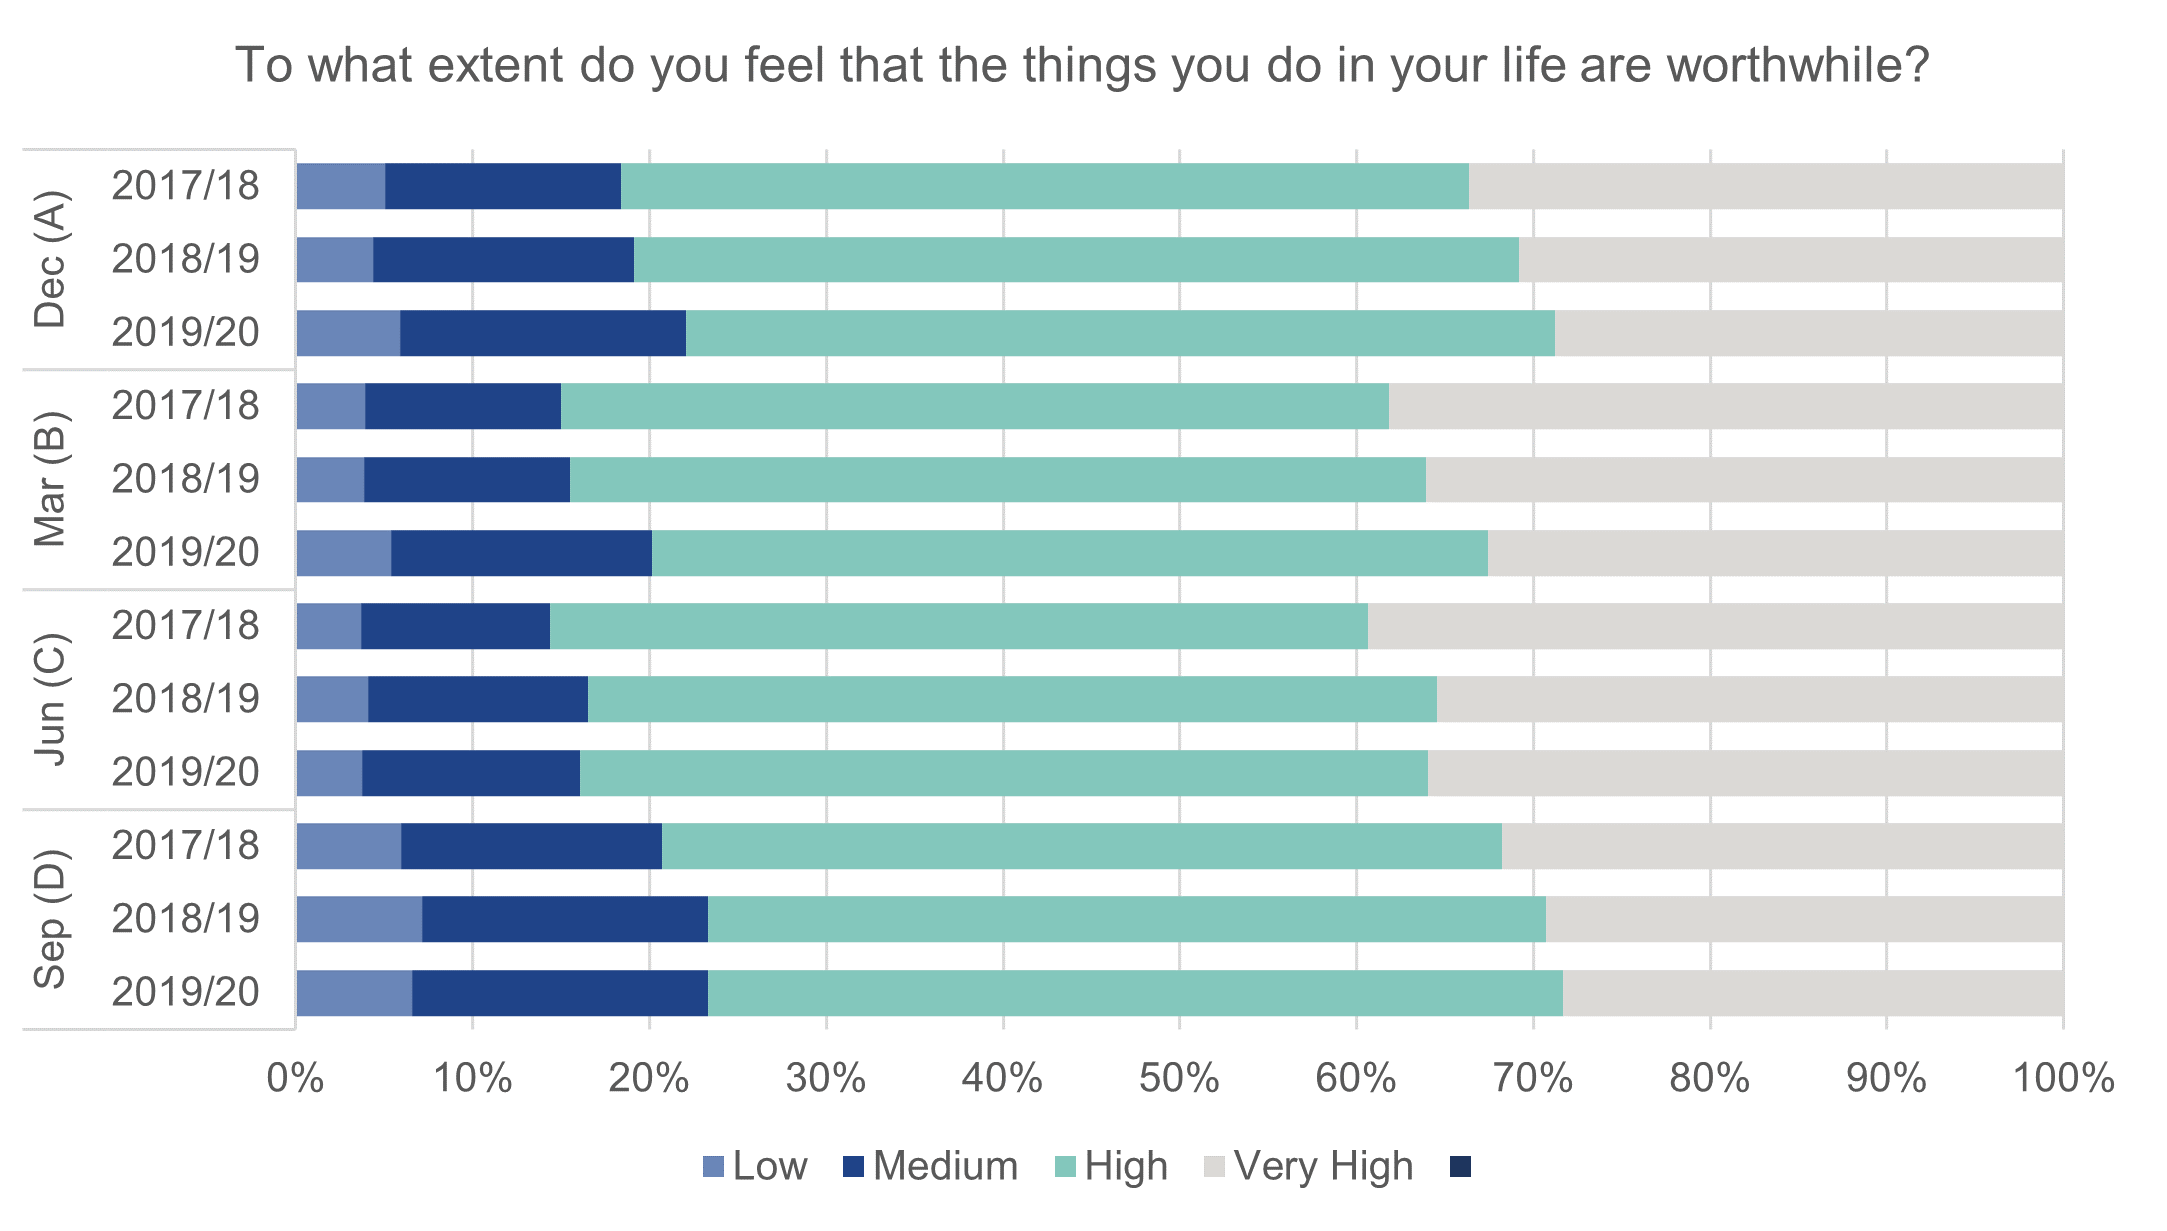
Figure 16. Graduates' own assessment of whether what they do is worthwhile, by year and survey cohort
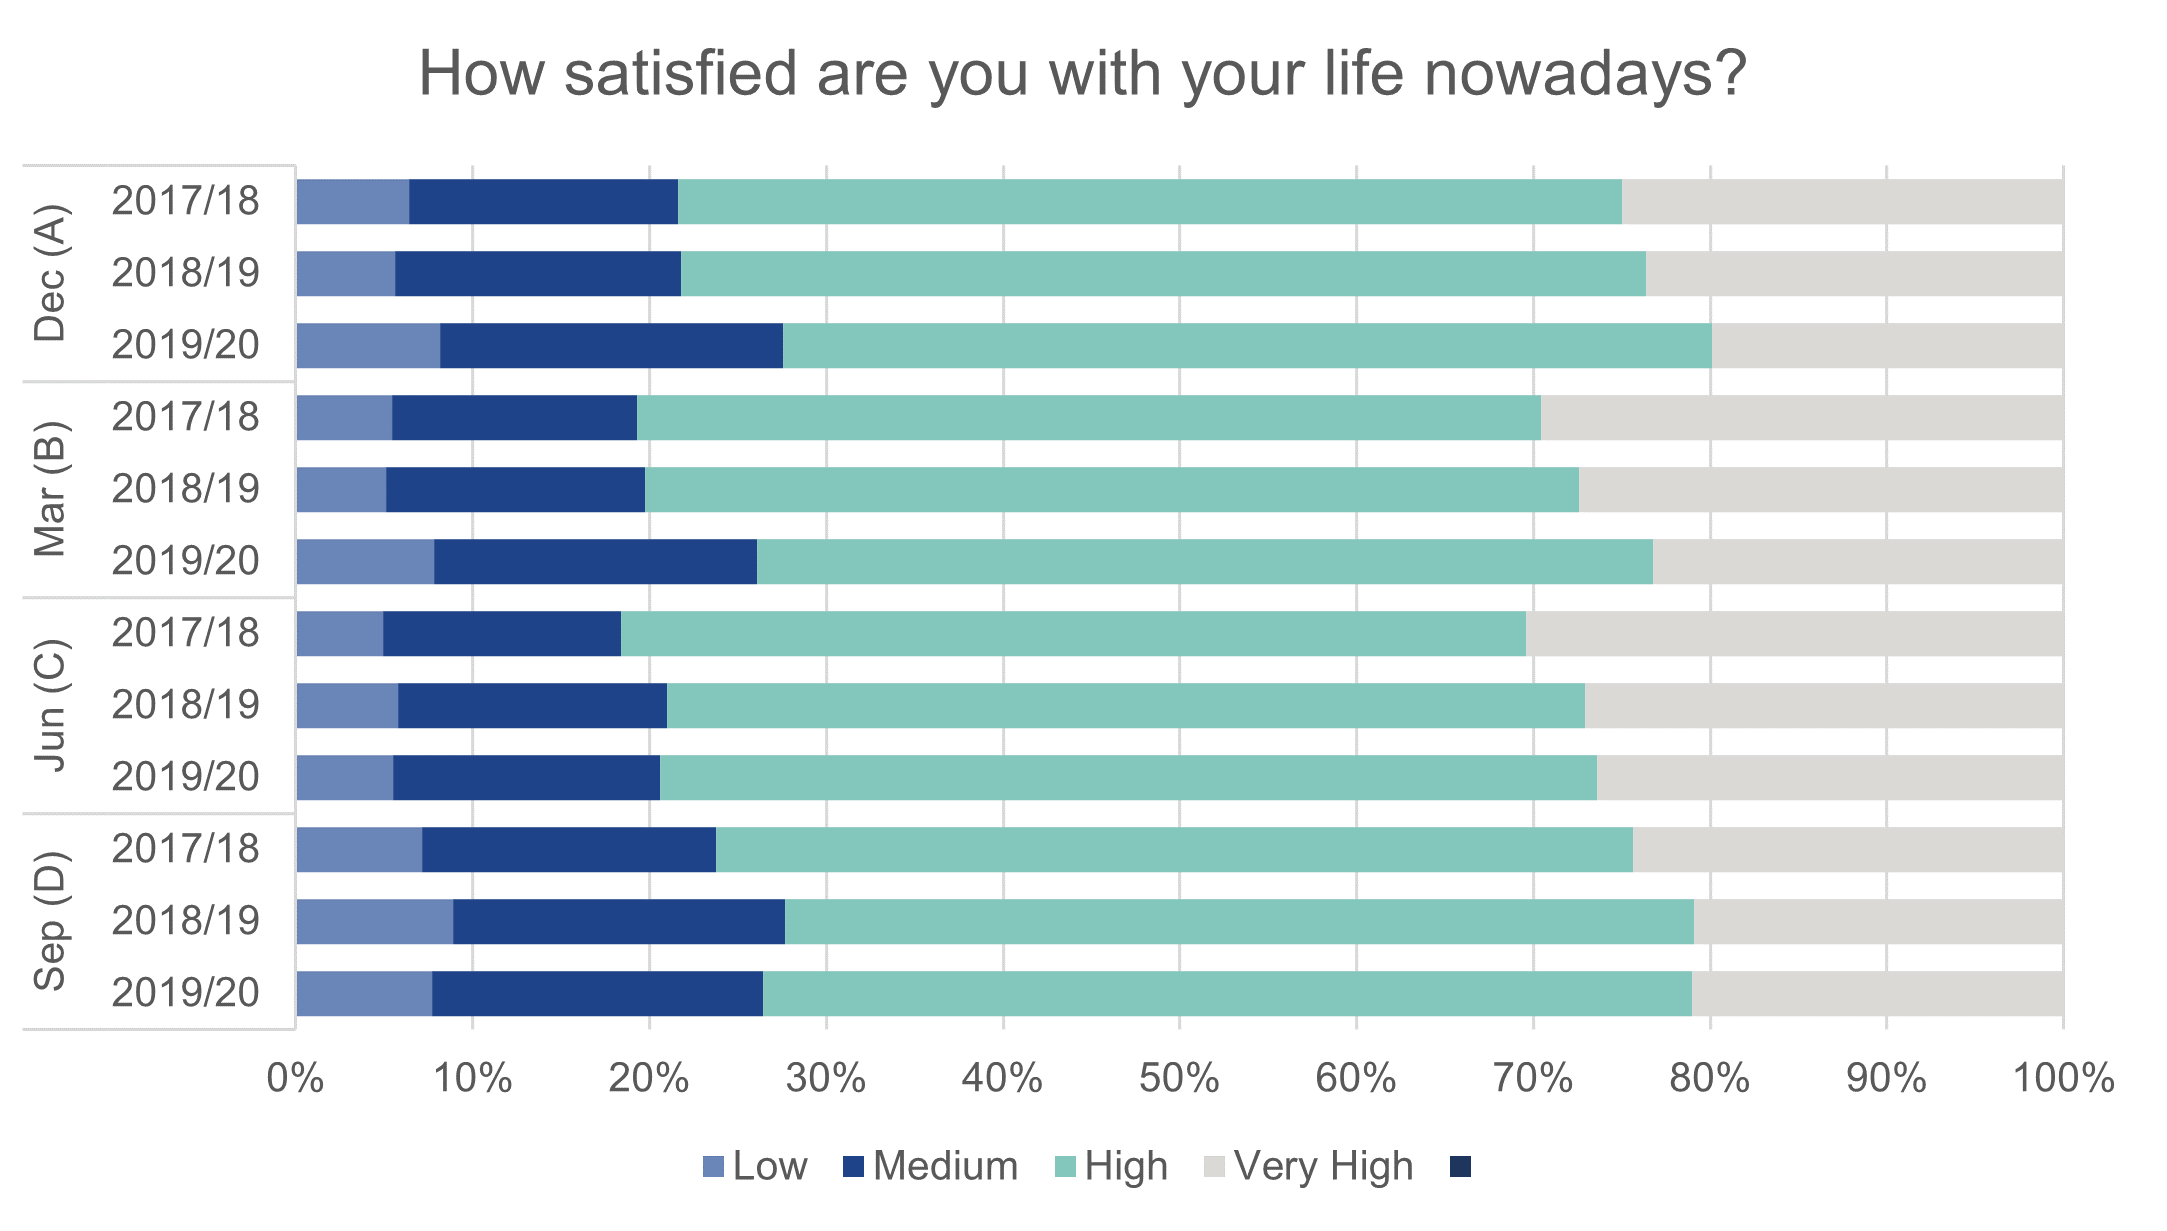
Figure 17. Graduates' own assessment of satisfaction with their lives, by year and survey cohort
Given the disparate effects of the pandemic in different economic sectors, this year we also wanted to see whether the sectors in which graduates were working seemed to have any impact on how they were feeling, both about their activities and more generally. We hypothesised that graduates working in potentially stressful key roles during the pandemic would report high levels of anxiety and generally poor subjective wellbeing. On the other hand, we hypothesised that these same graduates would respond positively to the graduate reflections questions, since both the pandemic context itself and the resulting public focus on frontline workers will have encouraged graduates working in fields such as healthcare and education to see their work as meaningful. We also hypothesised that graduates working in areas largely shut down over the pandemic, including hospitality and performing arts, would both report low levels of subjective wellbeing and respond negatively to the graduate reflections questions.
In terms of both the graduate reflections and subjective wellbeing questions, however, we saw very little year-on-year variation in the patterns of response for graduates working in different industries. We observed slight increases in the proportion of graduates working in some fields who agree with the graduate reflections questions, but these increases do not necessarily result in a net increase in positive responses. While graduates working in education and human health show an increase in the proportion who agree that their current activity is meaningful, graduates in these industries show a corresponding decrease in the proportion who strongly agree with the statement. At the same time, while we see an increase in graduates working in human health who agree that their work fits with their future plans, we see a similar increase in the proportion of graduates in the same industry who strongly disagree with that statement. In other words, while there have been some changes in graduates’ assessment of their own circumstances over the past two years, these changes do not necessarily reflect the impact of the pandemic on particular industries.
Conclusions
Last year, as we investigated the potential impacts of the COVID-19 pandemic on our second year of Graduate Outcomes data, we were looking to make sense of a seismic global event on a very new social survey. Like much of the rest of the world, HESA had switched to fully remote working in a hurry, and, while we still believed in the need for Graduate Outcomes data, we were only too aware of the disruption that the pandemic could cause, and we did not know how graduates were likely to respond when surveyed in turbulent times. We were relieved to find that response rates in the second year remained robust, and that, while we saw some year-on-year changes in activity and subjective wellbeing, those changes were not as drastic as we might have feared. At the same time, we remained somewhat cautious, aware that the pandemic was ongoing, and that the 2019/20 data might show further – and possibly different – kinds of disruption to graduate trajectories.
This year, we revisited the question of pandemic impacts under slightly different circumstances. While we were still interested in response rates and their implications for data quality, we also had new questions about the effect of the pandemic on a more recent cohort of graduates, who had finished their studies with the pandemic already underway. At the same time, we had a clearer sense of the wider effects of the pandemic in society, which helped us to shape our research questions; this year, instead of looking at graduates only in aggregate, we were able to delve more deeply into the experiences of graduates with different personal characteristics or working in different industries. There are some areas not covered by our investigation – we were not in a position to look at potential impacts on graduates from different parts of the UK or different socioeconomic backgrounds, nor did we look at the intersection of different types of disadvantage – but we hope nevertheless to have offered an overview of the impact of COVID-19 on the third year of Graduate Outcomes.
We expected to see more noticeable effects of the pandemic in the 2019/20 data than we saw in the previous year, now that we were looking at a full year of graduates surveyed during the pandemic, some of whom graduated into the first national lockdown. On the whole, however, that was not the case. Response rates across the board have remained steady or increased, and the minor variations in response rate which we see between different groups of graduates do not seem to correlate with particularly severe effects of the pandemic. While we expected to find that graduating into the pandemic would have an adverse effect on outcomes 15 months later, we saw, in fact, that employment rates for 2019/20 graduates were slightly higher than those of 2018/19 graduates. We saw a slight decline in highly positive answers to the graduate reflections and subjective wellbeing questions, suggesting that graduates’ subjective sense of recovery has lagged behind improvements in the labour market. Nevertheless, the changes which we saw in 2019/20 were smaller than the changes which we saw in 2018/19, and they do not seem to be driven by graduates working in any particular industry.
The 2019/20 Graduate Outcomes data, then, paints a picture of a graduate experience which has been changed by COVID-19, but neither beyond recognition nor as drastically as we might have expected in the first months of the pandemic. As we continue to collect Graduate Outcomes data in the coming years, we will continue to see graduates whose education and subsequent experiences in the labour market have been shaped by the pandemic in different ways. For now, the 2019/20 data, which continues to be representative of our target population, shows a cohort of graduates who are, despite the challenges of the past two years, working or studying at rates that are not far off those we saw in 2017/18, before the pandemic began. Through future assessment of our data, we hope to help our users not only to understand the ongoing effects of the pandemic, but also to understand what a normal year of Graduate Outcomes might look like.
[1] Further discussion of the potential impacts of the pandemic on social surveys can be found here: ONS. 2022. Impact of Covid-19 on social survey data collection. https://www.ons.gov.uk/peoplepopulationandcommunity/healthandsocialcare/conditionsanddiseases/methodologies/impactofcovid19ononssocialsurveydatacollection#discussion-of-the-impact-of-covid-19-on-ons-social-survey-data-collection
[2] Sorensen et al. 2022. ‘Variation in the COVID-19 infection-fatality ratio by age, time, and geography during the pre-vaccine era: a systematic analysis.’ The Lancet 399: 1469-1488. https://www.thelancet.com/journals/lancet/article/PIIS0140-6736(21)02867-1/fulltext#%20
[3] Flor et al. 2022. ‘Quantifying the effects of the COVID-19 pandemic on gender equality on health, social, and economic indicators: a comprehensive review of data from March, 2020, to September, 2021. The Lancet. https://www.thelancet.com/journals/lancet/article/PIIS0140-6736(22)00008-3/fulltext
See also: House of Commons Women and Equalities Committee. 2021. Unequal impact? Coronavirus and the gendered economic impact. https://committees.parliament.uk/publications/4597/documents/46478/default/; Institute for Fiscal Studies. 2021. The gendered division of paid and domestic work under lockdown. https://ifs.org.uk/uploads/WP2117-The-gendered-division-of-paid-and-domestic-work-under-lockdown.pdf
[4] ONS. 2022. Updating ethnic contrasts in deaths involving the coronavirus (COVID-19), England: 8 December 2020 to 1 December 2021. https://www.ons.gov.uk/peoplepopulationandcommunity/birthsdeathsandmarriages/deaths/articles/updatingethniccontrastsindeathsinvolvingthecoronaviruscovid19englandandwales/8december2020to1december2021; ONS. 2022. Coronavirus (COVID-19) latest insights: Vaccines. https://www.ons.gov.uk/peoplepopulationandcommunity/healthandsocialcare/conditionsanddiseases/articles/coronaviruscovid19latestinsights/vaccines
[5] ONS. 2022. Updating ethnic contrasts in deaths involving the coronavirus (COVID-19), England: 8 December 2020 to 1 December 2021. https://www.ons.gov.uk/peoplepopulationandcommunity/birthsdeathsandmarriages/deaths/articles/updatingethniccontrastsindeathsinvolvingthecoronaviruscovid19englandandwales/8december2020to1december2021
[6] House of Lords Library. 2021. Covid-19 pandemic: impact on people with disabilities. https://lordslibrary.parliament.uk/covid-19-pandemic-impact-on-people-with-disabilities/ ; see also Shakespeare et al. 2021. ‘Triple jeopardy: disabled people and the COVID-19 pandemic’. The Lancet 397: 1331-1333. https://www.thelancet.com/journals/lancet/article/PIIS0140-6736(21)00625-5/fulltext
[7] Altonji et al. 2016. ‘Cashier or consultant? Entry Labor Market Conditions, Field of Study, and Career Success.’ Journal of Labor Economics 34(S1): S361-S401.
On the specific conditions of the graduate labour market in spring 2020, see Greaves. 2020. Graduating into a pandemic: the impact on finalists. https://luminate.prospects.ac.uk/graduating-into-a-pandemic-the-impact-on-university-finalists
[8] ONS. 2021. Employment in the UK: December 2021. https://www.ons.gov.uk/employmentandlabourmarket/peopleinwork/employmentandemployeetypes/bulletins/employmentintheuk/december2021
[9] ONS. 2022. The employment of disabled people 2021. https://www.gov.uk/government/statistics/the-employment-of-disabled-people-2021/the-employment-of-disabled-people-2021
[10] ONS. 2020. Which jobs can be done from home? https://www.ons.gov.uk/employmentandlabourmarket/peopleinwork/employment...
[11] House of Commons Library. 2022. Coronavirus: Impact on the labour market. https://researchbriefings.files.parliament.uk/documents/CBP-8898/CBP-8898.pdf
[12] House of Commons Library 2022. Insight: How has the pandemic affected industries and labor in the UK? https://commonslibrary.parliament.uk/how-has-the-pandemic-affected-industries-and-labour-in-the-uk/
[13] ONS. 2020. Coronavirus and homeworking in the UK: April 2020. https://www.ons.gov.uk/employmentandlabourmarket/peopleinwork/employment...
[14] Martin and Okolo. 2022. ‘Modelling the Differing Impacts of Covid-19 in the UK Labour Market'. Oxford Bulletin of Economics and Statistics. https://onlinelibrary.wiley.com/doi/epdf/10.1111/obes.12497
[15] ONS. 2021. Graduates’ labour market outcomes during the coronavirus (COVID-19) pandemic: occupational switches and skill mismatch. https://www.ons.gov.uk/employmentandlabourmarket/peopleinwork/employment...
[16] For further information about recent changes in subject coding see: https://www.hesa.ac.uk/news/25-01-2022/sb262-higher-education-student-st...
[17] Howe et al. 2021. ‘Paradigm shifts caused by the COVID-19 pandemic’. Organizational Dynamics 50. https://www.ncbi.nlm.nih.gov/pmc/articles/PMC7648497/
[18] ONS. 2022. Coronavirus and the social impacts on Great Britain: 1 April 2022. https://www.ons.gov.uk/peoplepopulationandcommunity/healthandsocialcare/healthandwellbeing/bulletins/coronavirusandthesocialimpactsongreatbritain/1april2022

Lucy Van Essen-Fishman
