Graduate wellbeing: How does the design and nature of work relate to life evaluations and present emotions?
In this insight, HESA researchers explore whether there are any differences in how a particular aspect of employment quality is associated with various measures of wellbeing.
Summary and key findings
- Improving wellbeing and raising the quality of employment available to citizens are policy objectives across all nations of the UK.
- The Graduate Outcomes survey asks respondents to indicate the extent to which they believe their work;
- Is meaningful
- Uses the skills they learned in education
- Fits with their future plans
- HESA has used these three ‘graduate voice’ questions to develop a single composite measure that relates to one dimension of employment quality – the design and nature of work.
- We find a positive linear relationship exists between the design/nature of work and three measures of wellbeing (happiness, life satisfaction and how worthwhile individuals view their lives to be).
- A stronger correlation is found between the design/nature of work and life evaluations (i.e. life satisfaction and how worthwhile it is) compared with present emotions (i.e. happiness).
Introduction
In his 2010 paper relating to the output of the Stiglitz Commission, Andrew Oswald noted that ‘work is central to our emotional prosperity’ – a term that aims to encapsulate several measures of wellbeing, such as life satisfaction and happiness.[1] Much of the research conducted around or before this time on work and wellbeing had focused on aspects such as its relation to periods of unemployment or income. However, within recent years, attention has increasingly shifted towards examining the role of job quality or ‘good work’ on our wellbeing.
The purpose of this insight is to explore how a particular dimension of employment quality (the design and nature of work) correlates with graduate wellbeing.[2] The design and nature of work is a composite measure formed from responses to questions on whether graduates believe their job is meaningful and uses skills they learned during study, alongside the extent to which it aligns with their future plans. Developing and exploring such composite variables was recommended in both the Stiglitz report on the measurement of economic and social progress[3], as well as the Measuring Job Quality Working Group paper - assembled following the Taylor Review of Modern Working Practices.[4]
In particular (and in contrast to existing literature in this area), we consider how the relationship between wellbeing and this element of ‘good work’ varies based on whether we are assessing present emotions (happiness) or life evaluations (life satisfaction and the extent to which it is worthwhile).
The relationship between the design and nature of work and wellbeing – what do we expect to see?
In our previous study on wellbeing[5], we noted a US paper that highlighted how present emotions are more likely to be influenced by short-term conditions, while life evaluations will be more dependent on overall economic and social circumstances.[6] With much of our lives spent in work, one would therefore anticipate that employment quality has a greater link with life satisfaction and the degree to which we believe it is worthwhile. Consequently, our predictions for what we will see in the Graduate Outcomes data are as follows:
Hypothesis: Firstly, in line with previous research, it is anticipated that a better quality job will be positively associated with wellbeing, irrespective of the exact measure we consider.[7]
However, we would expect a stronger relationship to emerge between the design/nature of work and life evaluations, with a weaker correlation between this aspect of employment quality and happiness.
The design and nature of work measure that we have devised is assumed to be a continuous variable that takes a value between 1 and 5. The three wellbeing measures we consider all range from 0 to 10. For both variables, a higher score is representative of either better quality employment or greater wellbeing.
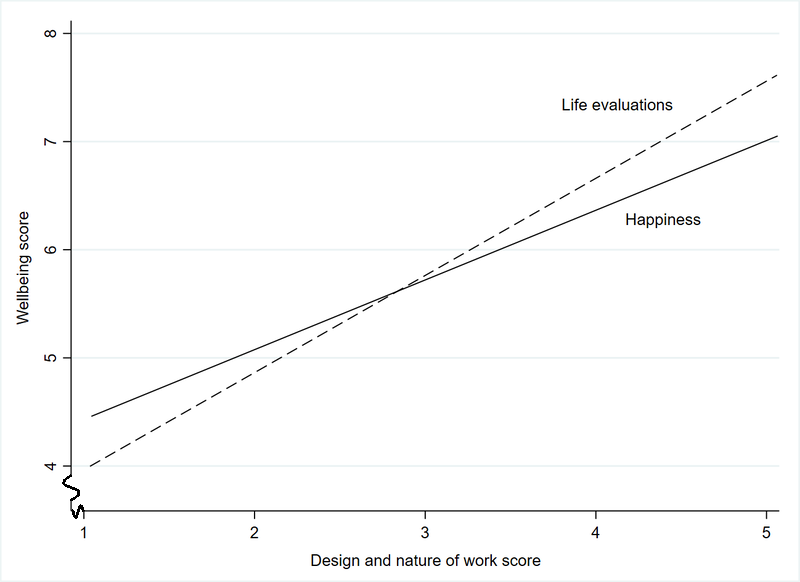
Plotting the findings on a graph, we would expect a steeper upward slope to arise for the results relating to life satisfaction/how worthwhile life is, relative to the findings on happiness. An illustration of what is predicted is supplied in Figure 1 below:
Figure 1: A graphical representation of the expected relationship between the design and nature of work score and different measures of wellbeing

To empirically test this, we draw upon a Graduate Outcomes sample consisting of UK domiciled graduates who completed a higher education course in either 2017/18 or 2018/19 and whose most important activity was full-time paid work for an employer. We restrict our dataset to those who answered the three questions on life satisfaction, happiness and whether they believe their life is worthwhile. Respondents must also have provided valid responses to the section utilised to form the design and nature of work measure. As earnings are used as one of the factors we control for when assessing the correlation, graduates will need to have supplied this information to us to form part of our dataset.[8] The final sample for analysis is comprised of 217,305 graduates.[9]
Findings – what relationship do we observe between the design/nature of work and wellbeing in Graduate Outcomes data?
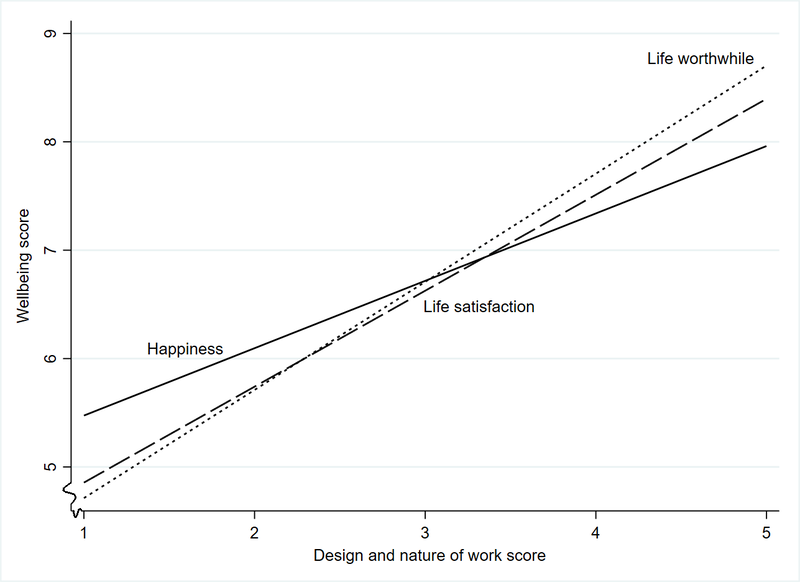
Figure 2 shows that the results that emerge from examination of the Graduate Outcomes sample match our theoretical predictions, with the incline of the life evaluation measures being steeper than that observed for happiness. The slope of the ‘life worthwhile’ and ‘life satisfaction’ lines are 0.998 and 0.885, respectively, while the corresponding figure for the ‘happiness’ line is 0.622. That is, on average, a unit increase in the design and nature of work score provided by a graduate raises their reported happiness by a value of 0.622. For instance, based on the figure beneath, we observe that a graduate who has their design and nature of work score increase from 3 to 4 would see their happiness score rise from 6.72 to 7.34.
Figure 2: The relationship between the design and nature of work score and various measures of wellbeing in the Graduate Outcomes survey

Given we are looking at the correlation between two variables, one may query how sensitive our results are to accounting for other potential determinants of employment quality and wellbeing. For example, previous research has noted that job security can influence worker perceptions of how meaningful their work is and may also impact an individual’s wellbeing.[10]
We therefore jointly controlled for the following factors (split into four distinct categories) to assess if/how our findings changed.[11] These related to:
- The survey process (day, mode and quarter of year the survey was completed)
- Employment characteristics (gross earnings, firm size, Standard Industrial Classification, Standard Occupational Classification, whether the graduate had moved for work, mode/basis of employment)
- Study characteristics (subject of study, provider, mode, level/class of study, academic year of entry, whether a significant period of study was undertaken between graduation and completing the survey)
- Demographic characteristics (age, sex, ethnicity, prior attainment, disability, socioeconomic background)
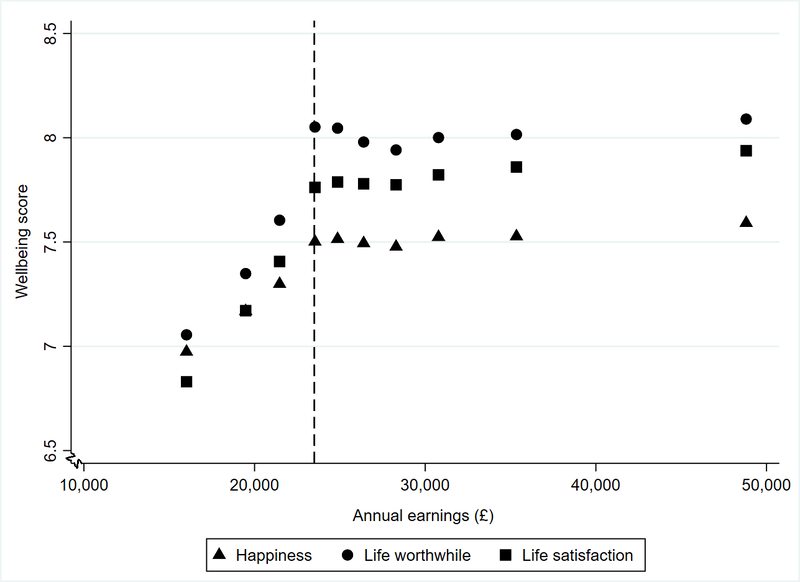
When we investigated how some of the above controls related to wellbeing, one notable result worth highlighting was the relationship between graduate earnings and wellbeing (not taking into account any other factors). Regardless of the measure analysed, higher earnings did not seem to particularly relate to wellbeing after a certain threshold (around £23,500 per year as illustrated in the figure below), though we are unable to ascertain from this study why we may be observing this pattern.
Figure 3: The relationship between graduate earnings and various measures of wellbeing in the Graduate Outcomes survey

Even after accounting for all of the above factors, we found that there was little change in the observed relationship between the design/nature of work and wellbeing. A unit increase in the design/nature of work score now increased reported happiness by a value of 0.661 (the estimate was 0.622 before we controlled for other variables). The figures for life satisfaction and the extent to which life is worthwhile were 0.860 and 0.930 (prior to accounting for other factors, the values were 0.885 and 0.998).
Concluding remarks
As we noted in our last insight, increasing wellbeing is a policy objective across all nations of the UK. Here, we see that employment quality has a positive correlation with graduate wellbeing, though our analysis does not claim to be causal (i.e. that better employment quality causes higher wellbeing). Indeed, it could be that those with greater levels of wellbeing are more likely to find work that is meaningful or that fits in with their career aspirations. Furthermore, there may be other unobservable factors that we were unable to account for in this study (e.g. health, personal relationships, personality traits etc).[12]
That does not mean to say that insights such as this cannot help to advance our knowledge in this field and therefore should be dismissed. Indeed, much of our understanding about the factors associated with wellbeing to date are based on observational studies such as the Graduate Outcomes survey. Furthermore, as Oswald and Blanchflower note in their paper on international happiness ‘the discovery of a correlation is typically one necessary part of a proof of causation’.[13]
[3] https://ec.europa.eu/eurostat/documents/8131721/8131772/Stiglitz-Sen-Fitoussi-Commission-report.pdf
[4] https://d1ssu070pg2v9i.cloudfront.net/pex/pex_carnegie2021/2018/09/06105222/Measuring-Good-Work-FINAL-03-09-18.pdf
[5] See https://www.hesa.ac.uk/insight/21-09-2022/ready-for-the-weekend-graduates-wellbeing. The four subjective wellbeing questions that form of the Graduate Outcomes survey are also set out in this insight.
[8] We trimmed unrealistic/extreme values in our annual earnings variable prior to utilising this as part of our analysis. This is a typical procedure implemented by researchers working with wage data and is employed as these observations are more likely to have been reported in error. See, for example, https://ifs.org.uk/sites/default/files/output_url_files/wp201603.pdf and https://www.ons.gov.uk/employmentandlabourmarket/peopleinwork/earningsandworkinghours/articles/ethnicitypaygapsingreatbritain/2019 who apply a similar treatment to the earnings data they work with. In each of the two years of Graduate Outcomes data that we use, those who report yearly salaries that fall below the minimum wage threshold were firstly excluded, followed by the top 1% of earners. For the second year of data, the minimum wage was determined taking into account that graduates could potentially be earning 80% of their usual salary, as a result of being placed on furlough.
[9] As with previous insights, we focus on those providers that agreed for data they had submitted to be used for purposes in category 1 – see https://www.hesa.ac.uk/support/provider-info/subscription/onward-use for further details.
[11] This was done by running an ordinary least squares (OLS) regression. For further detail on why this is a relevant approach here, please refer to this Office for National Statistics (2015) piece on wellbeing - https://backup.ons.gov.uk/wp-content/uploads/sites/3/2015/09/Relationship-between-Wealth-Income-and-Personal-Well-being-July-2011-to-June-2012.pdf.
[12] For further discussion around these issues, see for example, https://blogs.lse.ac.uk/businessreview/2018/08/13/is-happiness-a-consequence-or-cause-of-career-success/. Also, the R-squared values for our three regressions, inclusive of a full set of controls, are 0.115 (happiness), 0.266 (life satisfaction) and 0.308 (life worthwhile). This value illustrates how much of the variation in our dependent variable (a measure of wellbeing) can be explained by our regression model. It ranges from 0 to 1, where a larger value indicates a better fit. The figures we observe suggest that there are likely to be a number of other factors that relate to our wellbeing, with the Office for National Statistics (2015) piece that we noted earlier highlighting the role of personality and genetics.
Related content
- Ready for the weekend? How data relating to the Graduate Outcomes survey process can be used in assessing the validity of subjective wellbeing information
- Graduate Outcomes : A statistical measure of the design and nature of work

Tej Nathwani

Siobhan Donnelly
