The impact of the Covid-19 pandemic on Graduate Outcomes 2018/19
This year's Graduate Outcomes data reflects the circumstances under which it was collected. Data was collected in a year in which unemployment rates rose across society and most travel was prohibited. This insight brief is part of our range of support to help users contextualise 2018/19 Graduate Outcomes data.
Introduction and project description
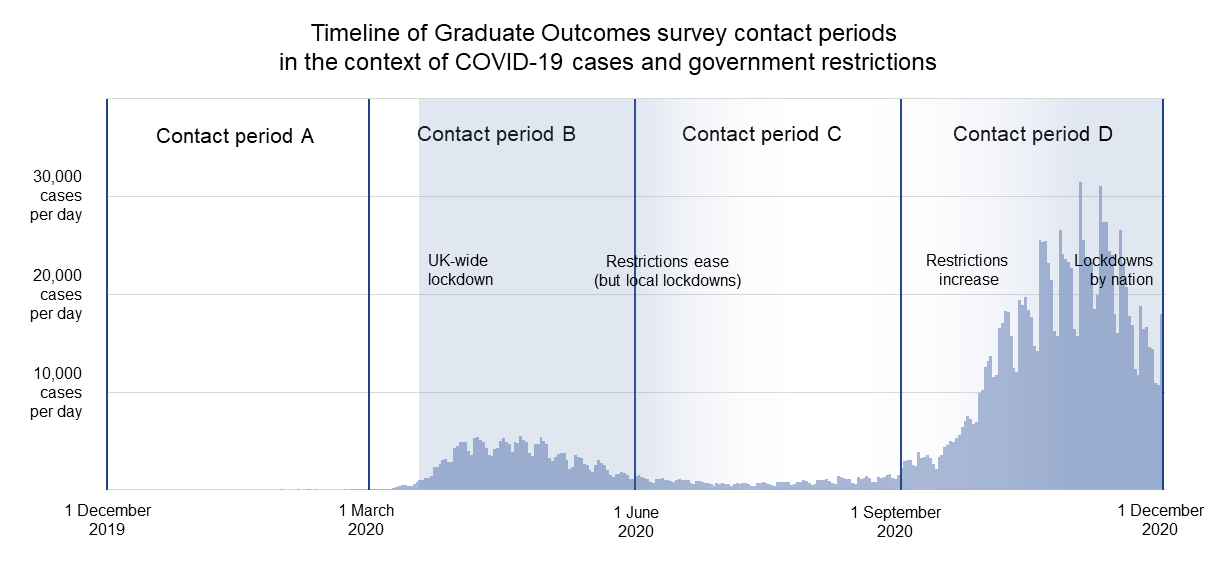
Surveying for the 2018/19 Graduate Outcomes survey, covering graduates who finished their higher education courses between August 2018 and July 2019, began in December 2019. On 11 March 2020, only ten days after the opening of the second survey cohort, the World Health Organization declared the outbreak of Covid-19 a pandemic. The first national lockdown was announced on 23 March 2020, and restrictions of one sort or another remained in force across the UK throughout the rest of the 2018/19 survey year (Figure 1). While the graduates surveyed for the 2018/19 survey were not the students who graduated into the pandemic, the Covid-19 pandemic will, for many graduates, have set the scene for an important early stage of their careers.
Figure 1. Timeline of Graduate Outcomes survey contact periods in the context of Covid-19 cases and government restrictions
The effects of the Covid-19 pandemic extended across society, in the UK and around the globe. Pandemic restrictions affected all aspects of daily life; supply chains were disrupted, schools were shut—with implications for childcare in households with children—and many who could not continue to work from home lost jobs or were put on furlough. While the pandemic affected all of society, however, its effects were not equally distributed; the health effects of the pandemic were more pronounced for some demographic groups, while the economic effects were more pronounced for others.
From the start of the first national lockdown, as HESA and its survey partners shifted to remote working, it was clear that we would need to consider the effects of the pandemic on the 2018/19 Graduate Outcomes data. It seemed likely that the 2018/19 Graduate Outcomes data would prove to be a valuable record of an unusual year, and, since our survey methodology does not include face-to-face interviews, we were able to continue surveying as normal throughout the pandemic. We were aware, however, that it would be necessary to assess the quality of the data in light of the exceptional circumstances under which it was collected.
When we received the 2018/19 Graduate Outcomes data, a group of analysts from across HESA embarked on a six-week programme of analysis, with three main goals: first, to identify any effects of the pandemic on the quality of the data; second, to identify any effects of the pandemic in the responses we received from graduates; and, third, to determine the best approach to the handling of the pandemic in our 2018/19 Graduate Outcomes publications. The results of our investigation will be discussed in detail in subsequent sections of this insight brief, but, overall, we found that the quality of the 2018/19 data remained comparable to or higher than the quality of the first year’s data, and we recommended that publication could continue as normal, with the addition of some contextual material to help users understand the impacts of the pandemic.
Data quality: response rates
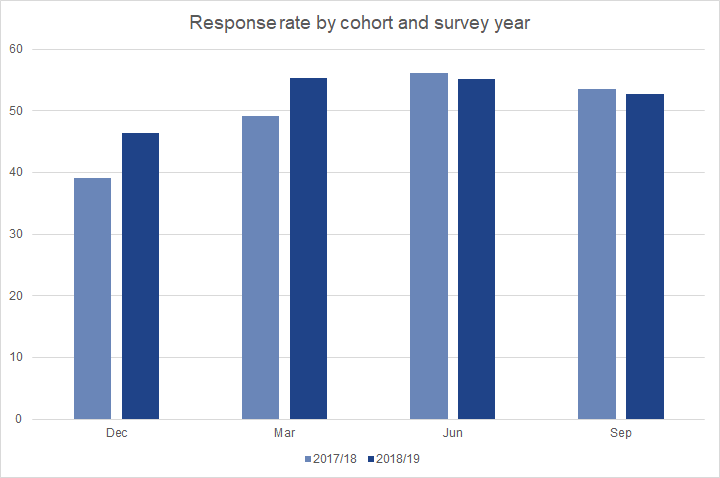
In the first instance, our data quality investigations focused on response rates. As the magnitude of the effects of the pandemic on daily life became increasingly clear, there was some concern that Graduate Outcomes response rates might be affected: would graduates who had lost their jobs due to the pandemic want to respond to the Graduate Outcomes survey? Would those who were under new pressures at work or at home have time to respond? Alternatively, might the disruption of other activities leave graduates with extra time in which to complete the survey? With these questions in mind, we compared 2018/19 response rates to those from 2017/18, by year and by cohort. Overall, response rates for the second year of surveying were higher than response rates for the first, with response rates in the first two 2018/19 cohorts increasing by 7.4 and 6.1 percentage points, respectively, when compared with the equivalent 2017/18 cohorts, and response rates in the latter two 2018/19 cohorts decreasing by about 0.8 percentage points when compared with their 2017/18 equivalents (Figure 2).
Figure 2. Response rates by cohort and survey year
In addition to looking at overall response rates, we also looked at response rates for graduates with a range of different characteristics. Since different demographic groups in society as a whole experienced the pandemic differently in terms of their economic and health outcomes, it seemed reasonable to wonder whether different groups of graduates would be differently able or inclined to respond to the Graduate Outcomes survey under exceptional circumstances.
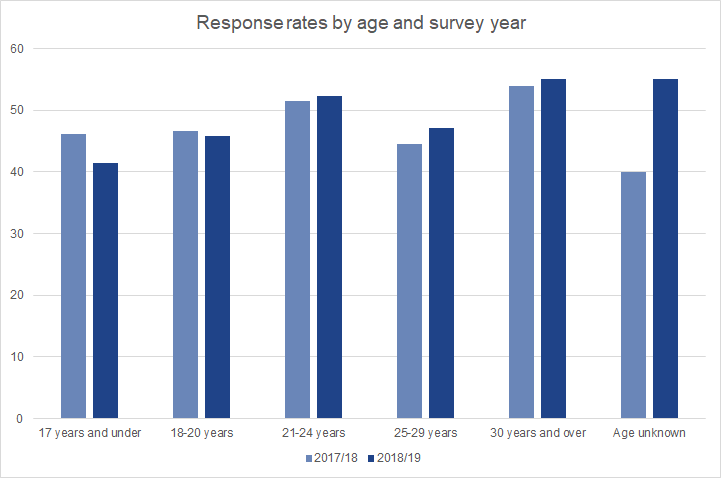
The most obvious differential in the health effects of the pandemic is by age, with more than 90% of deaths from Covid-19 occurring in people aged 60 or above.[1] At the same time, the employment impacts of the pandemic have been concentrated among young people, with 70% of job losses between March 2020 and May 2021 taking place among workers under the age of 25.[2] When we look at Graduate Outcomes response rates by age, however, we find that most age groups were more likely to respond to the 2018/19 survey than to the 2017/18 survey (Figure 3). While we do see decreased response rates in the two youngest age brackets, those two brackets together make up less than 5% of the 2018/19 target population.
Figure 3. Response rates by age and survey year
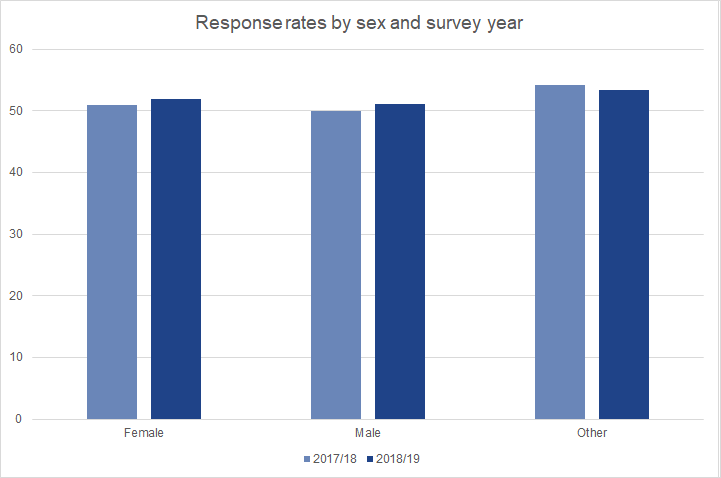
Some of the impacts of the pandemic varied by sex, too, with women more likely than men to be working in sectors which were shut down by pandemic regulations.[3] In families with children with opposite-gender parents, moreover, mothers lost more hours of paid work than fathers, while their hours of childcare and household work increased.[4] Both male and female graduates, however, were more likely to respond to the 2018/19 survey than to the 2017/18 survey (Figure 4). Although the total number of responses from graduates whose sex was ‘other’ increased from 2017/18 to 2018/19, graduates in this category, who represent less than 0.2% of the target population, were less likely to respond in 2018/19 than in 2017/18.
Figure 4. Response rates by sex and survey year
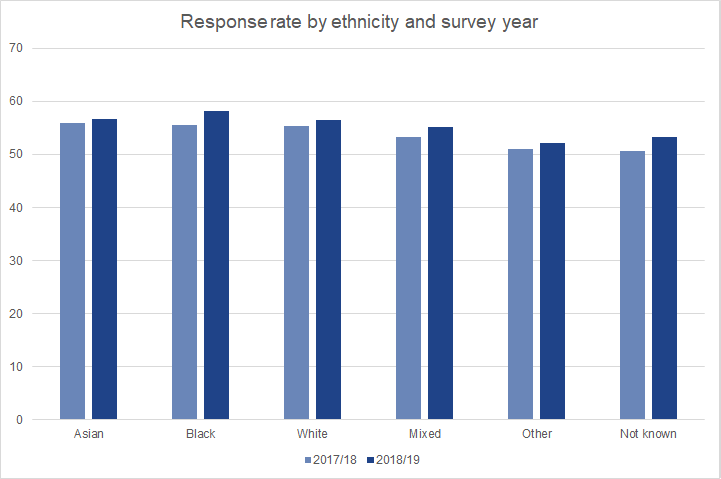
Both the health and economic impacts of the pandemic were unequally distributed across ethnic groups. Not only are Covid-19 mortality rates for people from Black and South Asian ethnic groups higher than those for people of White ethnicity, but households from some ethnic groups, particularly Black African and Black Caribbean households, were less likely than others to have the financial reserves that would allow them to withstand a temporary drop in employment income.[5] These differences in health and economic impacts, however, do not seem to have translated into notable differences in Graduate Outcomes response rates (Figure 5). Although we saw slight decreases in response rates for some graduates from specific Asian or Asian British ethnic backgrounds, these differences are small, and should be seen in the context of both a larger target population and increased numbers of responses from graduates in these categories to the 2018/19 survey.
Figure 5. Response rates by ethnicity and survey year
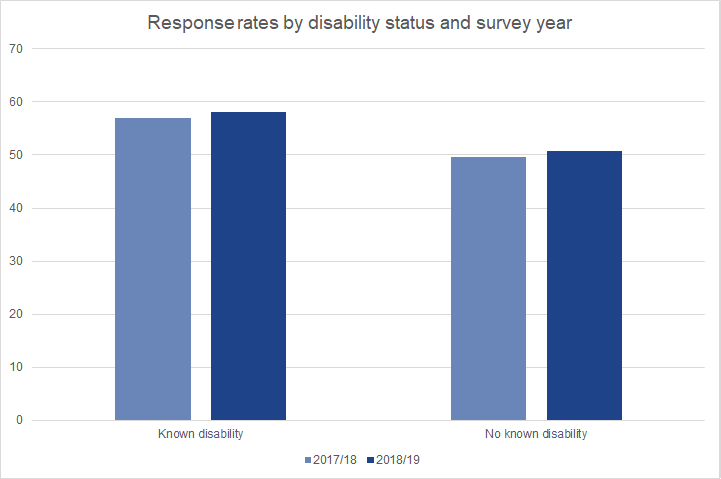
We also examined response rates for graduates with disabilities as compared to those with no known disability. Studies have shown that the effects of the pandemic on people with disabilities have been particularly marked, with many disabled people particularly vulnerable to the health effects of Covid-19. Disabled people have also been more likely than non-disabled people to have difficulty obtaining essentials and accessing healthcare for non-Covid needs, and they have also been more likely to report that their wellbeing has been adversely affected.[6] Both disabled graduates and those not known to be disabled were more likely to respond to the 2018/19 survey than to the 2017/18 survey, with disabled graduates in both years markedly more likely to respond to the survey than those with no known disability (Figure 6).
Figure 6. Response rates by disability status and survey year
In addition to the personal characteristics discussed so far, we also examined response rates by region of domicile (i.e., where graduates were living at the start of their degrees) and by the relevant indices of multiple deprivation for each UK home nation, on the grounds that the effects of the pandemic varied by region and across socioeconomic groups.[7] As was the case when we looked at age, sex, ethnicity and disability, however, we saw no notable differences in response rates compared to the 2017/18 survey by either region of domicile or multiple deprivation quintile. Across the board, 2018/19 response rates were typically stable or slightly elevated when compared to 2017/18 rates, with the variations in response rate by region and deprivation measure quintile which we saw in 2017/18 essentially replicated in the second year of the survey.
It also seemed possible that what graduates were doing would affect their ability or willingness to respond to the survey. In particular, certain key sectors have been under immense pressure throughout the pandemic, and there was some concern that more pressing obligations might keep graduates working in such sectors from responding. Since it is only from their responses that we know what graduates are doing, we cannot directly assess response rates for graduates involved in different activities. In some cases, however, subject of study can be a good indicator of subsequent employment sector, particularly for graduates who go on to work in critical sectors; in 2017/18, for instance, we found that 85% of graduates who had studied Medicine & Dentistry and 78% who had studied Subjects Allied to Medicine went on to work in human health and social work activities, while 82% of graduates who had studied Education went on to work in the education sector. We therefore also looked at response rates by subject of study, but we found no notable changes in response rates for graduates who had studied in different fields.
While graduates with different characteristics may have had different experiences of the pandemic during the 2018/19 Graduate Outcomes survey year, their different experiences do not seem to have made any groups particularly unlikely to respond. Across the majority of the demographic groups we examined, graduate response rates for 2018/19 were equal to or higher than response rates for 2017/18. Whatever graduates were doing and feeling during the survey year, they seem to have been increasingly willing to tell us about their experiences.
Data quality: mode effects and item non-response
Response rates are not the only area in which the pandemic may have had an impact on the quality of the 2018/19 Graduate Outcomes data. For those graduates who decided to respond to the survey, there is a possibility that the unsettled circumstances of the pandemic will have affected how comfortable they felt with answering certain potentially sensitive questions and how frank they were in their answers. It seemed possible, for example, that graduates who had lost jobs or been furloughed during the pandemic would feel less comfortable reporting their salaries than they would have otherwise; similarly, there was some concern that graduates who found themselves struggling during the pandemic might not be inclined to answer questions about their subjective wellbeing.
Graduates Outcomes is a mixed-mode survey, in which some graduates complete the survey online and others are interviewed over the telephone. The percentage of graduates completing the Graduate Outcomes survey via telephone increased in the second year of surveying, from approximately 56% for the 2017/18 survey to 61% for the 2018/19 survey. Research into different methods of survey administration has shown that how respondents complete a survey can have an effect their responses; in particular, respondents who are interviewed, either by telephone or face-to-face, display a tendency (known as social desirability bias) to provide the responses which they believe are most desirable, particularly to sensitive questions.[8]
Since the survey questions about subjective wellbeing and salary can both be considered to be sensitive, and it seems possible that their sensitivity will have increased over the course of the pandemic, we looked for any possible mode effects in the survey data for these questions. In both the pre-pandemic 2017/18 data and the 2018/19 data, we saw some evidence of social desirability bias in the responses to the subjective wellbeing questions, with graduates completing the survey via telephone tending to give higher scores for the positively worded questions (on happiness, life satisfaction, and the extent to which they feel their lives are worthwhile) and to give lower scores for the question about anxiety.
While the difference between online and telephone responses seems to have increased slightly in the 2018/19 data for the positively worded questions, the magnitude of the mode effect for the anxiety question seems to have decreased in the 2018/19 data, with graduates appearing slightly more likely to report higher anxiety scores via telephone than they were in the previous year. While it is difficult to be certain about the causes of this apparent reduction in mode effect, the pandemic may have played a role; as the unsettled circumstances of the pandemic brought discussion of mental health and wellbeing further into the mainstream, graduates may have grown more comfortable with the idea of reporting elevated levels of anxiety to a telephone interviewer.
When we consider the question on salary, mode of completion may influence how likely graduates are to report their salary at all. In both the 2017/18 data and the 2018/19 data, graduates are more likely not to respond to the salary question if they are completing the survey over the telephone rather than online. In the final cohort of the 2018/19 survey, the rate of response to the salary question increased slightly over the equivalent 2017/18 cohort, from 95.4% to 95.9%, for graduates completing the survey online. For graduates completing the survey over the telephone in the same cohort, however, the rate of response to the salary question fell, from 93.7% in 2017/18 to 90.6% in 2018/19. This decrease in the telephone response rate to the salary question is likely to be linked to the pandemic; in an uncertain employment market, the salary question may have felt particularly sensitive, and graduates will have felt less likely to supply telephone interviewers with information which felt highly personal.
Overall, we see similar mode effects in the two survey years when we look at responses to the salary and subjective wellbeing questions, with graduates more reticent about their salaries and more likely to paint a generally positive picture of their wellbeing over the telephone. The magnitude of these mode effects has varied between the two years, but the likely role of the pandemic in this variation has been inconsistent. While the pandemic seems to have led to an increased mode effect in the salary question, with graduates feeling increasingly unwilling to disclose sensitive earnings data, it seems to have led to a decreased mode effect in the anxiety question, as graduates have grown used to discussing mental health and wellbeing in a variety of different contexts.
Cohort effects in the data
The four 2018/19 survey cohorts were surveyed at very different stages of the pandemic, with cohort A surveyed before the pandemic had been declared, and with different levels of restrictions, depending on location, in place for most of the subsequent three cohorts (although the census week for cohort B narrowly preceded the introduction of restrictions). Given the different circumstances under which the four contact periods took place, it seemed possible that we would see different effects of the pandemic for different survey cohorts.
When we looked at graduate activity, subjective wellbeing, and responses to the graduate voice questions by cohort, however, we found surprisingly little difference between the trends we saw in 2017/18 and those we saw in 2018/19. The four survey cohorts are both qualitatively and quantitatively different, with graduates from different types of degree programme clustering in certain cohorts, and with approximately 70% of graduates surveyed in cohort D. These differences in the size and composition of the four survey cohorts mean that cohort-on-cohort differences were visible in the first year of Graduate Outcomes data and would be likely to be visible in any other non-pandemic year.
The cohort-level differences which are visible in the 2018/19 data roughly match the cohort-level differences which we saw in 2017/18. In terms of graduate activity, for example, the percentage of graduates in unemployment differed by 2.5 percentage points between the June and September cohorts for 2018/19, with 3.7% of graduates in the June cohort reporting themselves as unemployed, compared to 6.2% in September; over the same period in the previous year, we saw a 1.7 percentage point difference in graduates in unemployment, with 2.5% in June and 4.2% in September. While the percentage of graduates in unemployment in both 2018/19 cohorts is higher than in the equivalent 2017/18 cohorts, the general trend, of higher levels of reported unemployment in cohort D than in cohort C, remains consistent between years. The same is true for responses to the subjective wellbeing and graduate voice questions; while we see some year-on-year variation, the same patterns are visible between cohorts in the two survey years.
Overall, while there are differences visible in the responses of graduates from different 2018/19 survey cohorts, the fact that these differences echo differences which were visible in 2017/18 suggests that differences between cohorts cannot be securely attributed to the effects of the pandemic. Although we considered publishing more cohort-level data in our main outputs in light of the pandemic, in the end we decided that the differences between the four cohorts meant that the benefits of cohort-level publication would be outweighed by the interpretative difficulties that would result from such an approach.
Graduates before and during the pandemic
Once we were satisfied that our data remained robust despite the shifting circumstances under which it was collected and that the pandemic had not materially shifted the debate on whether to publish cohort-level data, we turned our investigations towards the possible effects of the pandemic on what graduates were doing and how they were feeling about it. Here we did see differences between the 2018/19 and 2017/18 datasets; for the most part, these differences aligned both with our initial hypotheses and with the results of studies collected elsewhere, although the magnitude of the differences which we saw was not always what we expected.
Although the changes in graduate activity from one cohort to the next in the 2018/19 dataset were for the most part both minor and in line with the patterns visible in the 2017/18 dataset, those changes add up to some notable differences in graduate activity both between 2018/19 and 2017/18 overall and between individual 2018/19 cohorts and their 2017/18 equivalents.
Figure 7. Graduate activities in 2017/18 and 2018/19: Cohort A (December)
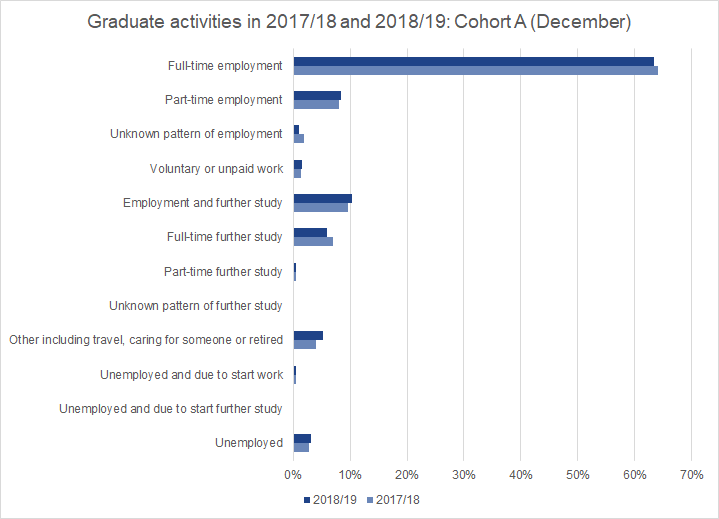
Figure 8. Graduate activities in 2017/18 and 2018/19: Cohort B (March)
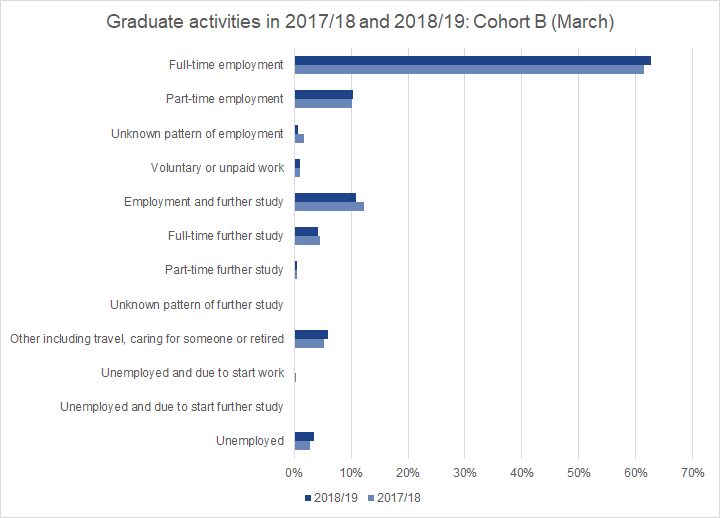
Figure 9. Graduate activities in 2017/18 and 2018/19: Cohort C (June)
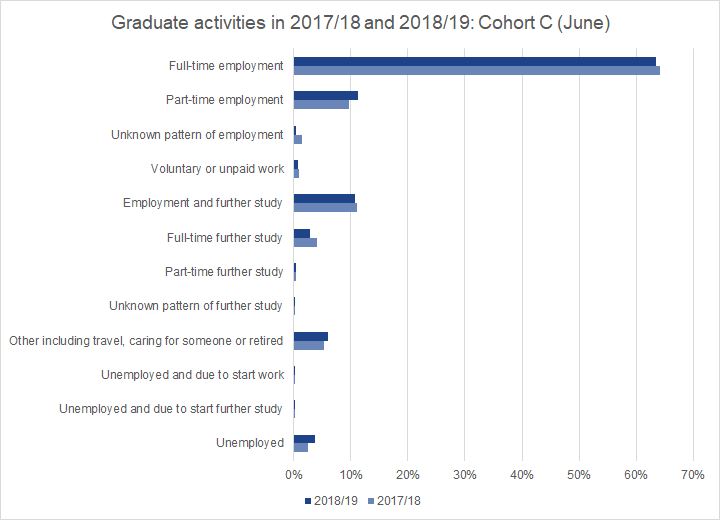
Figure 10. Graduate activities in 2017/18 and 2018/19: Cohort D (September)
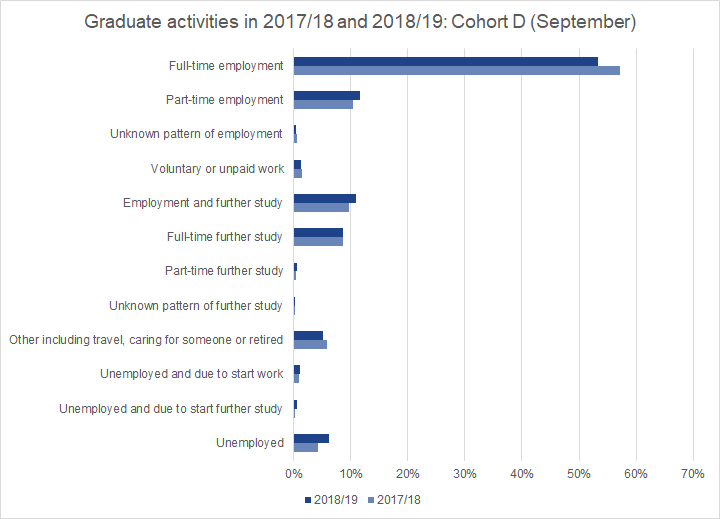
In all four 2018/19 cohorts, the percentage of graduates in reporting themselves as unemployed is higher than in the equivalent 2017/18 cohort, and the differences increase with each successive 2018/19 cohort (Figures 7 to 10). The overall rate of 2018/19 graduates recording themselves as unemployed is 6.7% (including those who are unemployed and due to start work or study), up 1.7 percentage points from 5% in the 2017/18 dataset.
This increase in reported graduate unemployment aligns with changes in unemployment observed by the Office for National Statistics (ONS) over a similar time period, although it is worth noting that the official definition of unemployment used by the ONS does not align perfectly with the self-reported data on unemployment as an activity in Graduate Outcomes.[9] As of the end of the third quarter of 2020, the ONS report an overall unemployment rate of 4.8% amongst those aged 16 and above (both graduates and non-graduates), up 0.9 percentage points from the same point in 2019. Amongst young people aged 16 to 24 (both graduates and non-graduates), the ONS report an unemployment rate of 15.9% at the end of the third quarter of 2020, up 2.7 percentage points from the same point in 2019.[10] Given the relative youth of the Graduate Outcomes target population (of whom 60% are 24 and under and 80% are under 30), the changes in unemployment which we see in the 2018/19 Graduate Outcomes data are in line with what we might expect; recent graduates seem to have been insulated from the worst of the pandemic-related job losses experienced by other young workers, but they have still felt the effects of the pandemic more strongly than those effects were felt by the working age population as a whole.
The 2018/19 dataset also showed an unsurprising 50% decrease in the proportion of graduates who said that they were taking time out to travel, from 1.4% of respondents to 0.7%. Approximately 1.3% of respondents said they were taking time out to travel in Cohort A, before the beginning of the pandemic, with numbers of graduates taking time out to travel falling sharply in subsequent cohorts. Given that, for much of the survey year, opportunities to travel were severely restricted by the pandemic, the decrease in graduates taking time out to travel suggests that our data is an accurate reflection of the circumstances under which it was collected.
Graduate Outcomes measures not just what graduates are doing, but also how they are feeling, both about their activities and about their general wellbeing. For much of the past year, many aspects of daily life have been thrown into confusion by the pandemic, which has in turn led to a heightened focus on issues of mental health and wellbeing. At the same time, many people’s relationships to work have changed, as they have shifted to remote working, been furloughed, or carried on working, possibly with a renewed sense of urgency, in critical sectors. With these changes in mind, we expected to see some corresponding changes in the responses to the subjective wellbeing and graduate voice questions.
Figure 11. Graduates' agreement with the statement "My current activity is meaningful" in 2017/18 and 2018/19 surveys by cohort
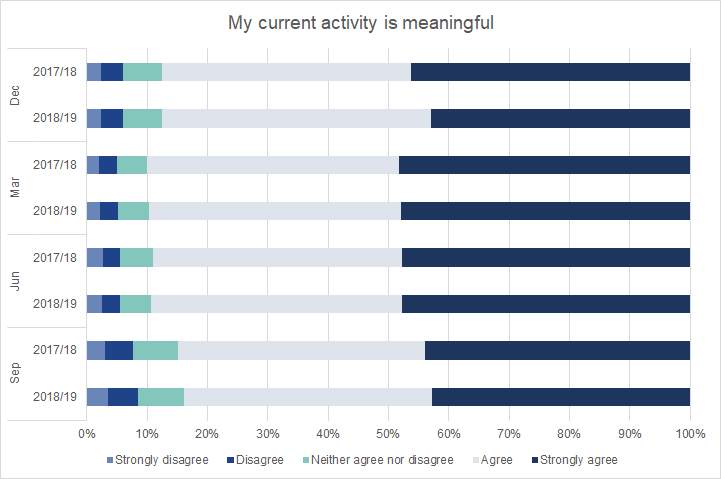
Figure 12. Graduates' agreement with the statement "My current activity fits with my future plans" in 2017/18 and 2018/19 surveys by cohort
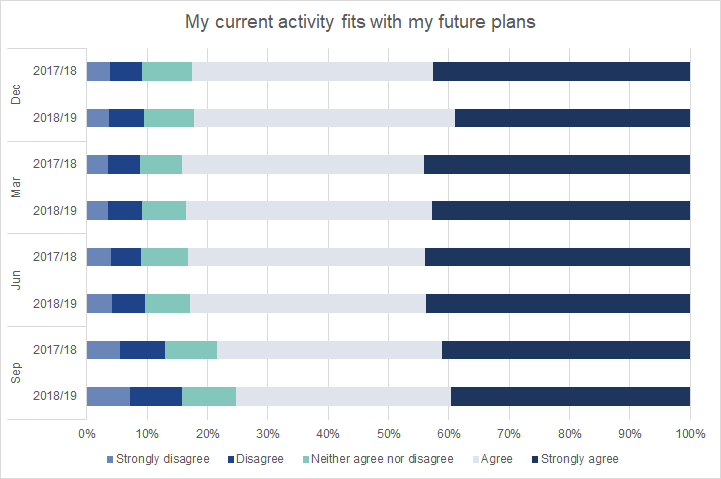
Figure 13. Graduates' agreement with the statement "I am utilising what I learnt during my studies in my current activity" in 2017/18 and 2018/19 surveys by cohort
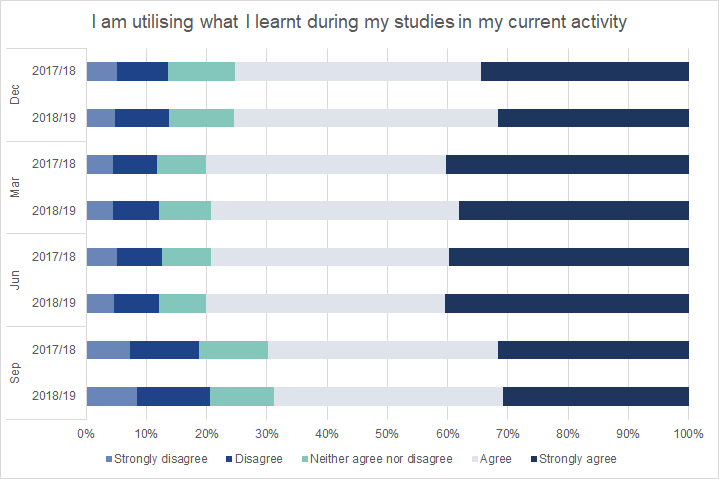
Overall, the differences were not nearly so pronounced as we might have expected. Comparing the 2018/19 responses to the graduate voice questions to those from 2017/18, we see that they are for the most part very similar (Figures 11 to 13). We see some slight variation in responses to the three questions, but, particularly given the lack of any noticeable cohort-on-cohort changes between the two years, we cannot attribute this variation to the effects of the pandemic. For those graduates who were in work at the time of the Graduate Outcomes survey, the pandemic does not seem to have changed their feelings about the work they were doing. This may be explained in part by the ways in which the pandemic affected different types of work; since a high proportion of graduates work in highly-skilled, office-based roles, many graduates will have been able to shift to remote working without experiencing a major disruption in their working lives.[11]
Figure 14. Graduates' own assessment of their anxiety in 2017/18 and 2018/19 surveys by cohort
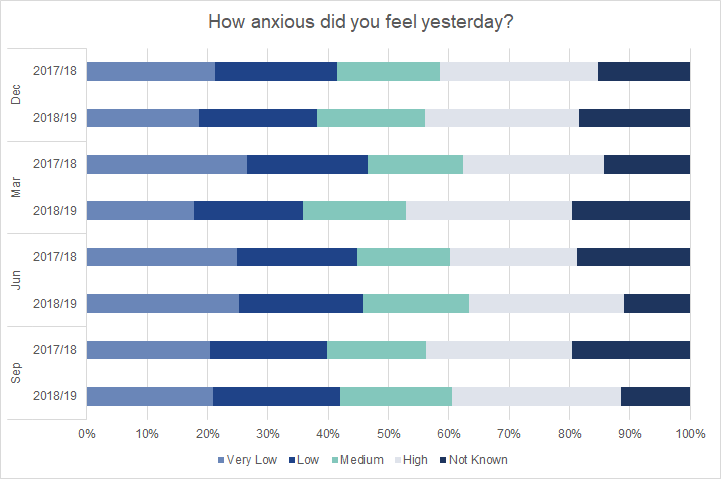
Figure 15. Graduates' own assessment of their happiness in 2017/18 and 2018/19 surveys by cohort
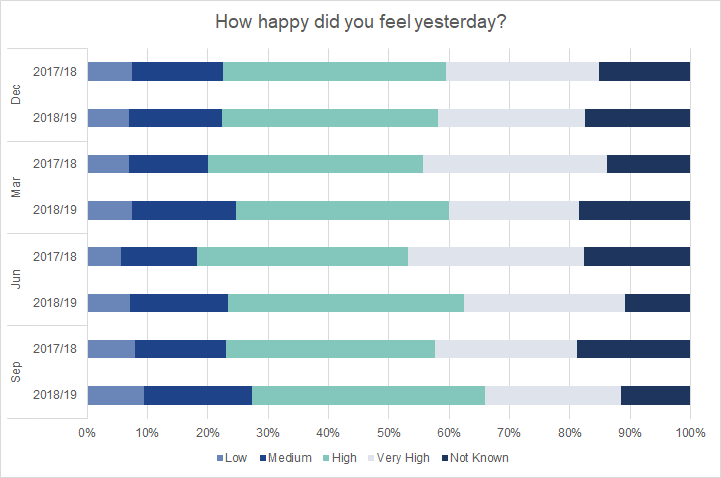
Figure 16. Graduates' own assessment of whether what they do is worthwhile in 2017/18 and 2018/19 surveys by cohort
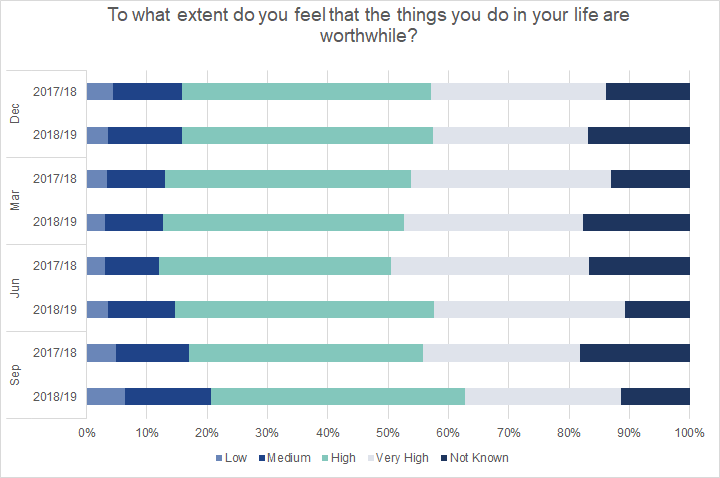
Figure 17. Graduates' own assessment of satisfaction with their lives in 2017/18 and 2018/19 surveys by cohort
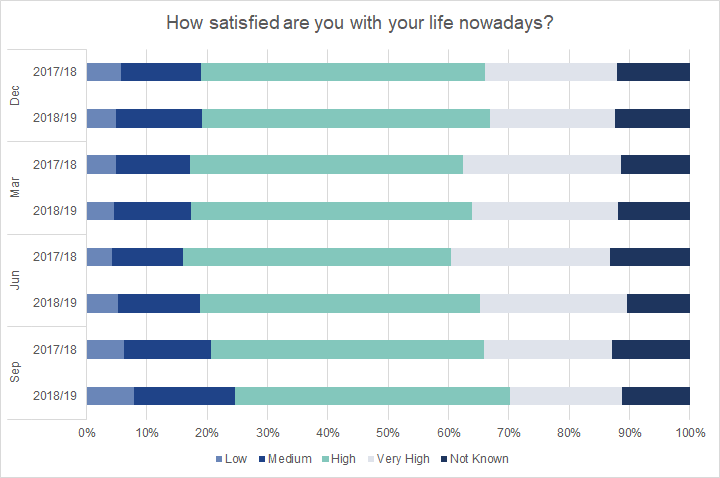
When we look at the responses we received to the four subjective wellbeing questions, we see a slight contraction in highly positive responses in 2018/19 compared to 2017/18, particularly in the later cohorts—that is, 2018/19 graduates were less likely to say that they were very happy, very satisfied with their lives, that their lives were very worthwhile, or that they had very low anxiety (Figures 14 to 17). For the most part, this reduction in highly positive responses correlated with an increase in moderate wellbeing scores, rather than a noticeable increase in low or very low scores. While the pandemic may have taken a toll on graduate wellbeing, the pandemic will not have been the only factor involved in the subjective wellbeing of the 2018/19 graduates, and overall wellbeing seems to have remained relatively resilient in the face of a turbulent year.
Conclusions
When the first year of Graduate Outcomes surveying closed at the end of November 2019, none of us expected that the second year of the survey would be dominated by a pandemic, with restrictions on travel, work, and social gatherings in place around the world for months at a time. When the UK went into lockdown in March 2020, however, HESA and its survey partners determined that survey collection should continue even as we all shifted to remote working. Despite some initial worries about how graduates might respond to being surveyed during a pandemic, 2018/19 response rates improved over those from the 2017/18 survey. Our subsequent investigation of the 2018/19 dataset, in which we looked also at the response rates for graduates with specific characteristics, has left us with no reason to think that the pandemic introduced bias into the responses we received. An independent investigation into whether we should weight the survey data to correct for non-response bias, which found no significant difference between weighted and unweighted data, adds further support to the conclusions we reached about the impact of the pandemic. We therefore believe that it is appropriate to proceed with our publications as originally planned.
It is nevertheless important to consider this year’s data release in light of the pandemic. Response rates are robust, and the quality of the data remains high, but the data itself is a reflection of the circumstances under which it was collected; if the 2018/19 Graduate Outcomes data shows a higher proportion of graduates in unemployment and a lower proportion of graduates taking time out to travel, that is because the data was collected in a year in which unemployment rates rose across society and most travel was prohibited. This insight brief therefore forms part of a range of support which we will provide alongside this year’s Graduate Outcomes, in order to help users contextualise this year’s data.
As we take stock of the effects of the Covid-19 pandemic on society, the 2018/19 Graduate Outcomes data will be a valuable record of what recent graduates were doing during the initial phases of the pandemic. It will provide a point of comparison not only to data from the pre-pandemic 2017/18 survey, but also to data from the 2019/20 survey, which will cover graduates who finished their courses during the pandemic, and to data from subsequent years, as we see the effects of the pandemic ripple gradually outwards. In the coming years, as the longer-term economic impacts of the pandemic become increasingly clear, we will continue to undertake detailed assessment of the Graduate Outcomes data and to publish further insight briefs to help users understand the ongoing effects of the pandemic on graduate experiences.
[1] Public Health England. 2021. COVID-19 confirmed deaths in England (to 31 January 2021): report. https://www.gov.uk/government/publications/covid-19-reported-sars-cov-2-deaths-in-england/covid-19-confirmed-deaths-in-england-report
[2] A. Powell and B. Francis-Devine. 2021. Coronavirus: impact on the labour market. https://researchbriefings.files.parliament.uk/documents/CBP-8898/CBP-8898.pdf
[3] House of Commons Women and Equalities Committee. 2021. Unequal impact? Coronavirus and the gendered economic impact. https://committees.parliament.uk/publications/4597/documents/46478/default/
[4] Institute for Fiscal Studies. 2021. The gendered division of paid and domestic work under lockdown. https://ifs.org.uk/uploads/WP2117-The-gendered-division-of-paid-and-domestic-work-under-lockdown.pdf
[5] ONS. 2020. Why have Black and South Asian people been hit hardest by COVID-19? https://www.ons.gov.uk/peoplepopulationandcommunity/healthandsocialcare/conditionsanddiseases/articles/whyhaveblackandsouthasianpeoplebeenhithardestbycovid19/2020-12-14
ONS. 2020. Coronavirus and the social impacts on different ethnic groups in the UK: 2020. https://www.ons.gov.uk/peoplepopulationandcommunity/culturalidentity/ethnicity/articles/coronavirusandthesocialimpactsondifferentethnicgroupsintheuk/2020
[6] ONS. 2021. Coronavirus and the social impacts on disabled people in Great Britain: February 2021. https://www.ons.gov.uk/peoplepopulationandcommunity/healthandsocialcare/disability/articles/coronavirusandthesocialimpactsondisabledpeopleingreatbritain/february2021
[7] Deprivation measures vary across the UK. We used the Index of Multiple Deprivation (IMD) for graduates domiciled in England; the Welsh Index of Multiple Deprivation (WIMD), the Scottish Index of Multiple Deprivation (SIMD), and the Northern Irish Multiple Deprivation Measure (NIMDM) were used for graduates domiciled in each of the devolved nations, respectively.
[8] B. Duffy et al. 2005. Comparing data from online and face-to-face surveys. International Journal of Market Research, 47(6): 615-639.
[9] For a fuller discussion of the alignment of Graduate Outcomes unemployment data with standard definitions, see section 3.5.1 of the Graduate Outcomes Quality Report.
[10] ONS. 2020. Labour market overview, UK: November 2020. https://www.ons.gov.uk/employmentandlabourmarket/peopleinwork/employmentandemployeetypes/bulletins/uklabourmarket/november2020#employment-unemployment-and-economic-inactivity
A06 NSA: Educational status and labour market status for people aged from 16 to 24 (not seasonally adjusted)
[11] ONS. 2020. Which jobs can be done from home? https://www.ons.gov.uk/employmentandlabourmarket/peopleinwork/employment...

