The impact of the COVID-19 pandemic on Graduate Outcomes 2020/21
Introduction
The World Health Organization (WHO) declared the outbreak of the newly identified COVID-19 virus a public health emergency of international concern (PHEIC) on 30 January 2020, less than two months before starting to refer to the outbreak as a pandemic on 11 March of the same year. On 4 May 2023, more than three years after the initial declaration, the WHO came to the conclusion that, while COVID-19 is still circulating widely, it is no longer the kind of unusual or unexpected threat which would constitute an ongoing PHEIC.[1] The WHO therefore declared the emergency phase of COVID-19 to be over.
Since the early days of the pandemic, we have been considering the possible impacts of COVID-19 both on our data collection processes and on the data we collect and publish. In the initial months of the pandemic, this meant making sure that the Graduate Outcomes survey methodology was still appropriate within the changed context of the pandemic. In subsequent years, once we started receiving data collected under pandemic circumstances, we have performed analyses to determine whether any effects of the pandemic have been apparent in the data. We have also conducted similar research into potential effects of the pandemic on our 2020/21 and 2021/22 Student data.
This insight brief will be the third and final insight brief devoted to the impact of COVID-19 on Graduate Outcomes. In the first two insight briefs, we found little change in the data which could be firmly attributed to the pandemic rather than normal year-on-year variation. When we looked at the data on 2019/20 graduates, we saw that the few changes we had seen in the 2018/19 data already looked to be levelling off or returning to what we had seen in the first year of Graduate Outcomes, before the start of the pandemic. With the passage of time, moreover, it was starting to become increasingly difficult to separate the impacts of COVID-19 from the impacts of other world events, a trend that seemed likely to continue in future years.
For all these reasons, we took the decision that the 2023 HESA publication cycle – covering the 2021/22 Student data and the 2020/21 Graduate Outcomes data – would be the last for which we would publish separate insights on the pandemic. While we will continue to consider the extent to which COVID-19 is likely to have an impact on our data, in future years we intend to include COVID-19 as part of a wider range of contextual factors.
Outline and key findings
This insight brief will follow the same basic structure as previous examinations of the potential impact of COVID-19 on the Graduate Outcomes data. We will begin with a discussion of the varying pandemic contexts under which the 2020/21 graduates finished their qualifications and completed the survey. Following that, we will examine any potential impacts of the pandemic on changing response rates over the past three years, with some discussion of other factors which are likely to be at play in the most recent data. In the final section of the insight brief, we will look at potential impacts of COVID-19 on responses to key questions, beginning with graduate activity and continuing on to skill level and industry of employment and responses to the graduate reflections and subjective wellbeing questions.
In this year’s investigation of the potential effects of the pandemic on Graduate Outcomes, we arrived at the following key findings:
- Although response rates vary by cohort, we see no major changes in response rate that are likely to be related to COVID-19, either overall or when we split response rates by graduates’ personal characteristics.
- 2020/21 graduates are more likely than 2019/20 graduates to be in full-time work and less likely to be unemployed or in full-time further study.
- The 2020/21 rate of full-time employment is the highest since the start of the Graduate Outcomes survey.
- We see no notable changes in the skill level at which graduates are employed.
- We see very little overall change in graduates’ reflections on their activities.
- After a dip in the first year of the pandemic, graduate subjective wellbeing has remained broadly stable since the second year of surveying.
Pandemic context
Starting with the 2018/19 survey, each year of the Graduate Outcomes survey has intersected with the COVID-19 pandemic in different ways.
In the second year of Graduate Outcomes, which surveyed graduates who finished their qualifications in the 2018/19 academic year, we looked at graduates who had finished before the pandemic began, some of whom were contacted under pandemic circumstances. Last year, we looked at graduates from the 2019/20 academic year, many of whom finished their qualifications after the pandemic had begun; when these graduates were surveyed, different levels of pandemic restrictions were in force, depending on survey cohort.
The 2020/21 Graduate Outcomes respondents finished their qualifications in the second academic year affected by COVID-19 (Figure 1). While Cohort A finished their qualifications during late summer and early autumn 2020, in a period of relatively loose restrictions, restrictions began to increase over the course of the academic year. Cohort B graduated into a period of short national lockdowns, followed by the start of the second national lockdown in January 2021. Cohort C likewise graduated in lockdown, but the progress of the vaccination programme led to a gradual easing of restrictions as spring progressed; by the time Cohort D began to finish their qualifications in May 2021, most adults had been offered a first vaccine dose, and restrictions were gradually being phased out across the UK.
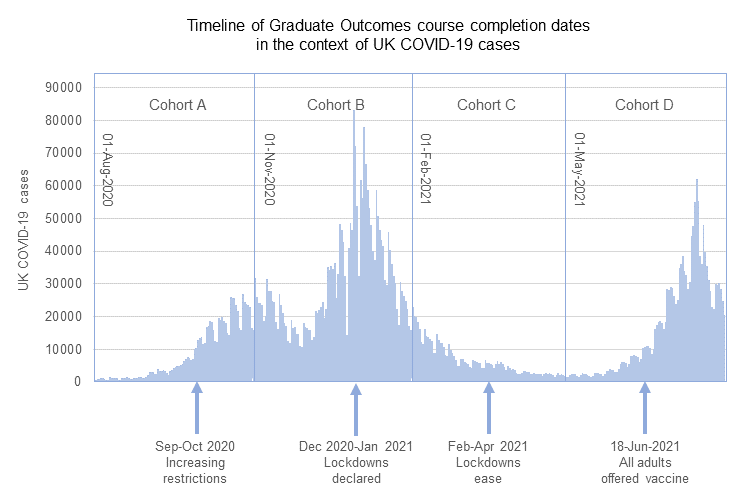
Figure 1. 2020/21 Course completion dates in the context of the COVID-19 pandemic
The circumstances under which 2020/21 graduates were surveyed were quite different. As surveying for Cohort A opened in December 2021, although Omicron variant cases were rising and new guidance was being issued requiring masks in indoor spaces and encouraging people to work from home where possible, the new restrictions were considerably more lenient than those which were introduced a year previously. By the time the Cohort B survey period opened in March 2022, all legal restrictions had been lifted in England and Northern Ireland, and remaining restrictions were phased out in other nations over the next few months. Although COVID cases rose from the start of June to a summer peak in early July, no legal restrictions were in place during the survey periods for Cohorts C and D.
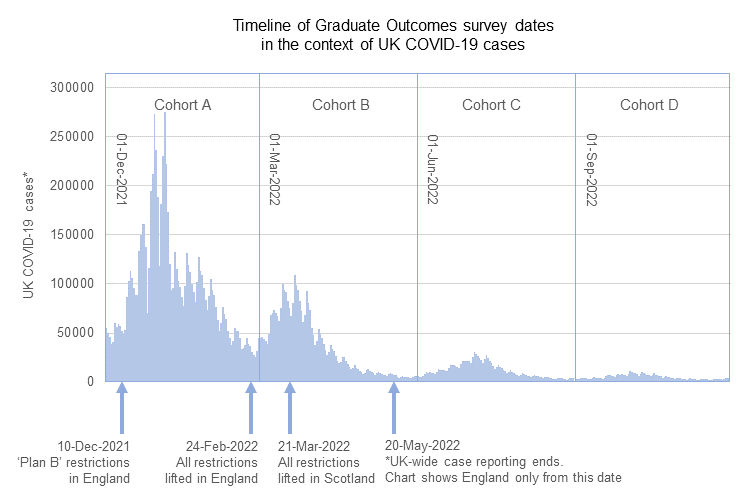
Figure 2. 2020/21 Graduate Outcomes survey contact periods in the context of the COVID-10 pandemic
When we looked at the 2019/20 data, we noted that, while the overall impact of COVID-19, if there was one, was very small, graduates seemed to be most affected by the circumstances under which they were surveyed. That is, graduates who were surveyed under pandemic restrictions were more likely to report outcomes that aligned with our hypotheses about potential effects of the pandemic than graduates who finished their qualifications under restrictions but were surveyed after restrictions had eased. Looking at the 2020/21 data, in which most graduates were surveyed after all restrictions had been lifted, we therefore expected to see little if any identifiable impact of COVID-19.
Rates of response to the 2020/21 Graduate Outcomes survey
When we began looking into potential pandemic effects on our data, one of our initial hypotheses was that COVID-19 – or the changing circumstances brought about by the pandemic – might affect response rates.[2] The direction of any potential impact, however, was uncertain; while those graduates experiencing adverse outcomes during the pandemic might hesitate to respond in a less than positive way, and those working in key sectors might not have time to respond at all, it also seemed possible that graduates working from home might be easier to contact and have more time to complete the survey.
Response rates by cohort and year
Over the first three years of surveying, although there were some year-on-year changes in response rates, we saw a relatively stable annual pattern in the response rates from cohort to cohort. We consistently saw the lowest response rates from graduates in Cohort A, followed by a rise in response rates for Cohorts B and C, and then a slight dip in response rates for graduates in Cohort D, the largest Graduate Outcomes cohort. In the 2020/21 data, we see a similar pattern in the first three cohorts, with the lowest response rates from graduates in Cohort A and slightly higher response rates in the following two cohorts. In contrast to previous years, however, response rates from graduates in Cohort D are higher than those from graduates in Cohorts B and C (Figure 3).
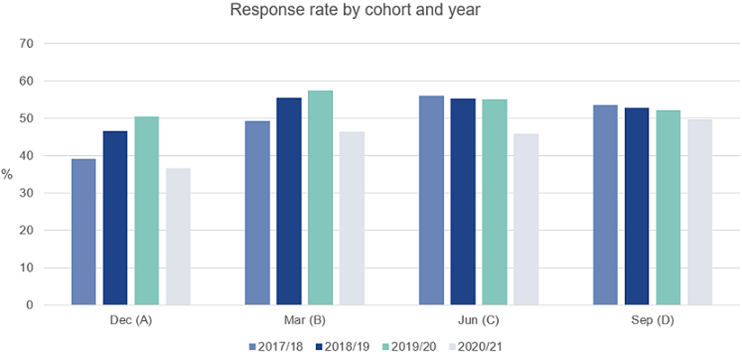
Figure 3. Response rates by cohort and year
For each cohort, 2020/21 response rates are lower than we have seen in previous years. In previous years, we have sometimes seen slightly elevated response rates in survey periods with strict lockdown restrictions, when graduates were more likely to be at home; it is therefore possible, although we cannot establish a definite causal relationship, that part of the reduction in response rates for 2020/21 is related to the loosening of restrictions across the UK. The main driver for the change in response rates, however, is both unrelated to the pandemic and also explains the change in Cohort D responses relative to earlier cohorts. Starting with Cohort A of the 2020/21 survey year, HESA ceased to contact non-EU international graduates by telephone, while continuing to invite them by email and SMS to complete the Graduate Outcomes survey.[3] This led to a decrease in response rates from international graduates, which, in turn, led to a decrease in overall response rates for 2020/21.
Cohorts with a higher proportion of international graduates, however, were more strongly affected by this change than cohorts with a higher proportion of UK- and EU-domiciled graduates. Cohort D, which is primarily made up of graduates who finished undergraduate first degree courses, has a lower proportion of international graduates than Cohorts A through C. Consequently, while the Cohort D response rate for 2020/21 is lower than we have seen in previous years, it is still higher than the response rate for earlier 2020/21 cohorts. Since the pandemic circumstances under which Cohorts C and D were surveyed were very similar, it is unlikely that any change in restrictions contributed to the changed pattern in response rates.
Response rates by personal characteristics
In our examination of the potential effects of COVID-19 on response rates, we looked not only at overall and cohort-level responses, but also at responses split by a range of personal characteristics.
Early in the COVID-19 pandemic, it became clear that the pandemic was affecting different groups in different ways. Disparities in health outcomes could be seen by age, ethnicity, and disability status, with older people, people from ethnic minority groups, and people with disabilities more likely to experience severe illness and mortality.[4] The economic impact of the pandemic also varied, with younger people and women disproportionally affected, particularly at the start of the pandemic.[5]
When we look at the response rates for different groups shown in Figures 4 through 7 below, however, we see no notable year-on-year changes which we can attribute to the effects of the COVID-19 pandemic. When we look at response rates by age, sex, and disability, we see instead the effect of the cessation in international calling. 2020/21 responses are lower than in previous years across all age groups, but with a particularly sharp decrease amongst graduates aged 25-29, in which category internationally domiciled postgraduate students are disproportionately represented (Figure 4). Decreases in response rates from male and female graduates are of similar magnitude, but we see a much smaller decrease in response rates from students whose sex is recorded as other, the majority of whom are UK-domiciled (Figure 5). Response rates from graduates with disabilities decreased slightly between 2019/20 and 2020/21, while response rates from graduates with no known disability decreased more sharply, which aligns with the fact that a smaller percentage of non-EU international graduates identify as disabled than UK- or EU-domiciled graduates (Figure 7).[6]
Ethnicity is only recorded for UK-domiciled graduates, so here we see no effect from the change in international response rates. As with overall response rates, we see no year-on-year variation by ethnicity which we can attribute to the pandemic. Graduates from some ethnic groups are slightly more likely to respond to the Graduate Outcomes survey than others, but these differences have remained relatively stable year-on-year, regardless of the pandemic context (Figure 6).
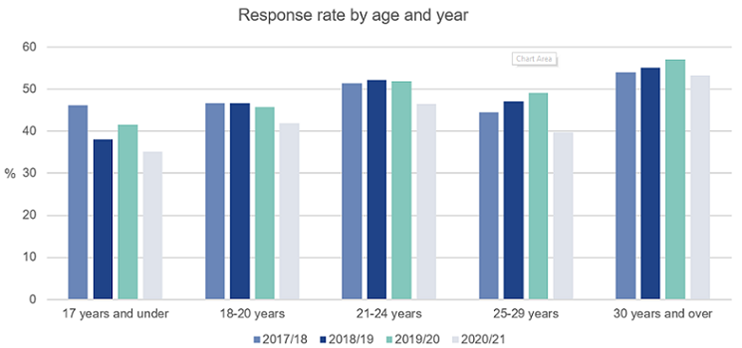
Figure 4. Response rates by age and year
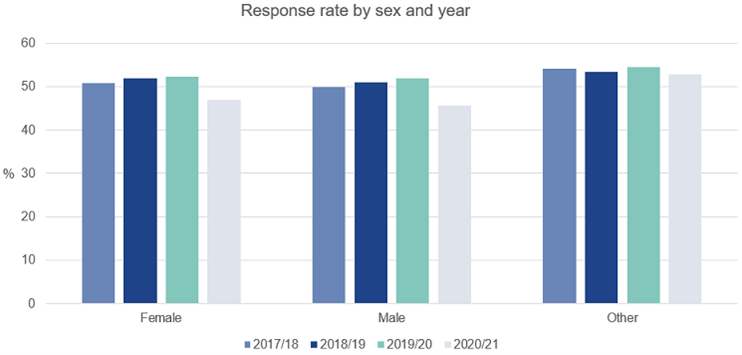
Figure 5. Response rates by sex and year
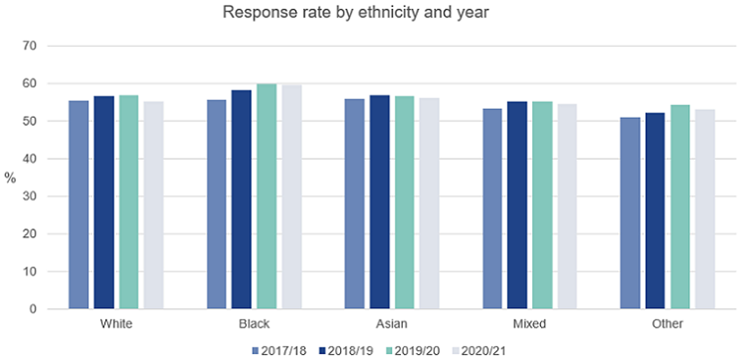
Figure 6. Response rates by ethnicity and year
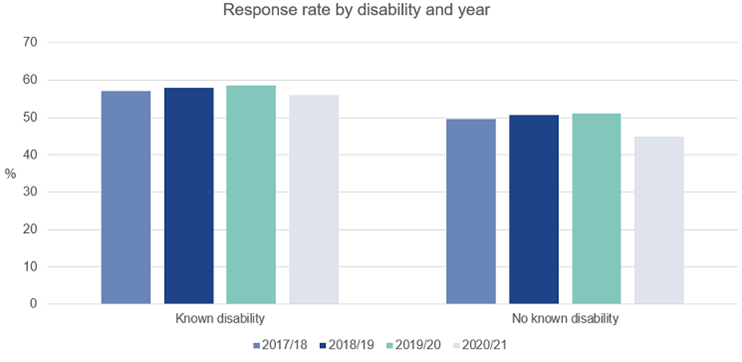
Figure 7. Response rates by disability and year
As we have seen in previous years, the COVID-19 pandemic does not seem to have affected the response rates for graduates with different personal characteristics. While there is some variation in response rates for different groups, this has been true since the inception of the Graduate Outcomes survey, and this variation is typically modest. In terms of how well survey responses represent the overall Graduate Outcomes population, we remain confident that COVID-19 has not contributed to non-response bias in our data. While this adds further support to our conclusion that there is no reason to weight our survey data, we continue to monitor our data on an annual basis for signs of emerging bias, and we will adjust our approach to weighting if necessary.
The experiences of graduates over the course of the pandemic
Our interest in response rates stems from a need to be sure that the COVID-19 pandemic has not had an adverse effect on the quality of our data. The COVID-19 pandemic, however, was not just a potential data quality issue. The first months of the pandemic radically changed almost every aspect of daily life, including work, travel, and social interaction, and many effects of the pandemic persisted long after widespread vaccination led to the lifting of legal restrictions. Since we started monitoring the impact of the pandemic on Graduate Outcomes, we have therefore looked not only at response rates, but also at how graduates have answered key questions from the survey.
Looking at the data from previous years of the survey, we have seen few changes which might be linked to the pandemic, and these changes have always been minor. As mentioned above, the 2020/21 Graduate Outcomes graduates finished their qualifications under different pandemic circumstances than graduates from the previous two ‘pandemic years’; although COVID-19 was circulating widely and restrictions were in place for much of the 2020/21 academic year, the vaccine programme was underway, and, by the time graduates in Cohort D were finishing their studies, many restrictions had been lifted. When these graduates received the Graduate Outcomes survey, the situation was different once again, and, despite concerns about the Omicron variant, the lockdowns of the pre-vaccine era were a thing of the past.
Graduate activities overall
Compared to previous ‘pandemic years’, the 2020/21 Graduate Outcomes respondents were surveyed at a point when the impact of the pandemic on daily life was decreasing steadily. Given that the few changes in graduate activity which we thought might be connected to the pandemic had already started to level off or reverse direction in the 2019/20 data, we expected to see something similar in this year’s data. For most activity categories, in fact, the 2020/21 data indicates a return to something close to the pre-pandemic baseline (see Graduate Outcomes Figure 1 below).[7]
Figure 1 - Graduate outcomes by activity
Academic years 2017/18 to 2020/21
When we compare the 2020/21 data to the data from the previous year, most of the changes that are visible are relatively small, suggesting a level of variation that would not be unusual between one year and the next under normal circumstances. As was the case last year, however, the direction of the changes which we do see is notable. For most graduate activities, we now see negligible variation between the 2020/21 data and data from 2017/18, the last year of data collected before the start of the pandemic. The biggest changes visible in the 2020/21 data are in full-time employment (up three percentage points from 2019/20), full-time study, and unemployment (both down one percentage point from 2019/20). While the Graduate Outcomes unemployment rate for 2020/21 is now equal to the rate from 2017/18, the rate of full-time study is now lower, and the rate of full-time employment is now higher than the pre-pandemic baseline.
This provides an interesting contrast to ONS data covering the same time period, which shows that employment rates in the labour market as a whole are still slightly below pre-pandemic levels.[8] It may be the case that graduate employment opportunities have recovered more quickly than opportunities across the board. An increase in employment opportunities is likely to have affected not only the rate of employment, but also the rate of study, as graduates who might otherwise have gone into further study found themselves drawn by the prospect of full-time work.
When we look at changes in graduate activity for graduates with different personal characteristics, we see few notable trends. Looking at ethnicity, for example, year-on-year changes in graduate employment do not seem to vary for different ethnic groups. When we split our survey respondents by age, we see the largest year-on-year changes amongst graduates aged 21-24. This is the largest group of survey respondents by age, comprising as it does the vast majority of graduates from undergraduate courses, as well as a considerable proportion of graduates from taught postgraduate courses; it seems likely, therefore, that the changes in employment and progression to further study which we are seeing overall are being driven largely by changes in the labour market for relatively young graduates who have recently completed undergraduate study.
When we look at disability, something interesting emerges. Although responses from graduates with no known disability (the largest group of graduates) are broadly in line with responses from the population as a whole, graduates with disabilities display slightly different patterns of both employment and further study. Unlike in the population as a whole, the proportion of graduates with disabilities in further study (either full- or part-time) has remained steady since 2019/20, and the proportion of graduates with disabilities in employment and further study has increased year-on-year. Similarly, we see an increase in graduates with disabilities in part-time employment, while the overall rate of part-time employment has decreased. It therefore seems possible that the factors which have led graduates without known disabilities to choose employment over further study have not extended to graduates with disabilities. It may be the case, for example, that, as the proportion of adults working from home has stabilized following a peak during the second national lockdown, emerging opportunities for full-time employment, many of which may require a high proportion of time spent in the office, have not been as suitable for the needs of graduates with disabilities.[9]
Graduate activities by cohort
In previous years of the pandemic, different survey cohorts have been contacted under very different pandemic circumstances. Although some restrictions were still in place during the survey contact period for 2020/21’s Cohort A, the COVID-19 situation across the whole of the survey year was much more stable than that which we saw in previous years. We therefore expected that the 2020/21 activity data would show less variation between cohorts than we saw in previous years.
Figure 8 - Graduates activities by cohort
Academic years 2017/18 to 2020/21
When we look at Figure 8 above, we see relatively small variations between cohorts for most activity categories; the percentage of graduates in employment and further study, for example, oscillates between 9% and 10% over the four survey cohorts. For many activity categories, moreover, the variation which we do see between cohorts is consistent between different survey years. Each year, for example, graduates in Cohorts B and C are less likely to be in full-time further study than graduates in Cohorts A and D, with graduates in Cohort D most likely to be in full-time further study. Similarly, graduates in Cohort D are regularly less likely to be in full-time employment than graduates in other cohorts, in part because they are more likely to be in further study. Given that the differences we see between cohorts have remained relatively consistent despite the changing COVID-19 context, it seems likely that these differences are driven not so much by the pandemic as by underlying differences between the graduates in different cohorts.
Employment by level and industry
Some of the most obvious changes brought about by the COVID-19 pandemic, particularly in its early stages, were changes to the world of work. With the first national lockdown, we saw an injunction to work from home for those who could, coupled by the furlough scheme to support those employees who could not work from home and were not working in key sectors. As the pandemic continued and restrictions shifted, the impact on different sectors and jobs shifted, too, with increased opportunities in some areas and decreased opportunities in others.[10] When we started monitoring the possible effects of the pandemic on Graduate Outcomes data, it seemed likely that these shifts in the labour market would be visible in the kinds of work being done by recent graduates.
The Standard Occupational Classification (SOC) system organizes jobs into nine major groups, depending on the type and level of skill required to do the job. When we look at the jobs done by graduates in terms of their SOC major groups, we see only minor year-on-year changes over the four years of the Graduate Outcomes survey (Figure 9). In the data for 2018/19, the first year looking at graduates potentially affected by the pandemic, we saw a one percentage point increase in graduates working in both sales and customer service occupations (Group 7) and elementary occupations (Group 9). By 2020/21, however, both of these changes have been reversed, with the percentage of graduates working in elementary occupations down at its pre-pandemic level and the percentage of graduates in sales and customer service occupations down to 4%, one percentage point lower than we saw in 2017/18. In the 2020/21 data, graduates working in as managers, directors and senior officials (Group 1) are up by one percentage point on 2019/20, while graduates working in associate professional occupations (Group 3) are up two percentage points.
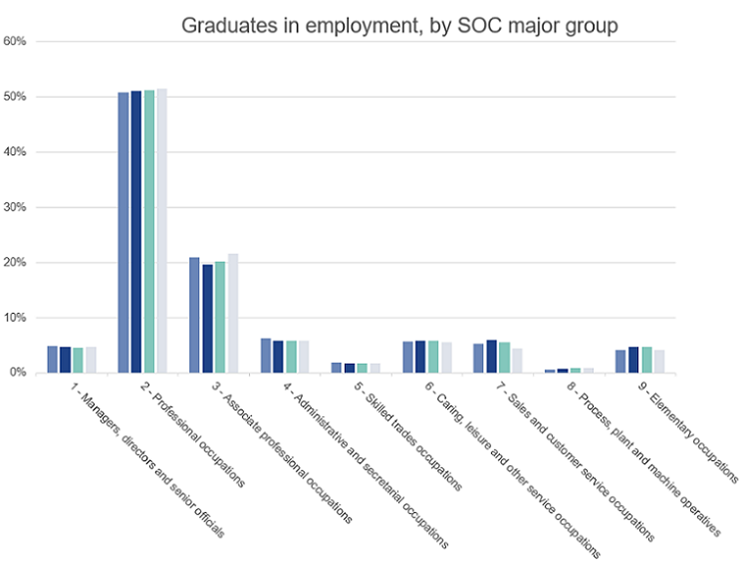
Figure 9. Graduates in employment, by SOC major group
The nine SOC major groups can be used to assign jobs to three broad skill levels, each comprised of three major groups. Looking at graduates in employment in terms of skill level, we likewise see little variation over the four years of data (Figure 10). The variation in skill level which we do see is a one percentage point decrease in graduates working in low skilled jobs since 2017/18, along with a two percentage point increase in graduates working in high skilled jobs, reflecting the decreases in Groups 7 and 9 and increases in Groups 1 and 3 described above. This decrease in graduates working in lower skilled jobs, coupled with an increase in graduates working in higher skilled jobs, may reflect changing needs for certain kinds of work or a recovery in the professional labour market following the acute phase of the pandemic. It is just as likely, however, that these minor changes represent normal year-on-year variation in the data.
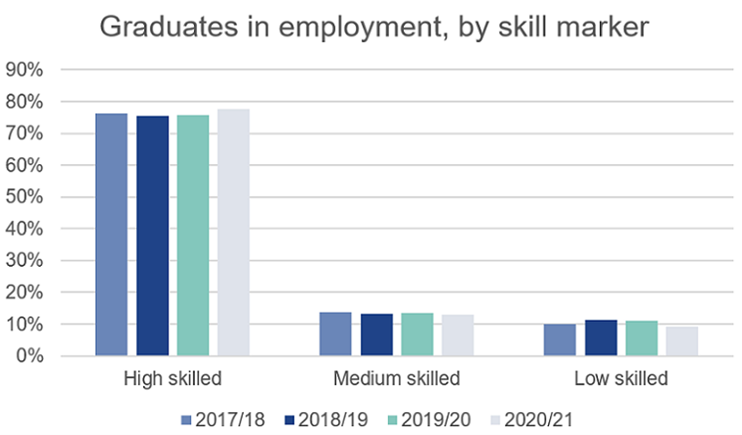
Figure 10. Graduates in employment, by skill marker
We can also consider graduate employment in terms of industry, using the Standard Industrial Classification (SIC) system to categorise jobs in different employment sectors. Given that certain industrial sectors effectively shut down in the early years of the pandemic, whilst other sectors gained prominence as sectors critical to the pandemic response, we expected to see notable variation in the industries in which graduates were employed when we first looked for changes in SIC over the course of the pandemic.
While we do see some changes in industry of employment over the four years of Graduate Outcomes data, and while those direction of changes in some cases matches what we might expect, the magnitude of the changes is very small. For example, while we saw a dip in the percentage of graduates working in the arts, entertainment and recreation sector over the first two years of pandemic data, followed by a slight increase in the 2020/21 data, the dip over the first two years totaled less than one percentage point, and the subsequent recovery was even smaller. Similarly, while we saw a slight increase in graduates working in human health and social work activities from 2017/18 to 2019/20, which might correspond with the increased focus on the NHS during the pandemic, followed by a slight decrease in 2020/21, the increase from 2017/18 to 2019/20 was a change of only slightly more than one percentage point. While it is tempting to see the influence of the pandemic in these changes, their small magnitude makes it impossible for us to be certain that what we are seeing is not just normal year-on-year variation.
In discussions of graduate employment and employability, subject of study and the ways in which different subjects prepare graduates for the workforce are areas of recurrent interest. It would therefore have been interesting to include subject of study in our analysis of graduate employment outcomes over the course of the pandemic. Since HESA changed its subject coding from JACS to HECoS for the 2019/20 academic year, work has been underway to assess the suitability of the Common [subject] Aggregation Hierarchy (CAH), our subject mapping system, to enable time series analysis of subject data. That work is nearing completion and will be published in summer 2023. Once that work is complete, we will reassess our position on publishing time-series data on subject of study; until then, however, we stand by our previous conclusion that we cannot confidently present subject time-series comparisons that span the change in subject coding frames.[11]
Graduate reflections and subjective wellbeing
While many of the most obvious changes brought about by the pandemic concerned what people did and did not do, as people worked from home, wore masks, maintained social distance, and avoided mingling with members of other households, the pandemic also brought about changes in attitude. Since the start of the COVID-19 pandemic, many workers have been reconsidering their employment priorities, leading to fears of a ‘Great Resignation’ as workers leave their jobs in search of a better work-life balance or alternative employment that better suits their needs.[12] Over the same period, society has also seen an increased focus on mental health and wellbeing, with concerns about the effect of pandemic restrictions on feelings of loneliness and isolation.[13]
In addition to collecting data about the activities of graduates, the Graduate Outcomes survey asks respondents two sets of questions about their perceptions and feelings. In the three graduate reflections questions, graduates are asked how they feel about their current activities, while the four subjective wellbeing questions give graduates the opportunity to report on different aspects of wellbeing. By tracking responses to the graduate reflections and subjective wellbeing questions over the four years of the Graduate Outcomes survey, we hoped to be able to identify any changes over the course of the pandemic in how graduates feel, both about their current activities and about their lives more generally.
Graduate reflections
When we look at overall 2020/21 responses to the graduate reflections questions, we see for all three questions a year-on-year decrease in the proportion of graduates who say they agree. In the case of the questions on meaningfulness and whether graduates’ current activities fit with their future plans, this decrease is offset by a corresponding increase in the proportion of graduates who say they strongly agree; in the case of the question about whether graduates are utilising what they learned in their studies, the decrease in agreement is coupled with a slightly smaller decrease in strong agreement, while other responses hold steady or increase very slightly year-on-year.
Looking at responses to the graduate reflections questions by survey cohort, we see a difference between Cohort D and the first three survey cohorts (Figures 11 to 13). For all three questions, we see a year-on-year decrease in the proportion of graduates from Cohorts A through C saying they agree strongly, coupled with an increase in the proportion saying they agree; all other response categories remain stable year-on-year. For graduates from Cohort D, however, we see an increase in graduates saying they agree strongly and a decrease in graduates saying they agree, reversing an opposite trend in the previous year and, since Cohort D is the largest cohort, driving the overall decrease in 2020/21 graduates saying they agree. Given that, in the 2020/21 survey year, Cohort D was very similar to the preceding two cohorts in terms of its pandemic context, it is difficult to explain this difference in terms of COVID-19 with any certainty. It may be the case, however, that, as the difficulties of the pandemic era receded further into the past, graduates began to feel increasingly optimistic about their current activities, and therefore increasingly likely to agree strongly that things were moving in the right direction.
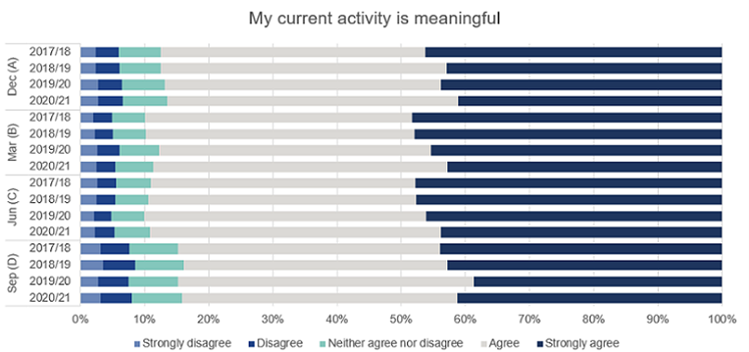
Figure 11. Graduates’ agreement with the statement ‘My current activity is meaningful’, by year and survey cohort
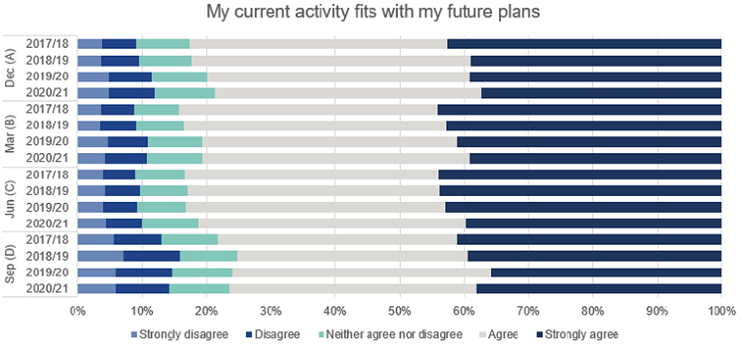
Figure 12. Graduates’ agreement with the statement ‘My current activity fits with my future plans’, by year and survey cohort
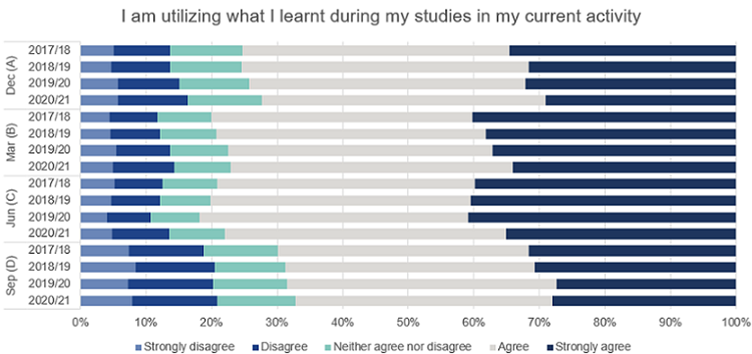
Figure 13. Graduates’ agreement with the statement ‘I am utilising what I learnt during my studies in my current activity’, by year and survey cohort
Subjective wellbeing
Since the start of the pandemic, the ONS has been monitoring the effects of the pandemic on personal wellbeing through its regular Opinions and Lifestyle Survey.[14] Across society, the ONS has seen more negative responses to its four subjective wellbeing questions since the start of the pandemic, with particular decreases in wellbeing associated with periods of more stringent restrictions; although wellbeing seems to have stabilised since restrictions eased, it has not returned to pre-pandemic levels.[15] When we look at Graduate Outcomes data on subjective wellbeing over the pandemic years, we see a slight increase in anxiety in the 2018/19 data, along with slight decreases in highly positive responses to the questions about happiness and whether graduates feel the things they do in their lives are worthwhile. Since then, response to the wellbeing questions have essentially levelled out; when we look at the data for 2020/21, we see very little overall change since the previous year.
When we consider responses to the subjective wellbeing questions by cohort, we get a little more detail (Figures 14 to 17). In the 2019/20 data, the direction and magnitude of the year-on-year changes which we could see varied by cohort, with, for example, Cohort A showing an increase in high anxiety compared to the previous year, while Cohort B showed a decrease. In the 2020/21 data, however, we see much less variation between cohorts. We see slightly higher levels of high anxiety in Cohort A than in the other three cohorts, possibly reflecting the fact that Cohort A was surveyed during a period of rapidly rising case numbers and uncertainty about the threat posed by the Omicron variant. The subsequent three cohorts, surveyed against a backdrop of lower cases and loose restrictions, show less variation in responses to all four subjective wellbeing questions.
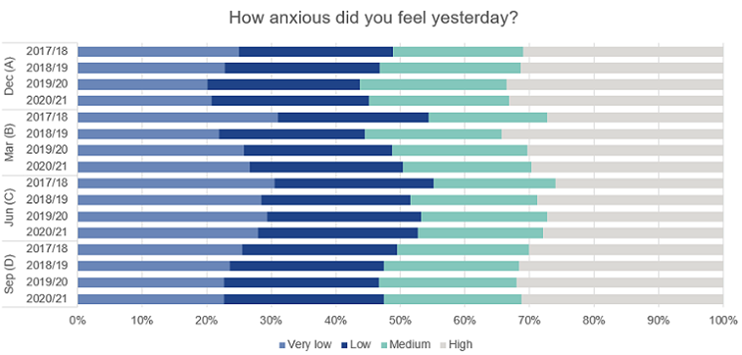
Figure 14. Graduates’ own assessment of their anxiety, by year and survey cohort
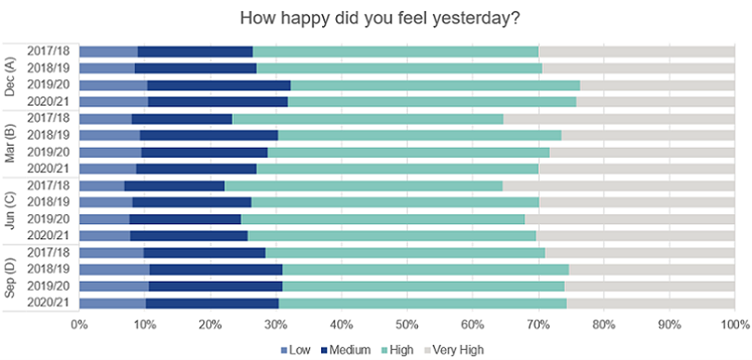
Figure 15. Graduates’ own assessment of their happiness, by year and survey cohort
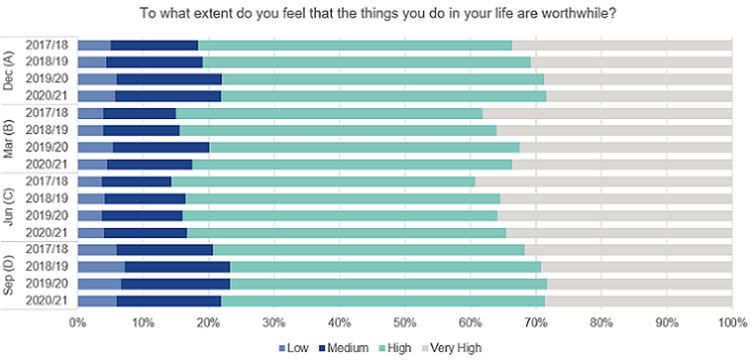
Figure 16. Graduates’ own assessment of whether what they do is worthwhile, by year and survey cohort
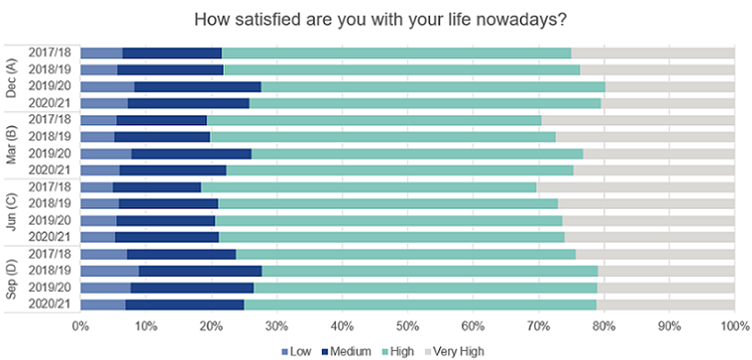
Figure 17. Graduates’ own assessment of satisfaction with their lives, by year and survey cohort
Although COVID-19 was still circulating widely throughout the 2020/21 survey year, by December 2021, when surveying began for Cohort A, the pandemic situation had stabilized considerably when compared to previous years. We can perhaps see this reflected in the 2020/21 subjective wellbeing data. For all four subjective wellbeing questions, we see the most notable changes between 2017/18 and the first year of pandemic data. Over the course of the 2019/20 and 2020/21 survey years, not only were restrictions gradually phased out, but the frequency with which circumstances changed decreased. With this increasing stability, we see a corresponding stabilisation in subjective wellbeing responses; although some variation between years and cohorts remains, this variation can no longer be linked to changing pandemic circumstances.
Conclusions
When we produced the first insight brief on the impact of the COVID-19 pandemic on Graduate Outcomes to accompany the publication of the 2018/19 Graduate Outcomes data, we were looking to shed light on how the unprecedented circumstances of the previous year had affected the survey. We were interested both in data quality and in what we could learn about the experiences of graduates in the early months of the pandemic, and what we learned on both fronts was encouraging – response rates were stable, and we saw few notable changes in what graduates were doing or how they were feeling about it. The following year we repeated the exercise in a new pandemic context, this time looking at the experiences of graduates who had finished their HE courses during the pandemic. Although we thought that we might see more drastic changes than we had seen in the 2018/19 data, we once again saw little change, and those changes which we did see suggested a return to the pre-pandemic baseline.
Having seen few changes which we could firmly attribute to the pandemic in our first two years of monitoring, we thought it unlikely that we would see any new impacts of COVID-19 in the data for 2020/21. As we expected, the 2020/21 data looks similar in most respects to the data from 2019/20. In terms of response rates, the only notable change which we see is the change following the cessation of international calling. At the same time, although responses for many graduate activity categories have remained relatively stable since last year, we do see some changes. Compared to the early years of the pandemic, we see a smaller proportion of graduates who are unemployed and a smaller proportion enrolled in full-time further study. We also see a higher proportion in full-time work, with this figure up two percentage points from the pre-pandemic baseline. While some economic effects of the pandemic linger in society as a whole, it seems that opportunities for graduate employment have recovered strongly.
When we published the 2018/19 data, COVID-19 had been the dominant news story for the past fifteen months. While this was not true to quite the same extent when we published the 2019/20 data, it was still clear that the pandemic had been one of the central events of the survey period. By the time surveying began for 2020/21, COVID-19 remained at the forefront of public consciousness, but other events were gaining prominence, and, as restrictions continued to ease, it became increasingly clear that the pandemic was not the only event on the world stage; to name one prominent example, the Russian invasion of Ukraine in February 2022 triggered a series of economic events which are still unfolding. As other events continue to develop, it will in future years become increasingly difficult to determine which changes in the Graduate Outcomes data can be attributed to COVID-19, and which are connected to other factors. Each year, we consider the context of our publications, and the time now seems right to start thinking of COVID-19 as only one of many factors which may influence our data.
[1] For more detail, see World Health Organization. 2023. Statement on the fifteenth meeting of the IHR (2005) Emergency Committee on the COVID-19 pandemic. https://www.who.int/news/item/05-05-2023-statement-on-the-fifteenth-meeting-of-the-international-health-regulations-(2005)-emergency-committee-regarding-the-coronavirus-disease-(covid-19)-pandemic.
[2] The Office for National Statistics has produced a report on the effect of the pandemic on social surveys more generally, which can be found here: https://www.ons.gov.uk/peoplepopulationandcommunity/healthandsocialcare/conditionsanddiseases/methodologies/impactofcovid19ononssocialsurveydatacollection.
[3] Further information about this decision was published on the HESA website in November 2021: https://www.hesa.ac.uk/blog/11-11-2021/approach-surveying-international-graduates.
[4] For further detail, see Sorensen et al. 2022. ‘Variation in the COVID-19 infection-fatality ratio by age, time, and geography during the pre-vaccine era: a systematic analysis.’ The Lancet 399: 1469-1488. https://www.thelancet.com/journals/lancet/article/PIIS0140-6736(21)02867-1/fulltext#%20; ONS. 2022. Updating ethnic contrasts in deaths involving the coronavirus (COVID-19), England: 8 December 2020 to 1 December 2021. https://www.ons.gov.uk/peoplepopulationandcommunity/birthsdeathsandmarriages/deaths/articles/updatingethniccontrastsindeathsinvolvingthecoronaviruscovid19englandandwales/8december2020to1december2021; House of Lords Library. 2021. Covid-19 pandemic: impact on people with disabilities. https://lordslibrary.parliament.uk/covid-19-pandemic-impact-on-people-with-disabilities/ ; see also Shakespeare et al. 2021. ‘Triple jeopardy: disabled people and the COVID-19 pandemic’. The Lancet 397: 1331-1333. https://www.thelancet.com/journals/lancet/article/PIIS0140-6736(21)00625-5/fulltext.
[5] See Powell et al. 2022. Coronavirus: Impact on the labour market. House of Commons Library. https://researchbriefings.files.parliament.uk/documents/CBP-8898/CBP-8898.pdf; see also Flor et al. 2022. ‘Quantifying the effects of the COVID-19 pandemic on gender equality on health, social, and economic indicators: a comprehensive review of data from March, 2020, to September, 2021’. The Lancet. https://www.thelancet.com/journals/lancet/article/PIIS0140-6736(22)00008-3/fulltext; Institute for Fiscal Studies. 2021. The gendered division of paid and domestic work under lockdown. https://ifs.org.uk/uploads/WP2117-The-gendered-division-of-paid-and-domestic-work-under-lockdown.pdf
[6] For a breakdown of graduates in each domicile category by personal characteristics, see Graduate Outcomes Figure 5: https://www.hesa.ac.uk/data-and-analysis/sb266/figure-5.
[7] It should be noted that this figure has been changed since last year to reflect changes in the survey design. Following the discontinuation of the ‘unemployed and due to start work’ and ‘unemployed and due to start study’ options, those two categories have been combined with ‘unemployed’ into a single category, both for 2020/21 (the year the change in the survey came into effect) and for previous years.
[8] ONS. 2022. Employment in the UK: December 2022. https://www.ons.gov.uk/employmentandlabourmarket/peopleinwork/employmentandemployeetypes/bulletins/employmentintheuk/december2022
[9] On the rate of home working, see ONS. 2023. Characteristics of homeworkers, Great Britain: September 2022 to January 2023. https://www.ons.gov.uk/employmentandlabourmarket/peopleinwork/employmentandemployeetypes/articles/characteristicsofhomeworkersgreatbritain/september2022tojanuary2023.
[10] House of Commons Library. 2022. Insight: How has the pandemic affected industries and labor in the UK? https://commonslibrary.parliament.uk/how-has-the-pandemic-affected-industries-and-labour-in-the-uk/. See also Williams et al. 2020. The impacts of the coronavirus crisis on the labour market: Analysis of quarterly Labour Force Survey data. Institute for Employment Studies. https://www.employment-studies.co.uk/system/files/resources/files/Impacts%20of%20coronavirus%20crisis%20on%20labour%20market_0.pdf.
[11] For further information about the shift from JACS to HECoS and the potential use of CAH to bridge the gap, see: https://www.hesa.ac.uk/news/25-01-2022/sb262-higher-education-student-statistics/notes
[12] See HR Exchange Network. 2022. Employee Engagement and Experience for the post-COVID World. https://www.hrexchangenetwork.com/employee-engagement/articles/employee-engagement-and-experience-for-the-post-covid-world-2. See also World Economic Forum. 2022. The Great Resignation is not over: A fifth of workers plan to quit in 2022. https://www.weforum.org/agenda/2022/06/the-great-resignation-is-not-over/.
[13] Office for Health Improvement and Disparities. 2022. COVID-19 mental health and wellbeing surveillance: report. https://www.gov.uk/government/publications/covid-19-mental-health-and-wellbeing-surveillance-report. See also Mind. 2021. Coronavirus: the consequences for mental health. https://www.mind.org.uk/media/8962/the-consequences-of-coronavirus-for-mental-health-final-report.pdf.
[14] The frequency of the Opinions and Lifestyle Survey was increased to weekly from 20 March 2020; it went down to fortnightly 25 August 2021, after most COVID-19 restrictions had been lifted. For more detail, see ONS. 2022. Opinions and Lifestyle Survey QMI. https://www.ons.gov.uk/peoplepopulationandcommunity/healthandsocialcare/....
[15] ONS. 2022. Public opinions and social trends, Great Britain: 7 to 18 December 2022. https://www.ons.gov.uk/peoplepopulationandcommunity/wellbeing/bulletins/publicopinionsandsocialtrendsgreatbritain/7to18december2022#worries-personal-well-being-and-loneliness.

Lucy Van Essen-Fishman
