Introduction - Destinations of Leavers 2011/12
DLHE population
This product draws on the Destinations of Leavers from Higher Education (DLHE) survey and provides first phase information about patterns of employment and further study or training at a point about six months after completion. The second phase is a follow-up survey on a sample basis approximately three years and six months after completion of a higher education qualification. All subsequent references to DLHE in this volume relate to the first phase.
Following a review of the DLHE survey and consultation with government departments, the higher education (HE) sector and users of the data, the DLHE survey has been re-designed to collect richer information from leavers, particularly regarding their activities on the survey date. Leavers now report all the activities that they are undertaking on the census date and then indicate which one they consider to be most important to them. From these responses, destination categories are derived taking into account the most important activity and, in some instances, other activities the leaver is involved in. Read the changes to the survey document.
Consequently, the DLHE survey has different definitions for the destination categories reported to those in previous years. Direct comparisons should not therefore be made with figures presented in previous years.
The coverage of the survey has been expanded to include additional HE qualifications and now includes non-EU domiciled leavers where it was previously restricted to UK and EU domiciled leavers only. The eligible DLHE population in 2011/12 was 699,330 leavers of which 131,940 were non-EU leavers. Surveying these leavers was undertaken as a pilot for 2011/12 with a clear distinction that the information collected should not be published until carefully reviewed. These leavers are therefore excluded from this publication with the exception of Table A, where aggregate figures are presented for context. Additionally, the destination outcomes of leavers who obtained postgraduate research qualifications from dormant status are considered to be materially different in nature to outcomes of other postgraduate research leavers. They have therefore been excluded from the publication.
The survey covers qualifiers from the 163 UK higher education institutions (HEIs). Of these, 162 were publicly-funded and one, The University of Buckingham, was privately funded. The data capture is undertaken by HEIs but the procedure is prescribed by HESA and, with some degree of detailed flexibility, is uniform across all institutions, regardless of size, nature, and location.
Data from the DLHE return has been linked to the student record collection to allow analysis by student characteristics such as level of qualification, mode of study and subject of study.
Performance against target response rates
In 2011/12, 411,005 UK and other EU domiciled qualifiers provided information about their destinations from a possible 567,390 within the eligible DLHE population. This gives a percentage with known destination of 72.4%. A further 28,290 qualifiers replied to the survey but explicitly declined to give information. Including the explicit refusals, the overall response rate for UK and other EU domiciled qualifiers was 77.4%.
Of the possible 131,940 non-EU domiciled qualifiers, 34,470 qualifiers provided information about their destinations, giving a percentage of 26.1%. All further analysis will only include UK and other EU domiciled qualifiers.
Chart 1 below illustrates the differences in response rates by mode of study and domicile (sourced from Table A). This chart illustrates that full-time qualifiers were more likely to respond than part-time qualifiers and that response rates were higher for UK domiciled qualifiers then for other EU domicile qualifiers.
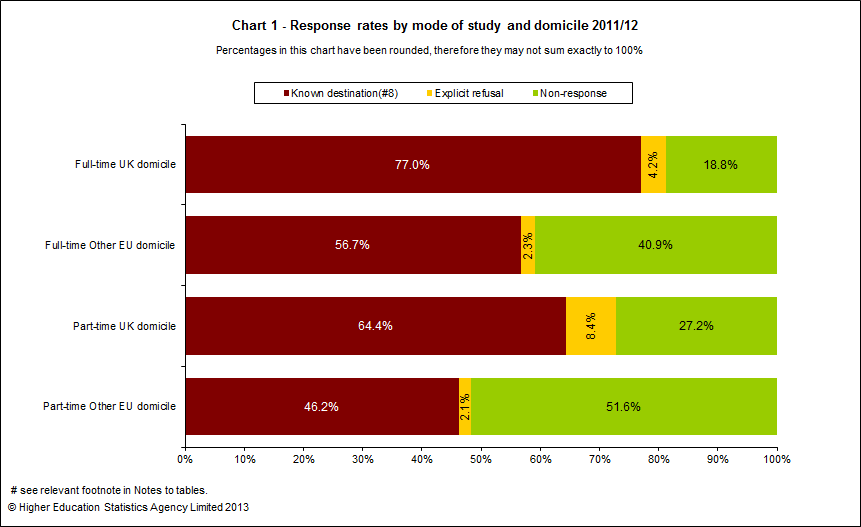
Table A provides the response rates and target rates by mode of study and domicile. It can be seen that for UK domiciled qualifiers, the full-time and part-time response rate achieved the target by margins of 1.2% and 2.8% respectively. For other EU domicile qualifiers, the target rates were lower, and for full-time the responses rate was 9.1% above the target but was below target by 1.6% for part-time.
DLHE response rates vary between institutions, and are dependent in part on the amount of resource committed by an institution to the various stages of the process .
Throughout the remainder of this introduction, qualifiers from within the eligible DLHE population who gave a valid response to the survey are referred to as leavers.
Table B shows both the derived employment activity and the most important activity by level of qualification obtained and mode of study. In the remainder of the publication, the derived employment activity field is used.
Chart 2 below illustrates the breakdown by activity of UK domiciled leavers. (sourced from Table C). The percentage of leavers in full-time work was 55.1%. The percentage in further study was 12.8% and the percentage unemployed was 7.1%.
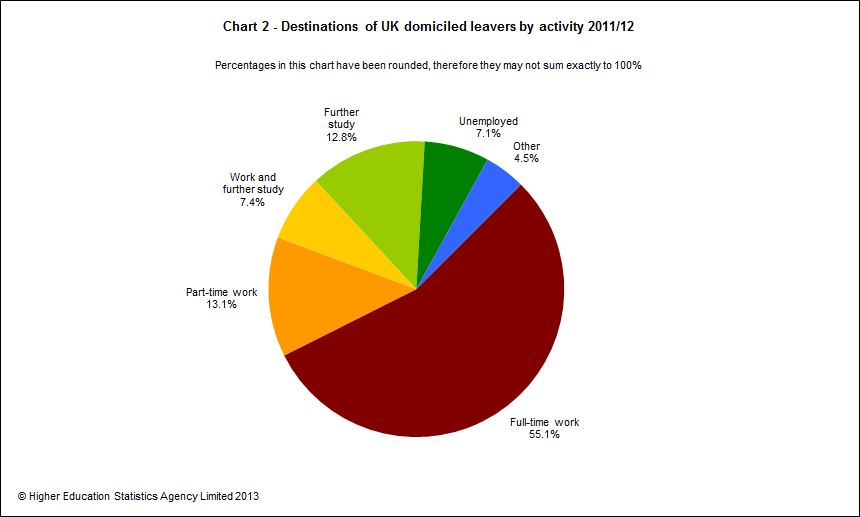
Table C provides a detailed breakdown of the responses to the DLHE survey for UK domiciled leavers by mode of study, level of qualification and gender.
Of the 303,240 full-time UK domiciled leavers, 221,720 (73.1%) reported that they were in either full or part-time work; including those studying as well as working. The number studying, including those working as well as studying, was 62,240 (20.5%). The number unemployed was 24,520 (8.1%).
Of the 82,400 part-time leavers, 69,655 (84.5%) were working, and 2,865 (3.5%) were unemployed. There were 15,750 (19.1%), part-time leavers continuing to study, most of whom combined work with study.
Of all UK domiciled leavers, 75.6% were working; including those studying as well as working, 20.2% were studying; including those working as well as studying and 7.1% were unemployed.
Chart 3 below illustrates the destinations of full-time UK domiciled leavers by level of qualification obtained, gender and activity (sourced from Table C).
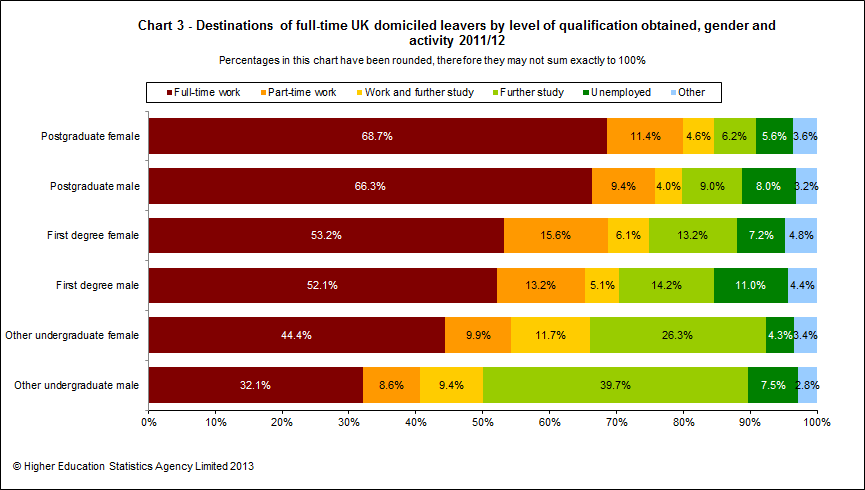
For UK domiciled full-time leavers, the unemployment rate was 6.6% for postgraduates, 8.8% for first degree leavers, and 5.6% for other undergraduates. For UK domiciled part-time leavers, the corresponding figures were 2.5%, 5.8% and 2.9%. For full-time leavers, at all levels of qualification obtained, the proportion of males who were unemployed was higher than females.
Over a third of full-time and part-time other undergraduate leavers were engaged in further study, including those in work and further study, double the proportion of first degree leavers.
Table D provides a breakdown by destination of UK domiciled full-time leavers by level of qualification obtained, gender and age group. Those leavers of unknown age are included in totals but not shown separately.
Almost three-quarters of full-time first degree leavers were in employment compared to less than two-thirds of full-time other undergraduate leavers. Of the other undergraduate leavers, 31.7% were going onto study. 82.6% of full-time postgraduate leavers were in employment.
Younger leavers were more likely to be engaged in further study than older leavers. Overall, for all UK domiciled full-time leavers, 80.6% of leavers who engaged in further study were 24 and under. For first degree leavers this figure was 88.0% and 71.1% for other undergraduates.
Subject of study
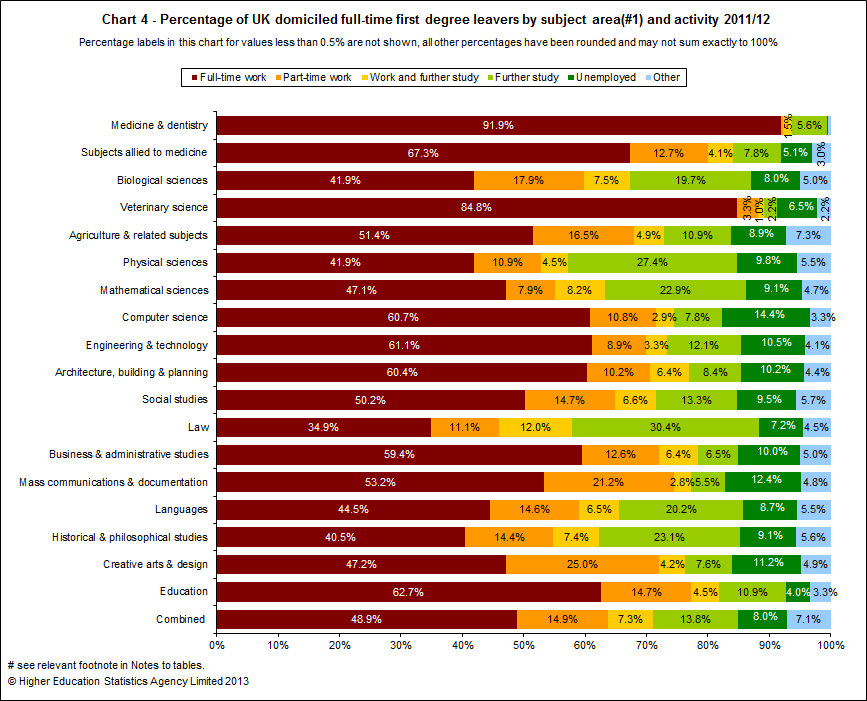
Table E shows the variation in work, study, and unemployment rates between subject areas for UK domiciled full-time first degree leavers. In some cases the outcome could be characteristic of the subject area. For example, over a third of leavers who studied Law (42.3%) were engaged in some kind of further study, which is a common path to qualification in that profession. In contrast, 92.3% of those who studied Medicine & dentistry and 88.1% of those who studied Veterinary science went into employment and a further 1.5% and 1.0% respectively were engaged in work and further study. The figures for Medicine & dentistry should be interpreted in light of the fact that these are quota-controlled subjects. The highest unemployment rate is seen amongst those who studied Computer science, at 14.4%, followed by Mass communication & documentation at 12.4% and Creative arts & design at 11.2%.
Chart 4 below illustrates the variation in activity by subject area for UK domiciled full-time first degree leavers (sourced from Table E).
Occupational Classification
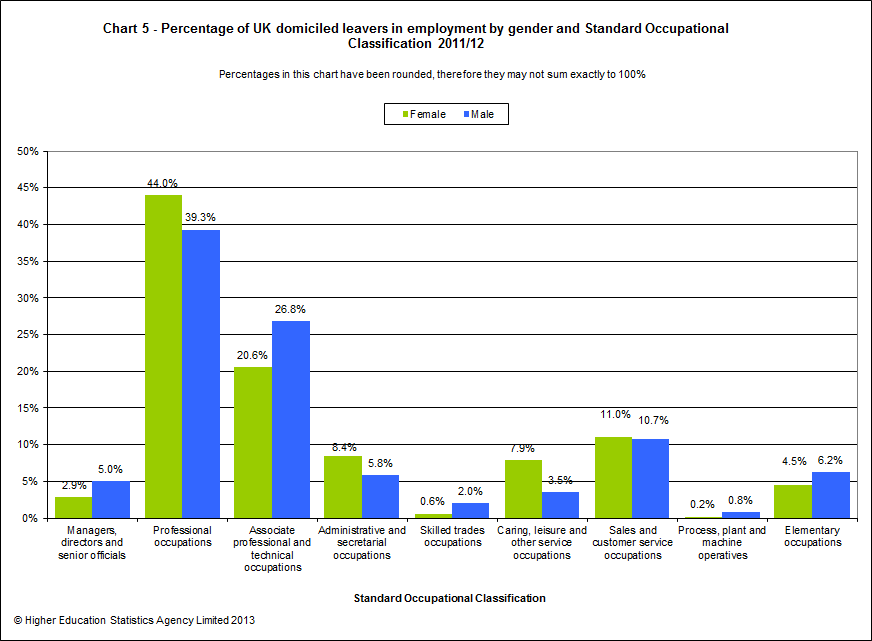
Table F provides figures for UK domiciled full-time leavers in employment, broken down by level of qualification obtained and gender, according to the Standard Occupational Classification of the work they were doing. The Standard Occupational Classification categories are grouped into Professional and Non-professional categories. 88.6% of postgraduate UK domiciled full-time leavers were employed in an occupation within the professional group. Of all UK domiciled full-time leavers, this figure was 68.9%, and 64.0% for UK domiciled full-time first degree leavers. The figure for other undergraduates (68.6%) is higher than that for first degree leavers due to many of these leavers having studied a diploma in nursing or an undergraduate Professional Graduate Certificate in Education which are both grouped in with other undergraduate level qualifications, and both nursing and teaching are classified as professional occupations.
Chart 5 below illustrates the proportions of all UK domiciled leavers in employment, according to the Standard Occupational Classification of their employment, by gender (sourced from Table F).
Basis and location of work
Table G shows the location of employment of UK domiciled leavers in employment by level of qualification, gender and mode of study.
Of all full-time UK domiciled leavers who were in employment, 1.2% were working in other EU countries, and 1.9% outside the EU. For part-time leavers the figures were 0.5% and 1.0% respectively. Of all full-time UK domiciled doctorate leavers who were in employment, 4.0% were working in other EU countries, and 8.3% outside the EU, the corresponding figures for part-time UK domiciled doctorate leavers were 1.9% and 3.1%. Doctorate and higher degree leavers were more likely to work outside the UK & Other EU than other postgraduate, first degree and other undergraduate.
Table H shows the employment basis of UK domiciled full-time leavers in employment.
Of those full-time leavers who were in employment, 56.8% were on a permanent or open-ended contract. 26.4% were on a fixed-term contract, 5.2% were either self-employed/freelance or starting up their own business. Men were more likely than women to be self-employed/freelance. Postgraduate leavers were more likely to be on a fixed-term contract than first degree leavers (31.7% compared to 26.4%), who in turn were much more likely to be in a fixed-term contract than other undergraduate (with just 15.5%). Almost three-quarters of all other undergraduate leavers in employment were on a permanent or open-ended contract.
Region of Employment
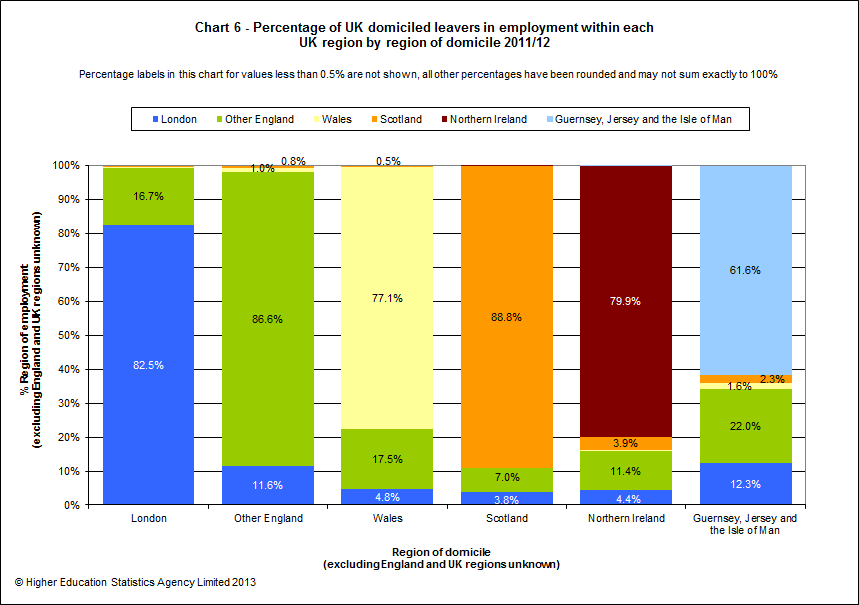
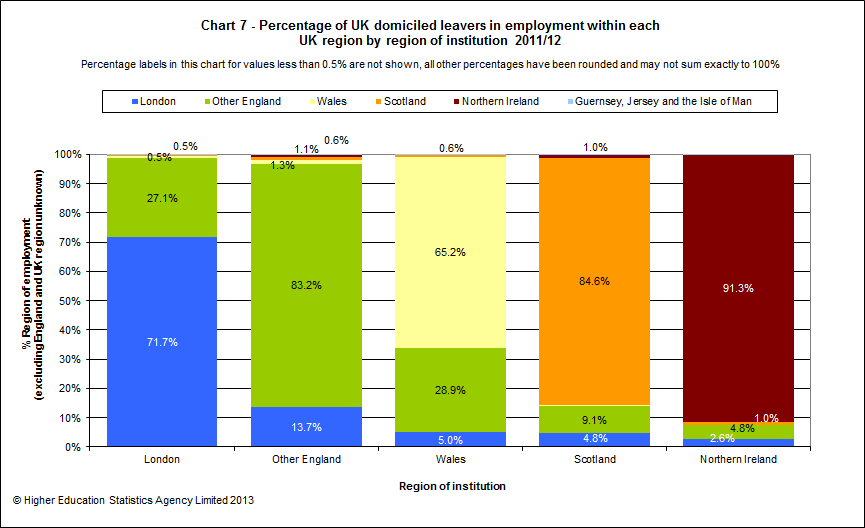
Table I provides a breakdown of region of employment for UK domiciled leavers who entered employment in the UK by region of domicile and region of institution.
The data shows that leavers were most likely to be employed in the same region as their region of domicile or institution. Wales shows the greatest mobility with 22.9% of Wales domiciled leavers moving to another region for their employment. Institutions in Wales also have the greatest proportion (34.8%) of their leavers leaving Wales for employment. Scotland domiciled leavers and leavers who studied in Scotland were the most likely to enter employment in Scotland at 88.8% and 84.6% respectively.
Charts 6 and 7 below show the region of employment patterns for leavers who entered employment by region of domicile and region of institution respectively (sourced from Table I). Apart from Northern Ireland, leavers were more likely to find employment in their region of domicile compared to their region of instsitution.
Type of study
Table J shows the subsequent study patterns of those UK domiciled leavers who continued to study, broken down by mode of study and level of qualification obtained. It includes those who were also working.
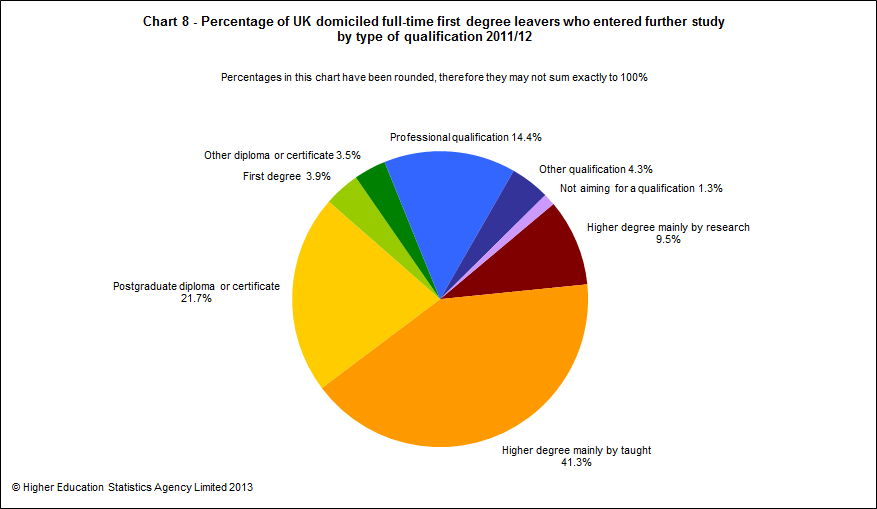
Of the total number of UK domiciled full-time leavers 20.5% proceeded to further study (Table C). Of those, 11.3% moved onto study for a higher degree by research and a further 30.9% studied for a higher degree by taught course.
Of the full-time first degree leavers proceeding to further study, 72.6% went onto a higher level qualification, and 26.1% continued onto an additional first degree or other lower level qualification. Out of the full-time doctorate leavers, 19.7% went onto an additional higher degree mainly by research, and 30.3% onto another postgraduate qualification (including higher degree mainly by taught course). 27.0% of full-time doctorate leavers were aiming for a first degree or lower, while 23.0% were in study but not aiming for a qualification.
Of the total number of UK domiciled full-time other undergraduate leavers, 42.4% proceeded to further study. Of those, 83.6% moved onto first degree studies. For part-time leavers, this was 19.1% and 63.3% respectively.
Chart 8 below illustrates the type of further study of UK domiciled full-time first degree leavers who entered further study (sourced from Table J).
Salary levels
Table K shows the mean, median, upper and lower quartiles of salaries reported (to the nearest £500) by UK domiciled leavers from first degree programmes who entered or continued in full-time UK employment.
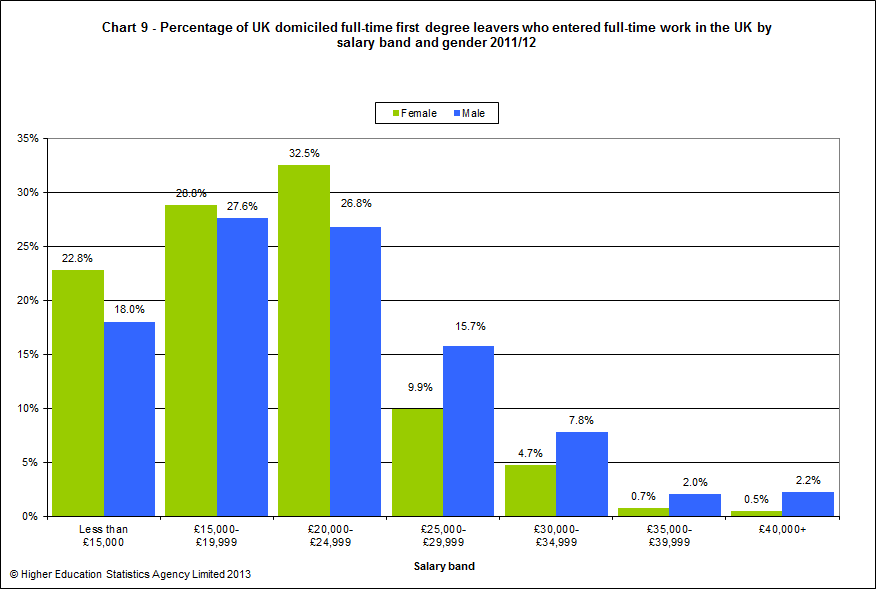
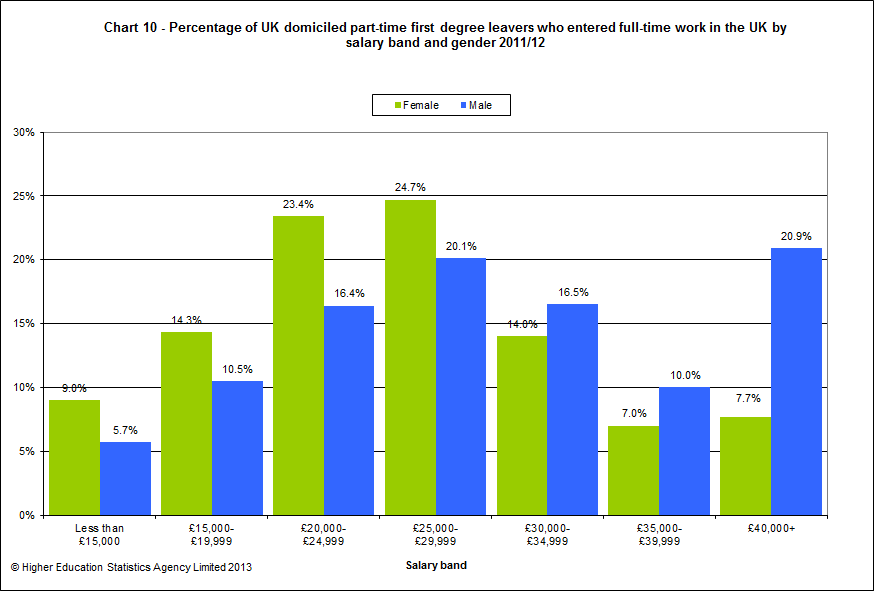
The median salary for female leavers from full-time programmes was slightly lower than that for males at £19,000 compared to £20,000. For part-time leavers, males had a higher median salary, £28,000 against £25,000 for females, and a much larger proportion in the highest category (£40,000 and above): 20.9% of part-time male leavers earned over £40,000 compared to 7.7% of part-time female leavers. Both were much higher than the percentage of full-time leavers in this salary category, 2.2% of males and 0.5% of females.
Charts 9 and 10 below display the salary distribution by £5,000 bands separately for leavers from full-time and part-time programmes who obtained first degree qualifications in full-time paid UK employment, subdivided by gender (sourced from Table K).
Newly qualified teachers
Table L shows the breakdown by mode of study, level of qualification, gender and age group for those achieving Qualified Teacher Status (QTS) (or the equivalent in Scotland), and shows the type of school or college (state-funded/non-state-funded, also known as state/independent) and the level of the school or college in which the respondent was teaching.
Across the UK, 89.3% of those respondents achieving QTS were employed as teachers, and a further 4.8% were seeking a teaching post. Of those known to be in a teaching post and whose type of school or college was known, 88.0% were teaching solely in a state-funded school or college. Of those with a known teaching phase, the percentage teaching only at the primary level was 54.5%, at the secondary level or both levels was 41.2% and 2.4% respectively, and at a college or other educational establishment 1.9%. Of all UK domiciled leavers achieving QTS, the vast majority (95.9%) studied full-time.
© Higher Education Statistics Agency Limited 2013
