Income of higher education institutions £27.6 billion in 2010/11
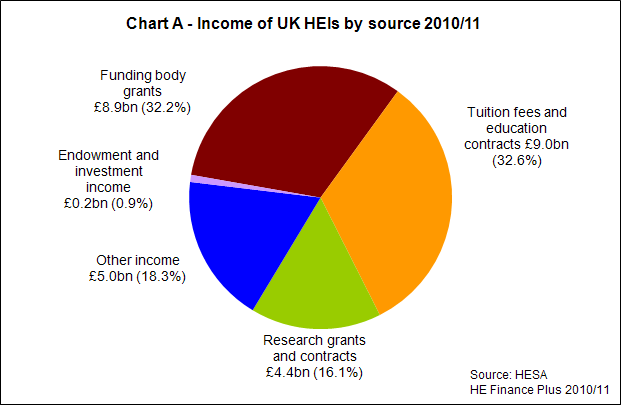
HE Finance Plus 2010/11 shows that the total income of higher education institutions (HEIs) last year was £27.6 billion. Funding bodies provided £8.9 billion of this income, while tuition fees and education contracts contributed £9.0 billion.
Chart A below shows the proportions of total income of UK higher education institutions by source in 2010/11:
The different sources are further broken down in Table 1 below. The recurrent teaching and research grants account for most of the funding body income at £5.7 billion and £2.0 billion respectively.
Income from home and EU domicile students’ course fees was £5.4 billion – 19.6% of the total income for UK HEIs. Non-EU students’ course fees totalled £2.9 billion in 2010/11 accounting for 10.7% of total income.
The Research Councils, The Royal Society, British Academy and The Royal Society of Edinburgh together contributed the largest portion of research grant and contract income. Research grants and contracts from non-UK sources contributed £804 million (2.9%) to the total income of UK HEIs.
Residences and catering operations added a further £1.6 billion to the income of HEIs while investment and endowment income added a further £241 million.
| Table 1. Sources of income for UK HEIs 2010/11 (£thousands) | ||||
|---|---|---|---|---|
| Source | Income | % of total income | ||
| Funding body grants | 8,877,801 | 32.2% | ||
| Recurrent (teaching) | 5,698,769 | 20.7% | ||
| Recurrent (research) | 1,952,309 | 7.1% | ||
| Recurrent - other (including special funding) | 740,787 | 2.7% | ||
| Release of deferred capital grants - buildings | 258,535 | 0.9% | ||
| Release of deferred capital grants - equipment | 144,517 | 0.5% | ||
| Grants for FE provision (not applicable to SFC) | 82,884 | 0.3% | ||
| Tuition fees and education contracts | 8,975,819 | 32.6% | ||
| Home and EU domicile students course fees | 5,401,635 | 19.6% | ||
| Non-EU domicile students course fees | 2,944,968 | 10.7% | ||
| Non-credit-bearing course fees | 407,427 | 1.5% | ||
| FE course fees | 50,170 | 0.2% | ||
| Research training support grants | 171,619 | 0.6% | ||
| Research grants and contracts | 4,432,394 | 16.1% | ||
| BIS Research Councils, The Royal Society, British Academy and The Royal Society of Edinburgh | 1,558,201 | 5.7% | ||
| UK-based charities | 920,779 | 3.3% | ||
| UK central government bodies/local authorities, health and hospital authorities | 807,935 | 2.9% | ||
| UK industry, commerce and public corporations | 293,938 | 1.1% | ||
| EU Sources | 513,016 | 1.9% | ||
| Non-EU sources | 291,098 | 1.1% | ||
| Other sources | 47,427 | 0.2% | ||
| Other income | 5,034,898 | 18.3% | ||
| Other services rendered | 1,620,093 | 5.9% | ||
| Residences and catering operations (including conferences) | 1,563,920 | 5.7% | ||
| Grants from local authorities | 9,023 | 0.0% | ||
| Income from health and hospital authorities (excluding teaching contracts for student provision) | 371,456 | 1.3% | ||
| Release of deferred capital grants | 110,958 | 0.4% | ||
| Income from intellectual property rights | 51,624 | 0.2% | ||
| Other operating income | 1,307,824 | 4.7% | ||
| Endowment and investment income | 240,627 | 0.9% | ||
| Total income* | 27,561,539 | 100.0% | ||
| Source: HESA HE Finance Plus 2010/11 | ||||
| * Includes income from joint ventures. | ||||
Table 2 shows the changes in income from the major sources from the previous year. Tuition fee income increased by 8.3% while income from funding body grants fell by 1.8%.
| Table 2. Sources of income for UK HEIs 2009/10 and 2010/11 (£thousands) | |||
|---|---|---|---|
| 2009/10 | 2010/11 | % change | |
| Funding body grants | 9,043,793 | 8,877,801 | -1.8% |
| Tuition fees and education contracts | 8,287,779 | 8,975,819 | 8.3% |
| Research grants and contracts | 4,346,357 | 4,432,394 | 2.0% |
| Other income | 4,905,878 | 5,034,898 | 2.6% |
| Endowment and investment income | 215,087 | 240,627 | 11.9% |
| Total Income* | 26,798,894 | 27,561,539 | 2.8% |
| Source: HESA HE Finance Plus 2010/11 | |||
| * Includes income from joint ventures. | |||
Expenditure £26.2 billion
Total expenditure of UK HEIs in 2010/11 was £26.2 billion. Staff costs contributed £14.7 billion towards this total. Chart B below shows the total expenditure of UK higher education institutions by type in 2010/11:

Table 3 shows the changes in expenditure for the major types from the previous year. While overall expenditure increased by 1.5%, expenditure on staff costs only increased by approximately half that rate (0.7%)
| Table 3. Expenditure by type for UK HEIs 2009/10 and 2010/11 (£thousands) | |||
|---|---|---|---|
| 2009/10 | 2010/11 | % change | |
| Staff costs | 14,633,889 | 14,730,242 | 0.7% |
| Other operating expenses | 9,362,419 | 9,651,373 | 3.1% |
| Depreciation | 1,396,363 | 1,478,453 | 5.9% |
| Interest and other finance costs | 453,249 | 372,791 | -17.8% |
| Total Expenditure | 25,845,920 | 26,232,859 | 1.5% |
| Source: HESA HE Finance Plus 2010/11 | |||
HE Finance Plus 2010/11
HE Finance Plus 2010/11 includes finance data broken down to institutional level including tuition fees and education contracts, balance sheets, cash flow, capital expenditure, financial profiles and more. HE Finance Plus 2010/11 is available to purchase and instantly download from our site.
The related HESA product, Finances of Higher Education Institutions, containing a subset of the HESA finance collection will be published in May. Results of the 2010/11 HE Business and Community Interaction Survey will be also be published in May. A full schedule of all HESA releases for 2012 can be found here.
Notes for editors
- Press enquiries should be directed to:
- Simon Kemp
- HESA Press Officer
- 01242 211120
- [email protected]
- 95 Promenade, Cheltenham, GL50 1HZ.
- Data in the tables represent cash figures and are not adjusted for inflation.
- Values in Charts A and B are shown rounded to the nearest £0.1 billion. The sum of these values may not match the total values given in the text. Percentages in all Tables and Charts are shown rounded to one decimal place and may not sum to 100%.
- HESA Finance data is collected from all publicly funded Higher Education Institutions (HEIs) in the UK, plus the University of Buckingham, which is a non-publicly-funded institution. The 2010/11 data covers 164 HEIs (130 in England, 11 in Wales, 19 in Scotland and 4 in Northern Ireland).
- Where comparisons are made between the latest financial year (2010/11) and the previous year (2009/10), the previous year’s figures are those reported in the re-stated financial statements.
- The data in this release relates to all UK HE institutions. Figures for the individual nations of the UK are available in the Annex below: England; Wales; Scotland; Northern Ireland; Non-EU domicile students' course fees
- An equivalent press release for 2009/10 was published in 2011 here
- HESA cannot accept responsibility for any inferences or conclusions derived from the data by third parties.
- Definitions of the terms used in this press release can be found on our site.
Annex - equivalent tables for England, Wales, Scotland and Northern Ireland
England
| Sources of income for HEIs in England 2009/10 and 2010/11 (£thousands) | |||
|---|---|---|---|
| 2009/10 | 2010/11 | % change | |
| Funding body grants | 7,280,195 | 7,204,728 | -1.0% |
| Tuition fees and education contracts | 7,157,716 | 7,759,318 | 8.4% |
| Research grants and contracts | 3,498,886 | 3,565,156 | 1.9% |
| Other income | 4,124,168 | 4,224,043 | 2.4% |
| Endowment and investment income | 176,455 | 195,697 | 10.9% |
| Total Income* | 22,237,420 | 22,948,942 | 3.2% |
| Source: HESA HE Finance Plus 2010/11 | |||
| * Includes income from joint ventures. | |||
| Expenditure by type for HEIs in England 2009/10 and 2010/11 (£thousands) | |||
|---|---|---|---|
| 2009/10 | 2010/11 | % change | |
| Staff costs | 1,2069,249 | 12,153,922 | 0.7% |
| Other operating expenses | 7,775,225 | 8,045,072 | 3.5% |
| Depreciation | 1,167,490 | 1,236,904 | 5.9% |
| Interest and other finance costs | 399,291 | 333,548 | -16.5% |
| Total Expenditure | 21,411,255 | 21,769,446 | 1.7% |
| Source: HESA HE Finance Plus 2010/11 | |||
Wales
| Sources of income for HEIs in Wales 2009/10 and 2010/11 (£thousands) | |||
|---|---|---|---|
| 2009/10 | 2010/11 | % change | |
| Funding body grants | 453,895 | 415,676 | -8.4% |
| Tuition fees and education contracts | 378,958 | 409,620 | 8.1% |
| Research grants and contracts | 155,641 | 164,500 | 5.7% |
| Other income | 241,262 | 246,086 | 2.0% |
| Endowment and investment income | 6,622 | 8,100 | 22.3% |
| Total Income* | 1,236,378 | 1,243,982 | 0.6% |
| Source: HESA HE Finance Plus 2010/11 | |||
| * Includes income from joint ventures. | |||
| Expenditure by type for HEIs in Wales 2009/10 and 2010/11 (£thousands) | |||
|---|---|---|---|
| 2009/10 | 2010/11 | % change | |
| Staff costs | 709,107 | 712,252 | 0.4% |
| Other operating expenses | 418,219 | 431,077 | 3.1% |
| Depreciation | 53,357 | 54,811 | 2.7% |
| Interest and other finance costs | 19,565 | 13,546 | -30.8% |
| Total Expenditure | 1,200,248 | 1,211,686 | 1.0% |
| Source: HESA HE Finance Plus 2010/11 | |||
Scotland
| Sources of income for HEIs in Scotland 2009/10 and 2010/11 (£thousands) | |||
|---|---|---|---|
| 2009/10 | 2010/11 | % change | |
| Funding body grants | 1,100,161 | 1,065,029 | -3.2% |
| Tuition fees and education contracts | 627,808 | 678,842 | 8.1% |
| Research grants and contracts | 600,574 | 613,404 | 2.1% |
| Other income | 449,822 | 474,220 | 5.4% |
| Endowment and investment income | 25,771 | 29,286 | 13.6% |
| Total Income* | 2,804,136 | 2,860,781 | 2.0% |
| Source: HESA HE Finance Plus 2010/11 | |||
| * Includes income from joint ventures. | |||
| Expenditure by type for HEIs in Scotland 2009/10 and 2010/11 (£thousands) | |||
|---|---|---|---|
| 2009/10 | 2010/11 | % change | |
| Staff costs | 1,559,783 | 1,571,204 | 0.7% |
| Other operating expenses | 1,002,117 | 999,971 | -0.2% |
| Depreciation | 148,582 | 159,124 | 7.1% |
| Interest and other finance costs | 25,299 | 21,179 | -16.3% |
| Total Expenditure | 2,735,781 | 2,751,478 | 0.6% |
| Source: HESA HE Finance Plus 2010/11 | |||
Northern Ireland
| Sources of income for HEIs in Northern Ireland 2009/10 and 2010/11 (£thousands) | |||
|---|---|---|---|
| 2009/10 | 2010/11 | % change | |
| Funding body grants | 209,542 | 192,368 | -8.2% |
| Tuition fees and education contracts | 123,297 | 128,039 | 3.8% |
| Research grants and contracts | 91,256 | 89,334 | -2.1% |
| Other income | 90,626 | 90,549 | -0.1% |
| Endowment and investment income | 6,239 | 7,544 | 20.9% |
| Total Income* | 520,960 | 507,834 | -2.5% |
| Source: HESA HE Finance Plus 2010/11 | |||
| * Includes income from joint ventures. | |||
| Expenditure by type for HEIs in Northern Ireland 2009/10 and 2010/11 (£thousands) | |||
|---|---|---|---|
| 2009/10 | 2010/11 | % change | |
| Staff costs | 295,750 | 292,864 | -1.0% |
| Other operating expenses | 166,858 | 175,253 | 5.0% |
| Depreciation | 26,934 | 27,614 | 2.5% |
| Interest and other finance costs | 9,094 | 4,518 | -50.3% |
| Total Expenditure | 498,636 | 500,249 | 0.3% |
| Source: HESA HE Finance Plus 2010/11 | |||
Non-EU domicile students’ course fees
| Income from non-EU domicile students course fees by location of institution 2010/11 (£thousands) | |||
|---|---|---|---|
| Location of institution | Non-EU domicile students course fees | % of total income | |
| England | 2,520,018 | 11.0% | |
| Wales | 107,172 | 8.6% | |
| Scotland | 305,499 | 10.7% | |
| Northern Ireland | 12,279 | 2.4% | |
| United Kingdom | 2,944,968 | 10.7% | |
| Source: HESA HE Finance Plus 2010/11 | |||