Higher education student enrolments and qualifications obtained at higher education institutions in the United Kingdom for the academic year 2013/14
Introduction
This Statistical First Release (SFR) has been produced by the Higher Education Statistics Agency (HESA) in collaboration with statisticians from the UK Department for Business, Innovation and Skills (BIS), the Welsh Government (WG), the Scottish Government (SG) and the Department for Employment and Learning Northern Ireland (DEL(NI)). It has been released according to the arrangements approved by the UK Statistics Authority. It provides details of student enrolments and qualifications obtained by higher education (HE) students at HE providers (HEPs) in the United Kingdom (UK) for the academic year 2013/14. From 2012/13 the HESA constituency includes all UK publicly funded higher education institutions (HEIs) and a number of alternative providers (APs), collectively referred to as higher education providers (HEPs). This SFR, as in previous years, contains information regarding only the HEI element of this constituency and the University of Buckingham and therefore uses the term ‘higher education providers (HEPs)’. This SFR also includes summary statistics about study at higher education level in further education colleges, and it therefore presents figures illustrating the totality of higher education provision in publicly-funded providers in the UK. This SFR also includes information from the HESA Aggregate offshore record. This record captures students studying wholly outside the UK who are either registered with the reporting HE provider or who are studying for an award of the reporting HE provider.
Readers should be aware that data definitions sometimes change over time and this can affect the validity of time series comparisons. Any significant changes have been explained in the Notes to Tables and/or Definitions.
Please note, key points have been derived from the Excel tables (these can be found below). Comparisons with previous year's data have only been included where they can be derived from these tables.
A notable change in this release is the allocation of Open University (OU) students to England, Wales, Scotland and Northern Ireland. Previously all OU enrolments and qualifications were counted within England, where the OU has its administrative centre. From this release onwards enrolments and qualifications registered at one of the OU’s national centres in Wales, Scotland and Northern Ireland will contribute to the totals of those countries where statistics are shown by country of HE provider. Please note that all non-UK domicile OU students, those who study at postgraduate research level, and students returned in the Aggregate offshore record, are registered to the OU administrative centre in England. To provide a comparable time series, all tables, charts and commentary within this release have been produced using the new allocation method. For this year only, parallel tables using the old allocation method are provided here.
A statistical reference volume ‘Students in Higher Education 2013/14' providing more detailed information about students in higher education in the UK will be published by HESA in February 2015.
Key points - enrolments (all UK HEPs)
The total number of HE enrolments at UK HEPs stood at 2,299,355 in 2013/14, a decrease of 2%, 40,920 in overall numbers, from 2012/13. This overall decrease is mainly due to a decline in undergraduate enrolments which fell by 2% and part-time enrolments which decreased by 8% between 2012/13 and 2013/14. Postgraduate enrolments increased by 1% between 2012/13 and 2013/14 and full-time enrolments also increased by 1% over the same period (see Table 1 and Chart 1). There were a further 189,040 HE enrolments at further education colleges in 2013/14 compared to 186,565 in 2012/13. These data are presented in Table 1b disaggregated by mode and level of study. All further figures presented in this SFR exclude HE enrolments at further education colleges.
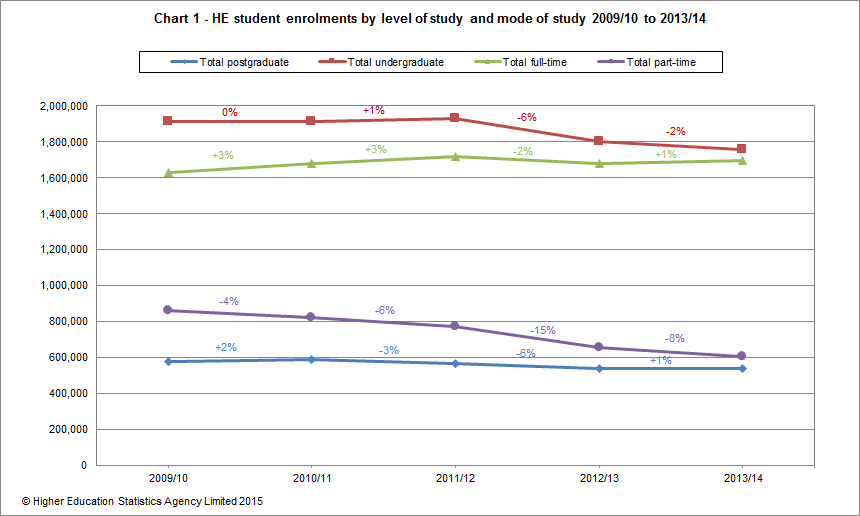
Over the time series shown in this SFR the overall number enrolled on HE courses was at its highest at 2,501,295 enrolments in 2010/11 and has decreased every year since (Ref. Table 1). Between 2012/13 and 2013/14 there was a decrease of 2%, this was not as sharp as the 6% decrease in enrolments observed in the previous academic year which coincided with changes in tuition fee arrangements. The total number of first year enrolments was at its lowest during the 5 year period shown, at 971,410 in 2012/13 which then increased by 3% to 995,740 in 2013/14 (Ref. Table 2).
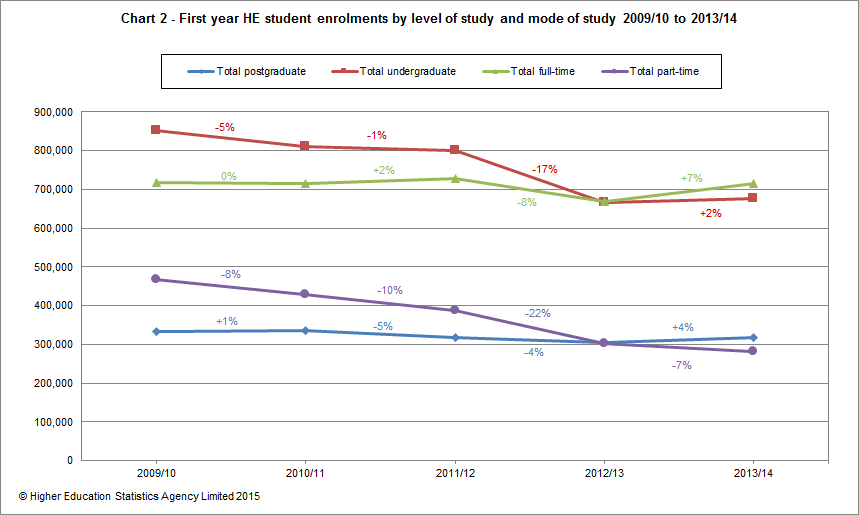
In 2013/14, the total number of postgraduate enrolments stood at 539,440, 318,135 were first years. An increase of 1% was observed in all postgraduates between 2012/13 and 2013/14, while first year postgraduate enrolments increased by 4% during this period. Total undergraduate enrolments reached a high in 2011/12 before decreasing by 6% in 2012/13 and a further 2% in 2013/14. First year undergraduate enrolments increased for the first time in 5 years between 2012/13 and 2013/14 (an increase of 2%), although overall numbers remain lower than the peak in 2009/10. (Ref. Table 1, Table 2, Chart 1 and Chart 2).
1,696,030 of all enrolments were full-time, an increase in numbers of 1% since 2012/13 after decreasing for the first time in that year. The number of full-time first year enrolments showed a similar trend increasing by 7% between 2012/13 and 2013/14 after decreasing the between 2011/12 and 2012/13. 603,325 enrolments were part-time showing a decrease of 8% since 2012/13 and continuing the decreasing trend in part-time numbers over the time series shown. A similar pattern was observed for part-time first year enrolments over the same time series, decreasing by 7% between 2012/13 and 2013/14. The continuing decline in part-time enrolments compared to full-time enrolments further reduced the proportions studying part-time. In 2012/13, 28% of all enrolments were part-time compared to 26% in 2013/14 and this trend is more apparent in part-time first year enrolments where 31% of first year enrolments were part-time in 2012/13 compared to 28% in 2013/14. (Ref. Table 1, Table 2, Chart 1 and Chart 2).
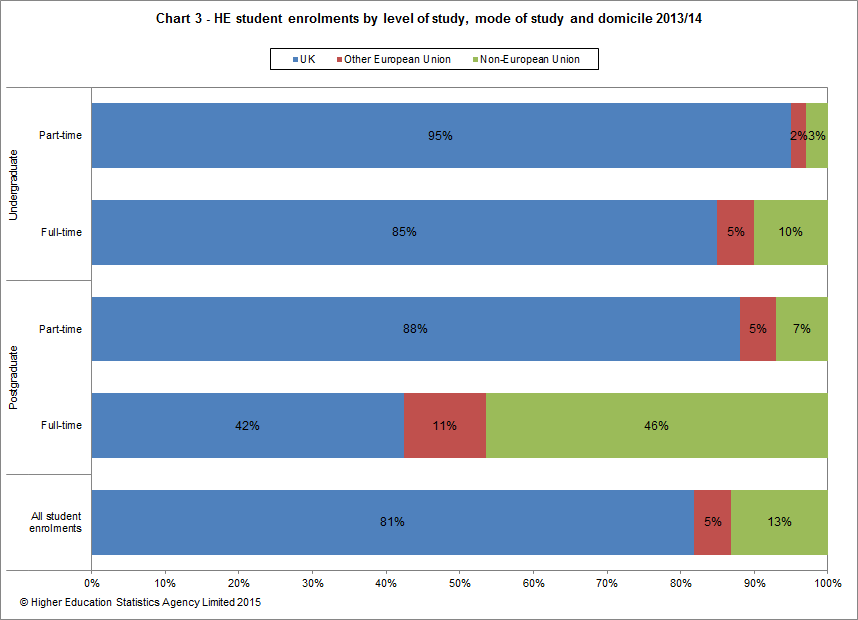
In 2013/14 UK domiciled students accounted for 81% of all enrolments at UK HEPs (82% in 2012/13), 5% were other European Union (EU) domiciled (the same as in 2012/13) and the remaining 13% came from countries outside the EU (13% in 2012/13). The overall number of student enrolments from outside the EU increased by 3% from 2012/13 (from 299,970 to 310,195). The number of other EU domiciled students showed no percentage change between 2012/13 and 2013/14 (from 125,290 to 125,300). Over the same period, the number of UK domiciled students decreased by 3% (from 1,915,015 to 1,863,860). (Ref. Table 1). It should be noted that from 2013/14, European Union domiciled students includes Croatia which joined the European Union on 1 July 2013. For academic years prior to 2013/14, students domiciled from Croatia are included in the Non-European Union totals, refer to the domicile definitions for further detail.
Proportions of students from outside the UK varied by both level and mode of study in 2013/14. UK domiciled students made up the majority of enrolments for all modes and levels of study with the exception of full-time postgraduates, where 46% were non-EU domiciled (46% in 2012/13) (Ref. Chart 3).
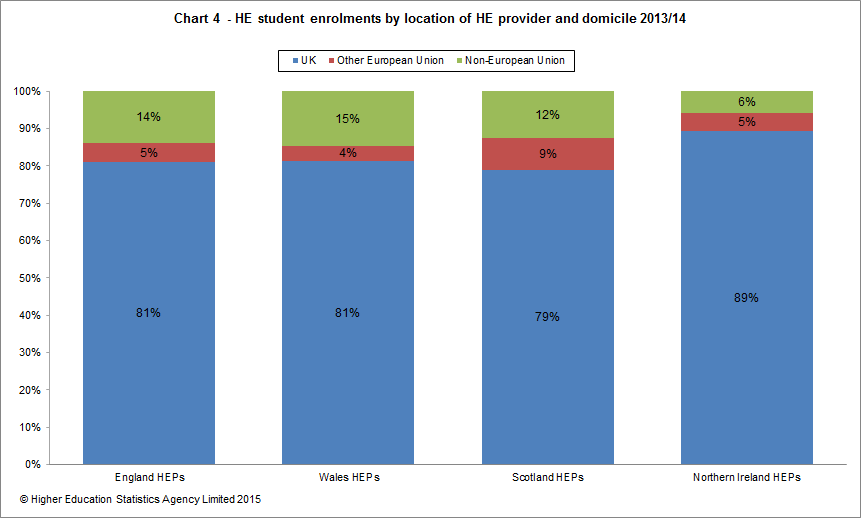
Proportions of students from outside the UK also varied across the four administrations. HE providers in Wales had the greatest proportion of non-EU domiciled students at 15%, while providers in Scotland had the greatest proportion of other EU domiciled students at 9%. At HEPs in England, 14% of all enrolments were non-EU domiciled, compared to 13% in 2012/13. This increase in share was due to an increase of 4% in the number of non-EU enrolments coinciding with the number of UK enrolments reducing by 3%. Scotland and Wales both had an overall increase in the number of other EU domiciled enrolments, increasing by 6% and 2% respectively from 2012/13. Northern Ireland was the only country to experience an increase in overall UK numbers, increasing by 1% from 2012/13. (Ref. Chart 4 and Ref. Table 1).
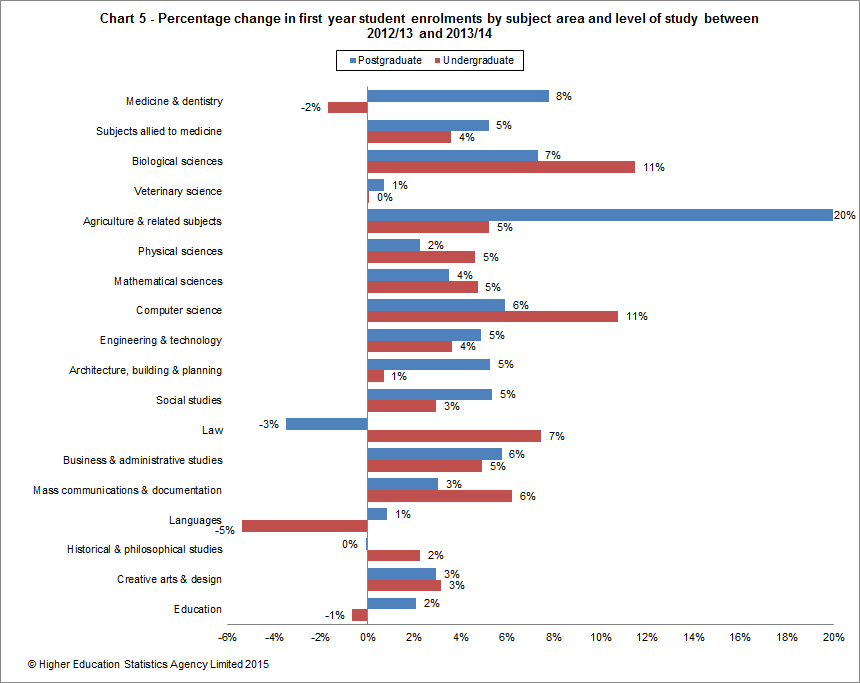
For 2012/13 a revised coding of subject area was introduced with JACS3 replacing JACS2. Further detail about the change is described in the definitions. It should be noted that while the 19 subject areas are comparable across these two versions of JACS, some providers have taken the opportunity to reclassify some courses with the introduction of JACS3.
The 1% increase in full-time enrolments was also observed in science subjects which increased by 1% in 2013/14. The proportion studying science subjects in 2013/14 was 45% for all full-time enrolments (44% in 2012/13). Amongst full-time first year enrolments there was an increase of 8% over the same time period. 42% of part-time enrolments in 2013/14 were in science subjects compared to 40% in 2012/13; while this shows an increase in the overall percentage in science subjects, the number of part-time enrolments in science subjects decreased by 5% between 2012/13 and 2013/14. Similarly for part-time first year enrolments, the proportion studying science subjects increased from 41% in 2012/13 to 44% in 2013/14. This change in proportion can be attributed to an overall decrease in part-time first year enrolments which fell by 7% while the numbers of these studying science showed no percentage change. (Ref. Table 4 and Table 4a).
The greatest percentage increase in first year postgraduate student enrolments between 2012/13 and 2013/14 was observed in Agriculture & related subjects (20%). The only percentage decrease in first year postgraduate numbers was observed in Law (3%). For first year undergraduate enrolments the greatest percentage increases were observed in Biological sciences and Computer science (both 11%), while undergraduate first year enrolments in Languages decreased by 5% (Ref. Table 4 and Chart 5).
Table 6a and Table 6b are new tables for this SFR which include data on the sex, age, disability status and ethnicity of full-time and part-time enrolments by level of study and subject area. 50% of all full-time student enrolments were aged 20 and under compared to 5% for part-time enrolments. For full-time enrolments the age profile differed by level of study, 61% of full-time undergraduates were aged 20 and under compared to 1% for full-time postgraduates and 50% of full-time postgraduates were aged 21 to 24. The majority of part-time enrolments were aged 30 and over (64%), for undergraduates this was 59% and for postgraduates 71%. The disability status was similar amongst full-time and part-time enrolments with 10% of both groups known to have a disability. Of the UK domiciled full-time enrolments with known ethnicity 78% were white compared to 84% of UK domiciled part-time enrolments. (Ref. Table 6a and Table 6b).
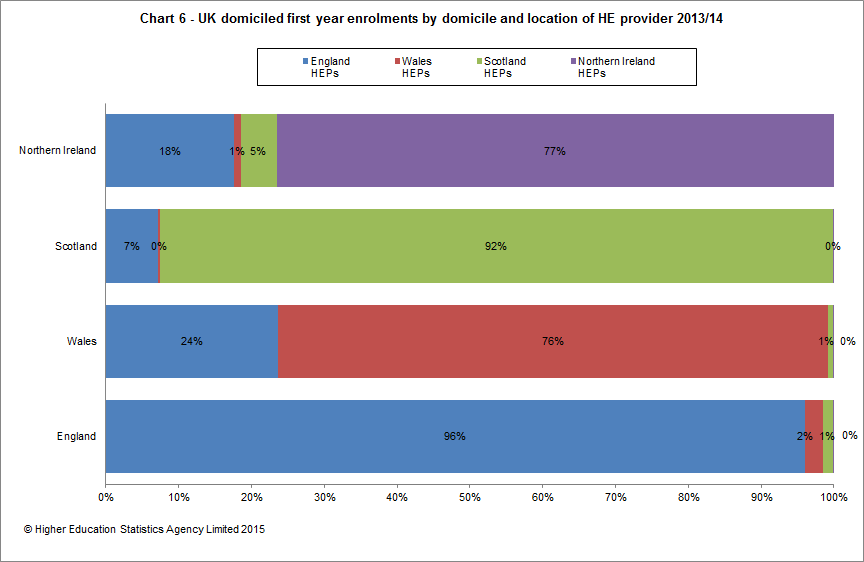
Chart 6 shows the cross border flows of UK domiciled first year enrolments by the country of domicile and country of provider (excluding those studying at The Open University). Across all regions the majority of students stay in their home country, although those domiciled from Wales and Northern Ireland were more likely to cross borders than those from England and Scotland. 24% of first year students from Wales were enrolled at HEPs in England. 5% of first year students from Northern Ireland were enrolled at HEPs in Scotland.
Tables Table 8, Table 8a, Table 9 and Table 9a) show the top 10 countries of domicile for other EU and non-EU domiciled student enrolments and first year enrolments. Across all UK HEPs the largest number of students from non-EU countries were domiciled from China with a 5% increase from 2012/13, India was second largest in the list of non-EU countries although they observed a 12% reduction in numbers since 2012/13. For first year student enrolments, there was a 4% increase in the number of students from non-EU countries, the largest number were from China which increased by 4% from 2012/13 while the largest percentage increase was observed from Malaysia which increased by 13%. Among other EU countries the largest number came from Germany and then France although there was a 3% decrease in numbers from Germany since 2012/13 and 2% decrease in numbers from France. For first year student enrolments, there was a 2% increase in the number of students from other EU countries. The largest number of first year students came from Germany even though they experienced a 3% decrease since 2012/13. There was an increase in the numbers coming from Italy (20%) and Poland (10%). (Ref. Table 8, Table 8a, Table 9 and Table 9a).
Table 10 analyses student enrolments at The Open University which accounts for 7% of all enrolments in 2013/14. Table 10 shows the country of the national centre where each Open University student is registered. As a percentage of all part-time enrolments in Wales, 19% studied at The Open University compared to 26% of all part-time enrolments in England. It should be noted that all non-UK domiciled students and those studying at postgraduate research level are registered at the England campus. (Ref. Table 10).
Key points - qualifications obtained (all UK HEPs)
In 2013/14, there were 777,800 HE qualifications obtained in the UK compared to 787,900 in 2012/13. Of these, 421,850 were at first degree level, compared to 403,770 in 2012/13, an increase of 4%. (Ref. Table 11).
Chart 7 illustrates the distribution of qualifications obtained in 2013/14.
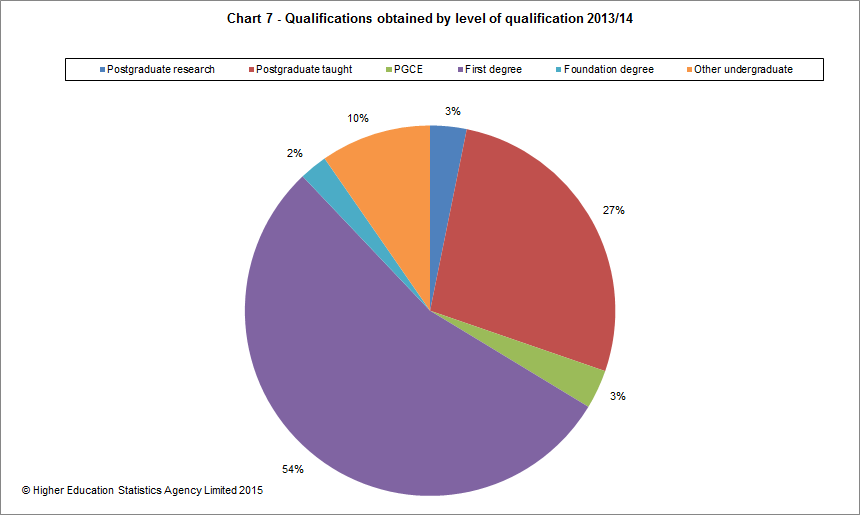
First degree qualifications accounted for 54% of all HE qualifications obtained in 2013/14 and other undergraduate qualifications (including foundation degrees and excluding undergraduate PGCE) accounted for 12%. (Ref. Table 11 and Chart 7).
Postgraduate qualifications (excluding postgraduate PGCE) accounted for 30% and PGCE qualifications (at postgraduate and undergraduate level) accounted for the remaining 3%. (Ref. Table 11 and Chart 7).
Chart 8 shows the time series trend in qualifications obtained between 2009/10 and 2013/14 by level of qualification obtained.
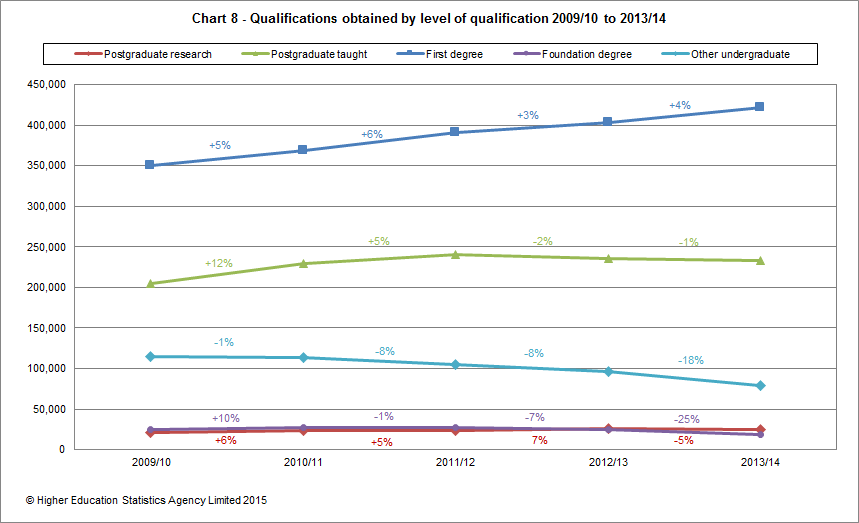
Over the time series shown in this SFR, the total number of qualifications gained has shown an overall increase in numbers between 2009/10 and 2012/13 before decreasing slightly (1%) in 2013/14. First degree qualifications were the only level of qualification which continued to increase in 2013/14, while all other levels decreased. This is likely to be attributed to the peak in first year first degree enrolments in 2011/12, many of whom will have completed their qualifications in 2013/14 (Ref. Table 2, Table 11 and Chart 8).
Postgraduate taught qualifications observed another slight decrease (1%) in 2013/14 after steadily increasing each year since 2009/10. (Ref. Table 11 and Chart 8).
Of those gaining a classified first degree, the proportion who obtained a first or upper second has shown a steady increase from 63% in 2009/10 to 70% in 2013/14. (Ref. Table 12).
Chart 9 shows the percentage distribution of first degree classifications by mode and sex in 2013/14.
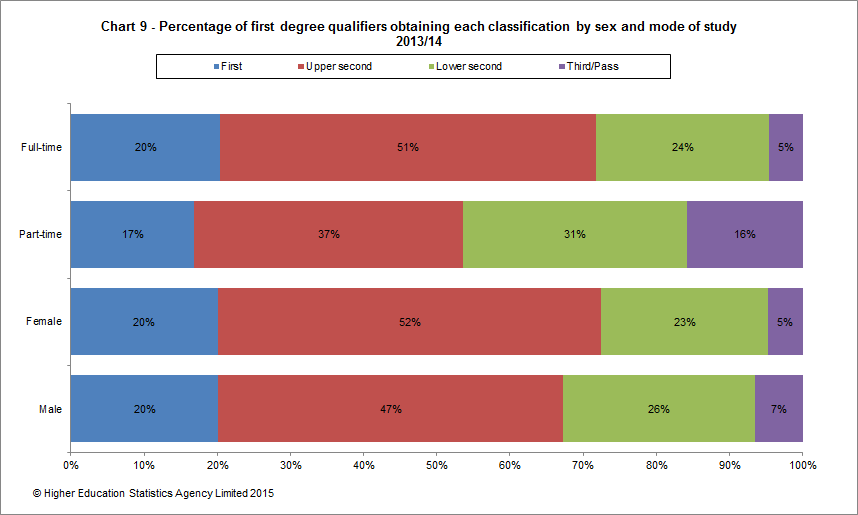
72% of first degrees undertaken through full-time study in 2013/14 achieved first or upper second classifications compared to 54% of those undertaken through part-time study. (Ref Table 12 and Chart 9).
72% of first degree qualifications achieved by females in 2013/14 were at first or upper second level compared to 67% of those achieved by males. (Ref Table 12 and Chart 9).
In 2013/14, 40% of qualifications obtained were in science subjects, the same proportion as 2012/13 although there has been decrease in actual numbers. In 2013/14, 36% of qualifications achieved by women were in science subjects compared to 45% for men, these have showed little change over the 5 year time series shown (Ref. Table 13).
Key points - students studying wholly overseas (all UK HEPs)
In 2013/14, there were 636,675 students studying wholly overseas compared to 598,485 in 2012/13, an increase of 6%, although earlier years of this time series should be interpreted with caution (refer to definitions) (Ref. Table 14). It should also be noted that students registered at Oxford Brookes University accounted for 43% of the total population of the 2013/14 Aggregate offshore record (44% in 2012/13, 44% in 2011/12, 48% in 2010/11 and 40% in 2009/10). The majority of these students were registered with an overseas partner on Association of Chartered Certified Accountants (ACCA) programmes.
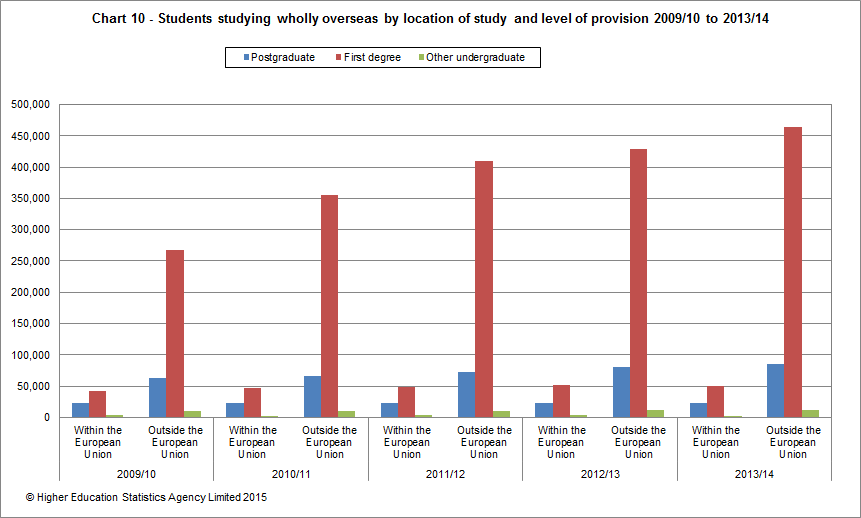
Of those students studying wholly overseas in 2013/14, 12% were studying within the EU and 88% were studying outside the EU, compared to 13% and 87% in 2012/13. (Ref. Table 14 and Chart 10). It should be noted that from 2013/14, European Union domiciled students includes Croatia which joined the European Union on 1 July 2013. For academic years prior to 2013/14, students domiciled from Croatia are included in the Non-European Union totals.
Chart 10 shows the number of students who were studying wholly overseas between 2009/10 to 2013/14 by level of provision and location of study.
Key points - enrolments (England only)
The total number of HE enrolments at HEPs in England stood at 1,875,020 in 2013/14, showing a decrease of 2% from 2012/13. Postgraduate enrolments showed no percentage change and undergraduate enrolments decreased by 3% between 2012/13 and 2013/14. (Ref. Table 1a).
Between 2012/13 and 2013/14, the number of enrolments of UK domiciled students decreased by 3% from 1,568,105 to 1,519,440. The number of all other European Union (EU) domiciled students decreased by 1% from 97,925 to 97,155. Over the same period, the number of non-EU domiciled students increased by 4% (from 249,630 to 258,430). (Ref. Table 1a).
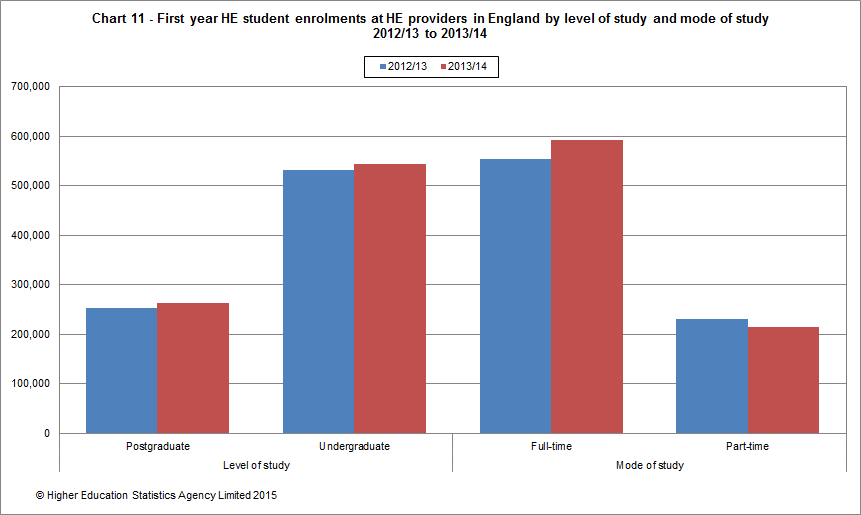
The number of full-time first year enrolments increased by 7% between 2012/13 and 2013/14 and part-time first year enrolments decreased by 7% over the same period. The number of postgraduate first year enrolments increased by 4% and undergraduate first year enrolments increased by 3%. (Ref. Table 2a and Chart 11).
In 2013/14, 96% of English domiciled first year undergraduates studied at HEPs in England (excluding The Open University), the same as in 2012/13. 96% of English domiciled first year postgraduates studied at HEPs in England (excluding The Open University), the same as in the previous year. (Ref. Table 7a and Chart 6).
Among students from outside the UK studying at HEPs in England the largest numbers from non-EU countries came from China followed by India and for other EU countries came from Germany. (Ref. Table 8 and Table 9).
Just over a quarter (26%) of all part-time enrolments at HEPs in England were enrolled at The Open University national centre in England (Ref. Table 10).
Key points - qualifications obtained (England only)
In 2013/14 there were 352,655 first degree qualifiers compared to 336,345 in 2012/13, an increase of 5%. (Ref. Table 11a). 70% of first degree qualifiers gained a first or upper second class degree (Ref. Table 12a).
First degrees accounted for 54% of qualifications obtained in 2013/14. (Ref. Table 11a and Chart 12).
Chart 12 illustrates the distribution of qualifications obtained at HEPs in England in 2013/14.
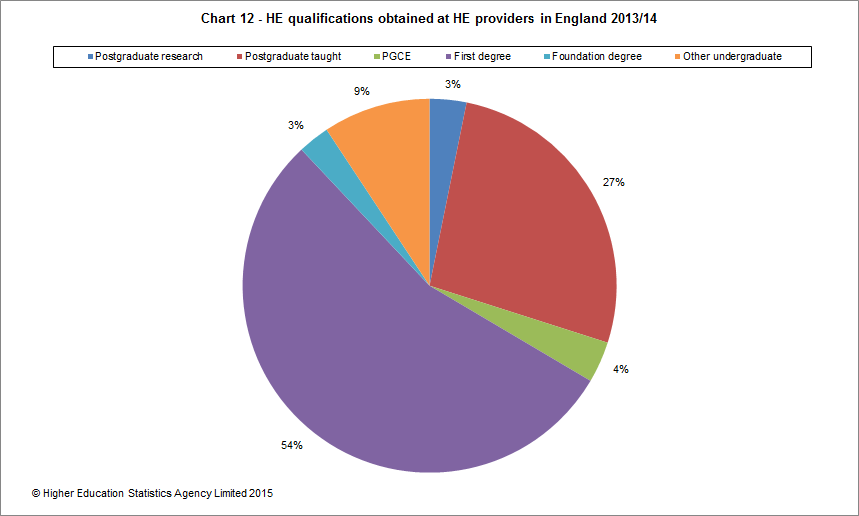
192,385 HE qualifications obtained in 2013/14 were at postgraduate taught level, a decrease of 2% from 2012/13. (Ref. Table 11a).
Key points - enrolments (Wales only)
The total number of HE enrolments at HEPs in Wales stood at 137,135 in 2013/14, showing no percentage change from 2012/13. Postgraduate enrolments increased by 3% while undergraduate enrolments decreased by 1% between 2012/13 and 2013/14. (Ref. Table 1a).
Between 2012/13 and 2013/14, the number of enrolments of UK domiciled students decreased by 1% (from 113,085 to 111,530). The number of all other European Union (EU) domiciled students increased by 2% (from 5,550 to 5,645). Over the same period, the overall number of non-EU domiciled students increased by 6% (from 18,875 to 19,960), for postgraduates this number increased by 9% compared to 2% for undergraduates. (Ref. Table 1a).
The number of full-time first year enrolments increased by 4% between 2012/13 and 2013/14. Part-time first year enrolments decreased by 8% over the same period. The number of postgraduate first year enrolments increased by 4% while undergraduate first year enrolments fell by 2%. (Ref. Table 2a and Chart 13).
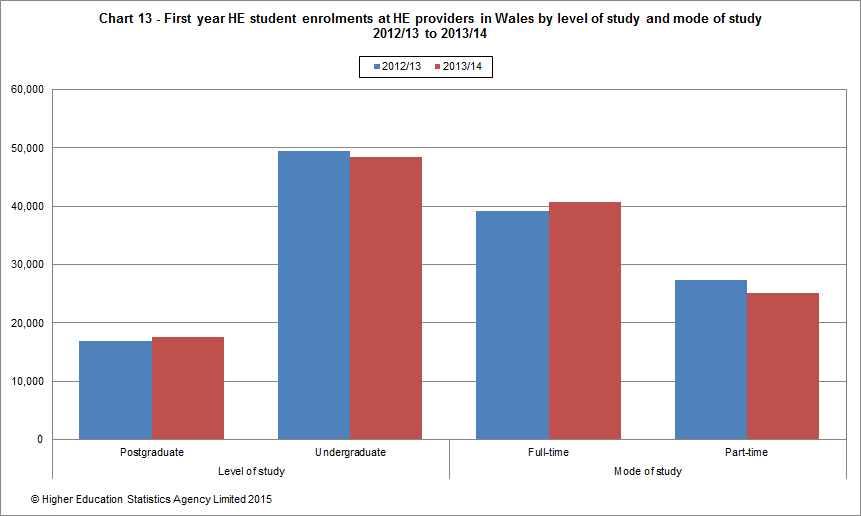
In 2013/14, 77% of Welsh domiciled first year undergraduates studied at HEPs in Wales (excluding The Open University), the same percentage as in 2012/13. In 2013/14, 71% of Welsh domiciled first year postgraduates studied at HEPs in Wales (excluding The Open University), 70% in 2012/13 (Ref. Table 7a and Chart 6).
Among students from outside the UK studying at HEPs in Wales the largest numbers from other EU countries came from Germany and for non-EU countries China. (Ref. Table 8 and Table 9).
Just under a fifth (19%) of all part-time enrolments at HEPs in Wales were enrolled at The Open University national centre in Wales. (Ref. Table 10).
Key points - qualifications obtained (Wales only)
In 2013/14 there were 23,720 first degree qualifiers compared to 22,850 in 2012/13, an increase of 4%. (Ref. Table 11a). Nearly two-thirds (65%) of first degree qualifiers gained a first or upper second class degree (Ref. Table 12a).
First degrees accounted for 55% of qualifications obtained in 2013/14. (Ref. Table 11a and Chart 14).
Chart 14 illustrates the distribution of qualifications obtained at HEPs in Wales in 2013/14.
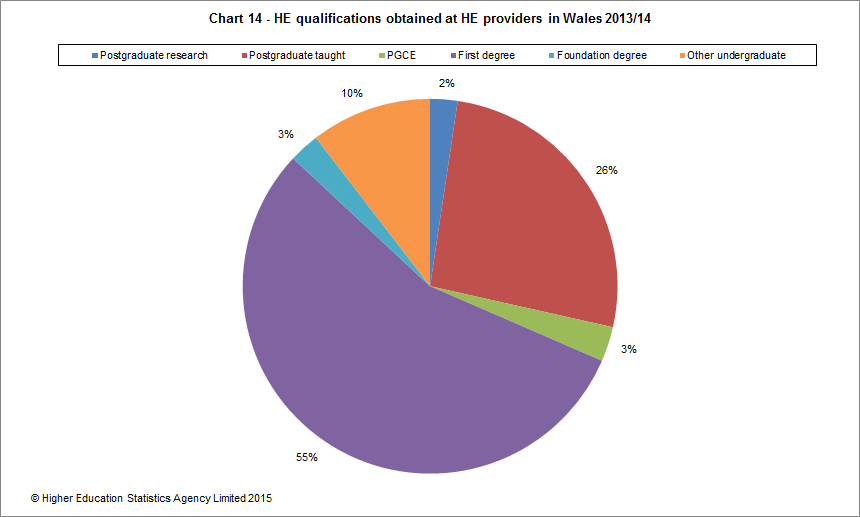
12,320 HE qualifications obtained in 2013/14 were at postgraduate taught level, a decrease of 5% from 2012/13. (Ref. Table 11a).
Key points - enrolments (Scotland only)
The use of the term Higher Education providers (HEPs) in this year’s SFR does not represent any change to the coverage at Scotland level. The information in the SFR, as in previous years, covers HEIs in Scotland (including the Open University), except for Table 1b which includes HE delivered in Further Education colleges (FECs). The total number of HE enrolments in Scotland (including those at FECs) stood at 279,495 in 2013/14, showing no percentage change from 2012/13. There is a relatively high proportion of HE provision that occurs in FECs in Scotland compared to other UK administrations, 48,690 HE student enrolments were at FE colleges in Scotland in 2013/14 (Ref. Table 1b). Excluding these student enrolments, the total number of HE enrolments at HEPs in Scotland stood at 230,805 in 2013/14, showing no percentage change from 2012/13. Postgraduate at enrolments at HEPs increased by 1% while undergraduate enrolments at HEPs showed no percentage change between 2012/13 and 2013/14. (Ref. Table 1a).
Between 2012/13 and 2013/14, the number of enrolments of UK domiciled students decreased by 1% (from 184,005 to 182,445). The number of all other European Union (EU) domiciled students increased by 6% (from 18,640 to 19,750). Over the same period, the number of non-EU domiciled students rose by 1% (from 28,305 to 28,610). (Ref. Table 1a).
The number of full-time first year enrolments increased by 5% between 2012/13 and 2013/14 while part-time first year enrolments decreased by 7% over the same period. The number of postgraduate first year enrolments increased by 5%. Although the total number of undergraduate first year enrolments fell by 1%, the number of first degree first year enrolments increased by 2% . (Ref. Table 2a and Chart 15).
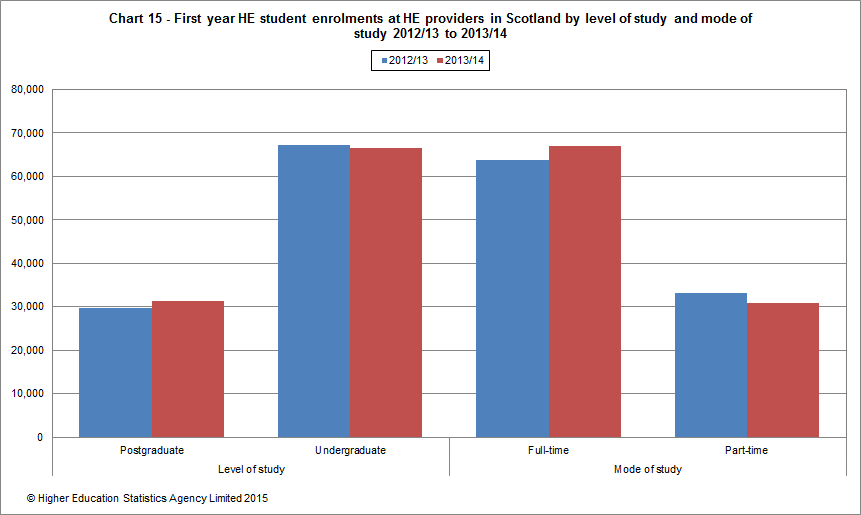
In 2013/14, 94% of Scottish domiciled first year undergraduates studied at HEPs in Scotland (excluding The Open University), compared to 95% in 2012/13. Similarly, 86% of Scottish domiciled first year postgraduates studied at HEPs in Scotland (excluding The Open University), the same as in 2012/13. (Ref. Table 7a and Chart 7).
Among students from outside the UK studying at HEPs in Scotland the largest numbers from other EU countries came from Germany and for non-EU countries China. (Ref. Table 8 and Table 9).
A quarter (25%) of all part-time enrolments at HEPs in Scotland were enrolled at The Open University national centre in Scotland. (Ref. Table 10).
Key points - qualifications obtained (Scotland only)
In 2013/14 there were 36,385 first degree qualifiers compared to 35,470 in 2012/13, an increase of 3%. (Ref. Table 11a). Nearly three-quarters (74%) of all first degree qualifiers gained a first or upper second class degree (Ref. Table 12a).
First degrees accounted for 51% of qualifications obtained in 2013/14. (Ref. Table 12a and Chart 16).
Chart 16 illustrates the distribution of qualifications obtained at HEPs in Scotland in 2013/14.
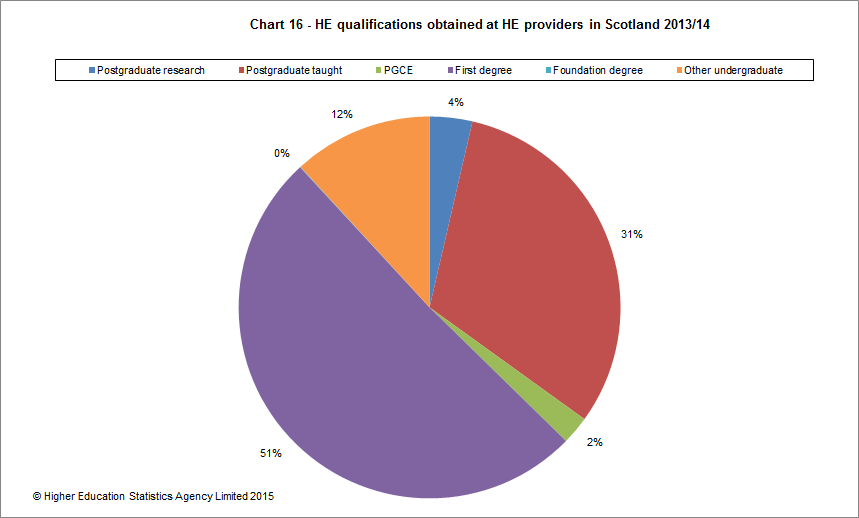
24,150 of the HE qualifications obtained in 2013/14 were at postgraduate taught level, an increase of 7% from 2012/13. (Ref. Table 11a).
Key points - enrolments (Northern Ireland only)
The total number of HE enrolments at HEPs in Northern Ireland stood at 56,395 in 2013/14, showing no percentage change from 2012/13. Postgraduate enrolments increased by 5% and undergraduate enrolments decreased by 1% between 2012/13 and 2013/14. (Ref. Table 1a).
Between 2012/13 and 2013/14, the number of enrolments of UK domiciled students increased by 1% (from 49,820 to 50,455). The number of all other European Union (EU) domiciled students decreased by 13% (from 3,180 to 2,750). Over the same period, the number of non-EU domiciled students increased by 1% (from 3,160 to 3,200). (Ref. Table 1a).
The number of full-time first year enrolments increased by 4% between 2012/13 and 2013/14, part-time first year enrolments decreased by 5% over the same period. The number of postgraduate first year enrolments increased by 6% and undergraduate first year enrolments decreased by 2%. (Ref. Table 2a and Chart 17).
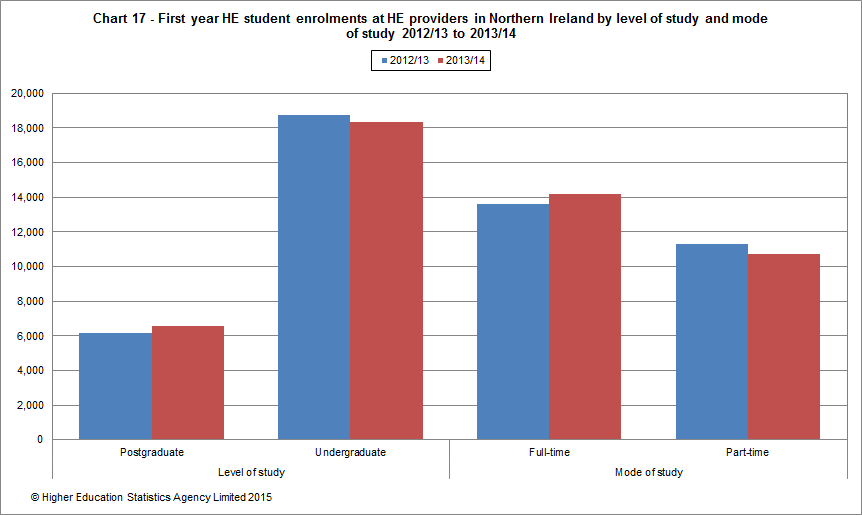
In 2013/14, 77% of Northern Ireland domiciled first year undergraduates studied at HEPs in Northern Ireland (excluding The Open University) the same percentage as in 2012/13. Similarly, 76% of Northern Ireland domiciled first year postgraduates studied at HEPs in Northern Ireland (excluding The Open University), the same as in 2012/13. (Ref. Table 7a and Chart 6).
Among students from outside the UK studying at HEPs in Northern Ireland, the largest numbers from other EU countries came from Ireland, although this number has decreased by 15% since 2012/13 for all enrolments and 18% for first years. For all enrolments from non-EU countries the largest number were from China which increased by 9% over the same time frame. (Ref. Table 8, Table 8a and Table 9).
Just over a fifth (22%) of all part-time enrolments at HEPs in Northern Ireland were enrolled at The Open University national centre in Northern Ireland. (Ref. Table 10).
Key points - qualifications obtained (Northern Ireland only)
In 2013/14 there were 9,090 first degree qualifiers compared to 9,105 in 2012/13, showing no percentage change. (Ref. Table 11a). 71% of students who obtained a first degree were awarded a first or upper second class degree (Ref. Table 12a).
First degrees accounted for 56% of qualifications obtained in 2013/14. (Ref. Table 11a and Chart 18).
Chart 18 illustrates the distribution of qualifications obtained at HEPs in Northern Ireland in 2013/14.
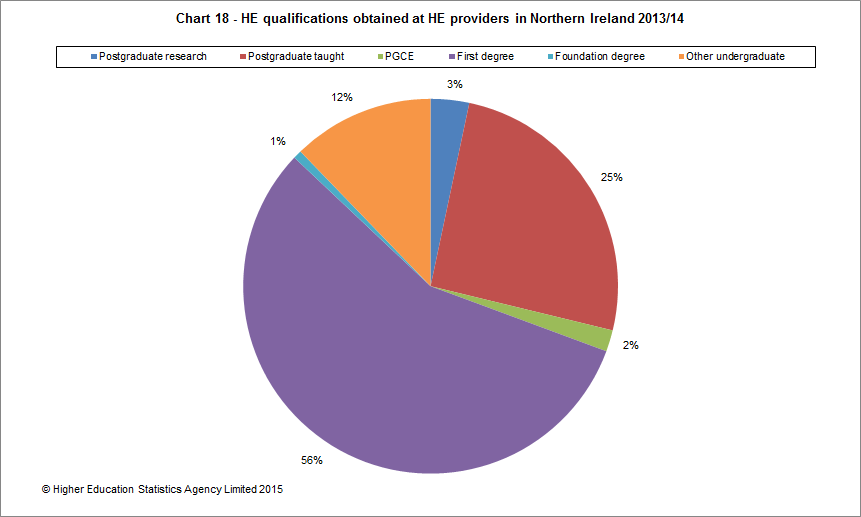
4,390 HE qualifications obtained in 2013/14 were at postgraduate taught level, an increase of 2% from 2012/13. (Ref. Table 11a).
Tables
| HE student enrolments by mode of study, sex, level of study and domicile 2009/10 to 2013/14 | |
| HE student enrolments by location of HE provider, mode of study, domicile and level of study 2009/10 to 2013/14 | |
| HE student enrolments by type of provider, location of provider, mode of study and level of study 2011/12 to 2013/14 | |
| First year HE student enrolments by mode of study, sex, level of study and domicile 2009/10 to 2013/14 | |
| First year HE student enrolments by location of HE provider, mode of study, domicile and level of study 2009/10 to 2013/14 | |
| HE student enrolments by HE provider, level of study, mode of study and domicile 2013/14 | |
| HE student enrolments by level of study, subject area, mode of study and sex 2009/10 to 2013/14 | |
| First year HE student enrolments by level of study, subject area, mode of study and sex 2009/10 to 2013/14 | |
| HE student enrolments by level of study, subject area, mode of study and location of HE provider 2013/14 | |
| Full-time HE student enrolments by level of study, subject area, sex, age group, disability status and ethnicity 2013/14 | |
| Part-time HE student enrolments by level of study, subject area, sex, age group, disability status and ethnicity 2013/14 | |
| UK domiciled HE student enrolments by level of study, mode of study, domicile and location of HE provider 2012/13 & 2013/14 | |
| UK domiciled first year HE student enrolments by level of study, mode of study, domicile and location of HE provider 2012/13 & 2013/14 | |
| Top ten other European Union countries of domicile in 2013/14 for HE student enrolments by location of HE provider and country of domicile 2009/10 to 2013/14 | |
| Top ten other European Union countries of domicile in 2013/14 for first year HE student enrolments by location of HE provider and country of domicile 2009/10 to 2013/14 | |
| Top ten non-European Union countries of domicile in 2013/14 for HE student enrolments by location of HE provider and country of domicile 2009/10 to 2013/14 | |
| Top ten non-European Union countries of domicile in 2013/14 for first year HE student enrolments by location of HE provider and country of domicile 2009/10 to 2013/14 | |
| HE student enrolments by location of HE provider, mode of study, Open University location and level of study 2012/13 to 2013/14 | |
| HE qualifications obtained by sex, level of qualification obtained, mode of study and domicile 2009/10 to 2013/14 | |
| HE qualifications obtained by location of HE provider, sex, level of qualification obtained, mode of study and domicile 2009/10 to 2013/14 | |
| First degree qualifiers by sex, mode of study and class of first degree 2009/10 to 2013/14 | |
| First degree qualifiers by location of HE provider, sex, mode of study and class of first degree 2013/14 | |
| HE qualifications obtained by sex, subject area, level of qualification obtained and class of first degree 2009/10 to 2013/14 | |
| HE qualifications obtained by sex, subject area, location of HE provider and level of qualification obtained 2013/14 | |
| HE students studying wholly overseas by location of HE provider, location of provision, type of provision and level of provision 2009/10 to 2013/14 |
None of the tables presented should be interpreted without reference to the Notes to Tables and Definitions provided below.
Notes to tables
The United Kingdom Statistics Authority has designated these statistics as National Statistics, in accordance with the Statistics and Registration Service Act 2007 and signifying compliance with the Code of Practice for Official Statistics.
Designation can be broadly interpreted to mean that the statistics:
- Meet identified user needs
- Are well explained and readily accessible
- Are produced according to sound methods
- Are managed impartially and objectively in the public interest.
Once statistics have been designated as National Statistics it is a statutory requirement that the Code of Practice shall continue to be observed.
Definitions
The data presented in this SFR are based on the 2013/14 HESA Student and Aggregate offshore records. The statistics in this SFR are derived by HESA from data collected from all publicly funded HEPs in the UK (including The Open University) and The University of Buckingham, which is privately funded. The figures (in all tables except 1b) therefore exclude HE enrolments and qualifications obtained by students registered at UK further education colleges and at other private and independent UK HE colleges. This SFR also includes summary statistics about study at higher education level in further education colleges (shown in Table 1b). Data for HE students enrolled at FE sector colleges are taken from individual student data collected by The Skills Funding Agency (covering English FECs), the Scottish Funding Council, the Department for Children, Education, Lifelong Learning and Skills (Wales) and the Department for Employment and Learning Northern Ireland.
The full set of definitions relating to the data in this release can be view online at here.
Student enrolments and qualifications definitions:
- Coverage
- Fixed database
- Standard registration population
- Qualifications obtained population
- HE in FE data
- Rounding strategy
- Age
- Class of first degree
- Disability status
- Domicile
- Ethnicity
- HE provider identifiers
- Location of HE provider
- Level of study/Qualification obtained
- Mode of study/qualification
- Sex
- Subject of study
For data intelligence, please see the following web page.
Aggregate offshore definitions:
For data intelligence, please see the following web page.
Press enquiries should be directed to the Press Office at the Higher Education Statistics Agency (HESA), 95 Promenade, Cheltenham, GL50 1HZ: Tel: 01242 211120. General enquiries about the data contained within this SFR should be addressed to Jenny Bermingham, Senior Statistical Analyst, HESA (at the same address), telephone: 01242 211115.
Ends

Embargo
15 January 2015, 9:30
Coverage
UK
Themes
Children, education and skills
Issued by
HESA, 95 Promenade, Cheltenham, GL50 1HZ
Press enquiries
01242 211120
Public enquiries
01242 211133
Statistician
Jenny Bermingham

