Higher education student enrolments and qualifications obtained at higher education institutions in the United Kingdom for the academic year 2012/13
Introduction
This Statistical First Release (SFR) has been produced by the Higher Education Statistics Agency (HESA) in collaboration with statisticians from the UK Department for Business, Innovation and Skills (BIS), the Welsh Government (WG), the Scottish Government (SG) and the Department for Employment and Learning Northern Ireland (DEL(NI)). It has been released according to the arrangements approved by the UK Statistics Authority. It provides details of student enrolments and qualifications obtained by higher education (HE) students at HE institutions (HEIs) in the United Kingdom (UK) for the academic year 2012/13. For the first time this year this SFR also includes summary statistics about study at higher education level in further education colleges, and it therefore presents figures illustrating the totality of higher education provision in publicly-funded institutions in the UK. This SFR also includes information from the HESA Aggregate Offshore Record. This record captures students studying wholly outside the UK who are either registered with the reporting institution or who are studying for an award of the reporting institution.
Readers should be aware that data definitions sometimes change over time and this can affect the validity of time series comparisons. Any significant changes have been explained in the Notes to Tables and/or Definitions.
Please note, key points have been derived from the Excel tables (these can be found below). Comparisons with previous year's data have only been included where they can be derived from these tables.
A statistical reference volume ‘Students in Higher Education Institutions 2012/13' providing more detailed information about students in higher education in the UK will be published by HESA in February 2014.
Key points - enrolments (all UK HEIs)
The total number of HE enrolments at UK HEIs stood at 2,340,275 in 2012/13, a decrease of 6% from 2011/12. This reflects a general decline across the sector in all modes and levels of study which coincides with changes to the tuition fee arrangements. Postgraduate and undergraduate enrolments both decreased by 6% between 2011/12 and 2012/13. Full-time enrolments decreased by 2% while part-time enrolments showed a sharper decline of 15% over the same period (see Table 1 and Chart 1). There were a further 186,455 HE enrolments at further education colleges in 2012/13 compared to 180,390 in 2011/12. These data are presented in Table 1b disaggregated by mode and level of study. All further figures presented in this SFR exclude HE enrolments at further education colleges.
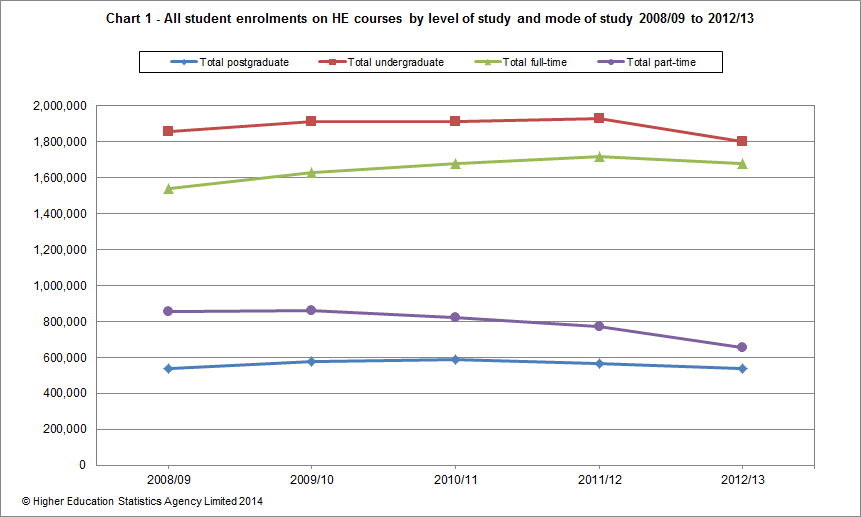
Over the time series shown in this SFR the overall number enrolled on HE courses has risen consecutively from 2,396,055 in 2008/09 to 2,501,295 in 2010/11. The total stood at 2,496,645 in 2011/12, a decrease of 4,655 in overall numbers, with a further decrease of 156,365 in 2012/13 to 2,340,275. (Ref. Table 1). The 6% decrease in enrolments between 2011/12 and 2012/13 can be attributed to the decline in first year enrolments on HE courses in 2012/13, which experienced a 13% decrease from 2011/12. The total number of first year enrolments stood at their lowest point in the 5 years shown at 971,410 in 2012/13 (Ref. Table 2).
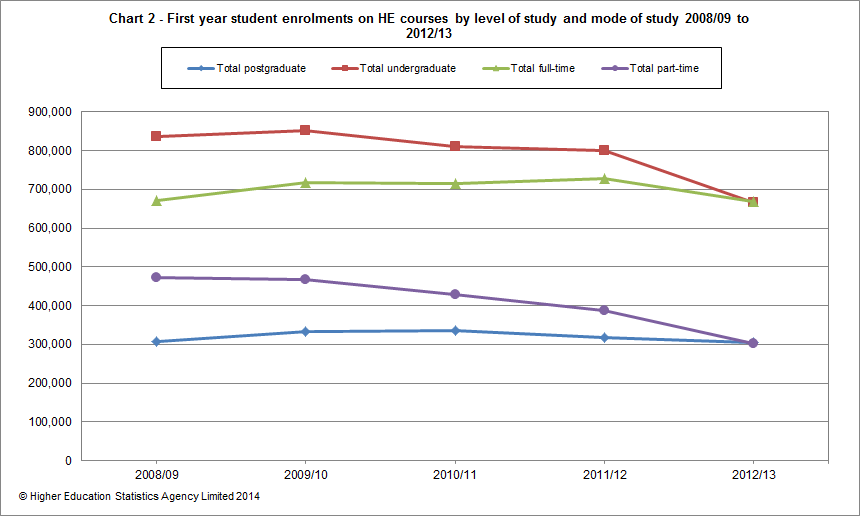
Postgraduate numbers for all enrolments and first years follow the same trend peaking in 2010/11 and decreasing each year to 2012/13. A decrease of 6% was observed in all postgraduates and 4% among first year postgraduate enrolments. Total undergraduate enrolments reached a high in 2011/12 before decreasing by 6% in 2012/13. First year undergraduate enrolments reached a peak in 2009/10 and have decreased since, showing the sharpest fall in 2012/13 with a decrease of 17% from 2011/12 (Ref. Table 1, Table 2, Chart 1 and Chart2).
1,682,145 of all enrolments were full-time, a decrease in numbers of 2% since 2011/12, showing the first decrease after a trend of increasing full-time numbers over the time series shown. The number of full-time first year enrolments decreased by 8% between 2011/12 and 2012/13. 658,130 enrolments were part-time showing a decrease of 15% since 2011/12, while part-time first year enrolments decreased by 22% over the same period. The sharper decline in part-time enrolments compared to full-time enrolments has resulted in an overall shift in the proportions studying part-time. In 2011/12 31% of all enrolments were part-time compared to 28% in 2012/13 and this trend is reflected in part-time first year enrolments where 35% of first year enrolments were part-time in 2011/12 compared to 31% in 2012/13 (Ref. Table 1, Table 2, Chart 1 and Chart 2).
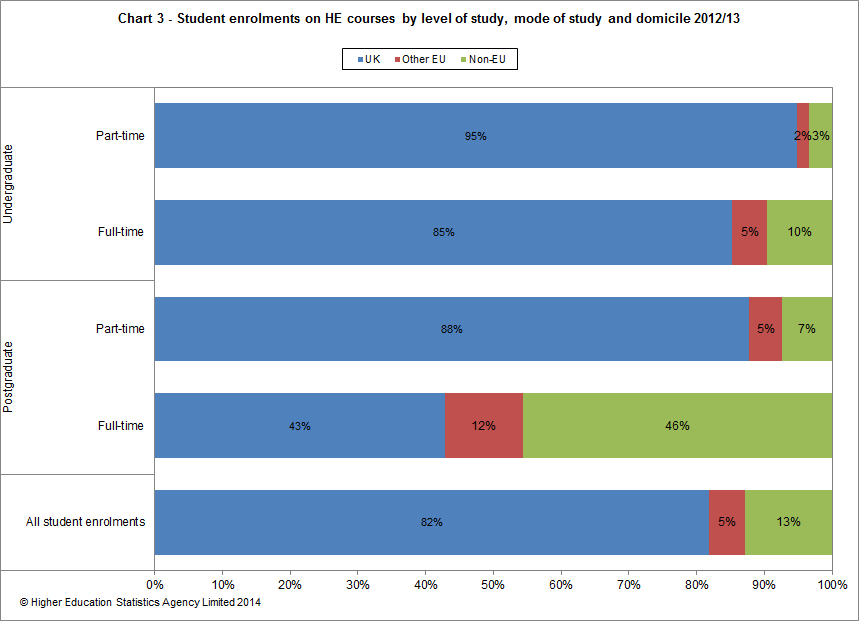
In 2012/13 UK domiciled students accounted for 82% of all enrolments at UK HEIs (83% in 2011/12), 5% were other European Union (EU) domiciled (the same as in 2011/12) and the remaining 13% came from countries outside the EU (12% in 2011/12). The overall number of student enrolments from outside the EU decreased by 1% from 2011/12 (from 302,680 to 299,970) although among undergraduate enrolments an increase of 3% was observed since 2012/13. The number of other EU domiciled students decreased by 5% (from 132,550 to 125,290). Over the same period, the number of UK domiciled students decreased by 7% (from 2,061,410 to 1,915,015). (Ref. Table 1).
Proportions of students from outside the UK varied by both level and mode of study in 2012/13. UK domiciled students made up the majority of enrolments for all modes and levels of study with the exception of full-time postgraduates, where 46% were non-EU domiciled (Ref. Chart 3).
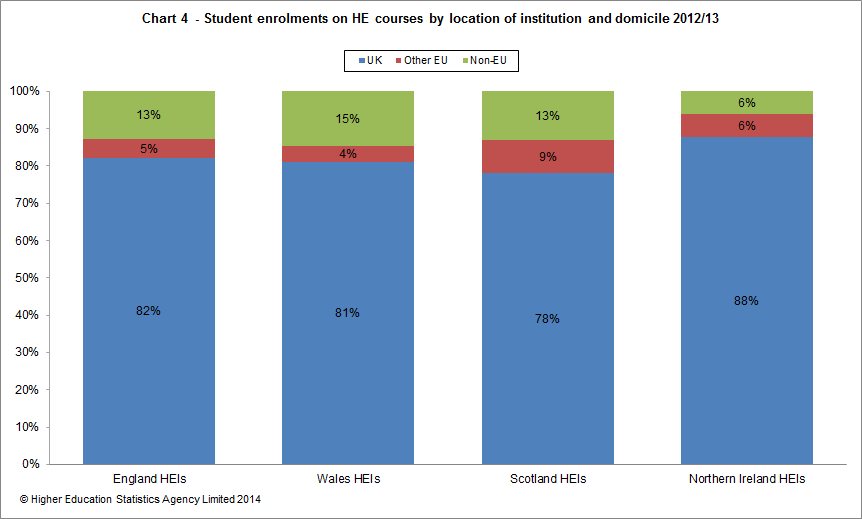
Proportions of students from outside the UK also varied across the four administrations. Institutions in Wales had the greatest proportion of non-EU domiciled students at 15%, while institutions in Scotland had the greatest proportion of other EU domiciled students at 9%. At HEIs in England, 13% of all enrolments were non-EU domiciled, compared to 12% in 2011/12. This increase in share was not due to an increase in the number of non-EU enrolments, these fell by 1% but due to the number of UK enrolments reducing at a faster rate, UK enrolments in England fell by 8%. Scotland was the only administration which had an overall increase in the number of other EU domiciled enrolments, increasing by 7% from 2011/12. Northern Ireland was the only country to observe an increase in overall non-EU numbers, increasing by 7% from 2011/12 (Ref. Chart 4 and Table 1a).
For 2012/13 a revised coding of subject area was introduced with JACS3 replacing JACS2. Further detail about the change is described in the definitions. It should be noted that while the 19 subject areas are comparable across these two versions of JACS, some institutions have taken the opportunity to reclassify some courses with the introduction of JACS3.
Although there was a 1% decrease in full-time enrolments in science subjects in 2012/13, the proportion studying science subjects remained the same over the time series shown at 44% of all full-time enrolments. 40% of part-time enrolments in 2012/13 were in science subjects compared to 38% in 2011/12; while this shows an increase in the overall percentage in science subjects the number of part-time enrolments in science subjects decreased by 10% between 2011/12 and 2012/13 (Ref. Table 3).
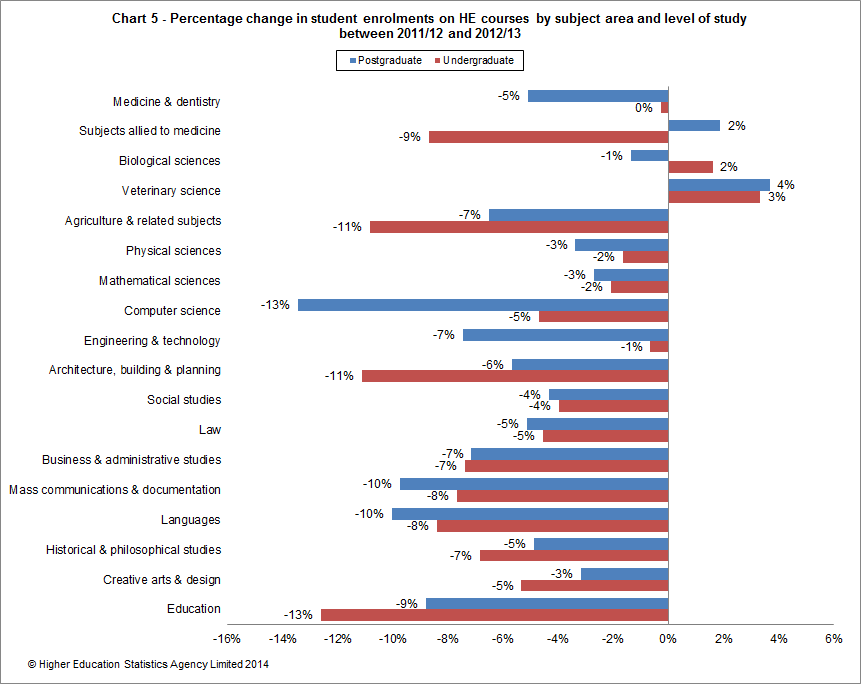
The greatest percentage increase in postgraduate student enrolments between 2011/12 and 2012/13 was observed in Veterinary science (4%). The largest percentage decrease in postgraduate numbers was observed in Computer science (13%). For undergraduate enrolments the greatest percentage increase was also observed in Veterinary science (3%) while undergraduate enrolments in Education decreased by 13% (Ref. Table 3 and Chart 5).
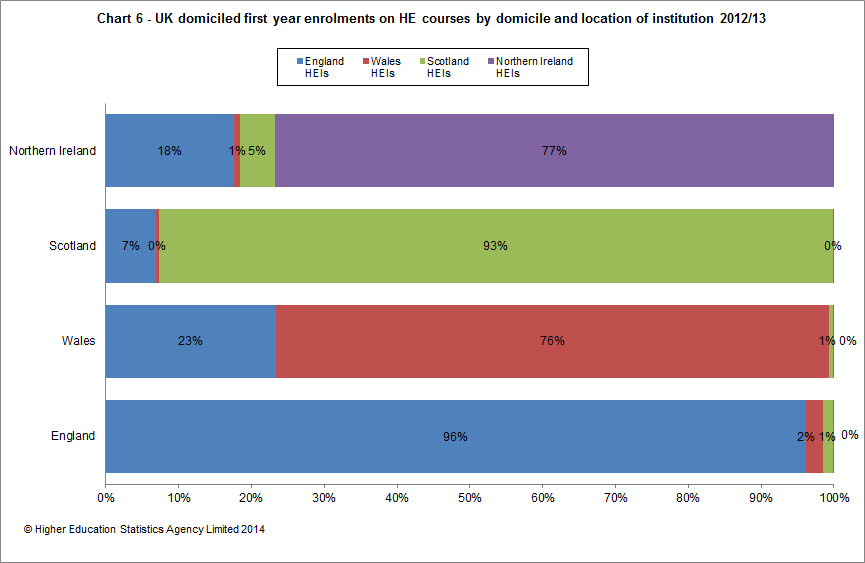
Chart 6 shows the cross border flows of UK domiciled first year enrolments by the country of domicile and country of institution (excluding those studying at The Open University). Across all regions the majority of students stay in their home country although those domiciled from Wales and Northern Ireland were more likely to cross borders than those from England and Scotland. 23% of first year students from Wales were enrolled at HEIs in England. 5% of first year students from Northern Ireland were enrolled at HEIs in Scotland.
Tables Table 5, Table 5a, Table 6 and Table 6a are new additions to the First Release for 2012/13 and show the top 10 countries for other EU and non-EU domiciled student enrolments and first year enrolments. Across all UK HEIs the largest number of students from other EU countries came from Germany and then Ireland although there was a 9% decrease in numbers from Germany since 2011/12 and 16% decrease in numbers from Ireland. Among non-EU countries the largest number were domiciled from China with a 6% increase from 2011/12, India was second largest in the list of non-EU countries although they observed a 25% reduction in numbers since 2011/12 (Ref. Table 5 and Table 6).
Table 7 is also a new table for 2012/13 which analyses student enrolments at The Open University where 7% of all enrolments were registered in 2012/13. The Open University is counted as a wholly English institution and its students are counted within England for all tables in the rest of this SFR. In Table 7 Open University students are counted within the country where their national centre is located rather than in England. As a percentage of all part-time enrolments this ranged from 20% in Wales studying at The Open University to 26% in England (Ref. Table 7).
Key points - qualifications obtained (all UK HEIs)
In 2012/13, there were 787,900 HE qualifications obtained in the UK compared to 787,205 in 2011/12. Of these 403,770 were at first degree level, compared to 390,990 in 2011/12, showing an increase of 3%. (Ref. Table 8).
Chart 7 illustrates the distribution of qualifications obtained in 2012/13.
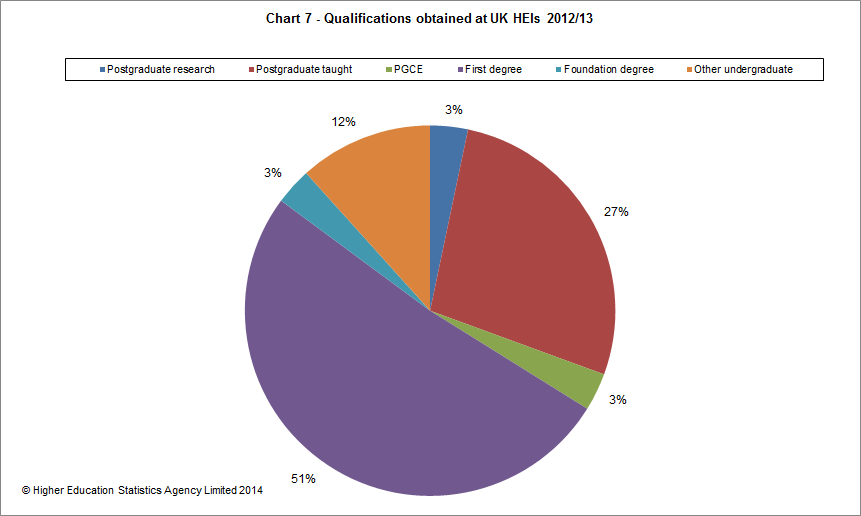
First degree qualifications accounted for 51% of all HE qualifications obtained in 2012/13 and other undergraduate qualifications (including foundation degrees and excluding undergraduate PGCE) accounted for 15% (Ref. Table 8 and Chart 7).
Postgraduate qualifications (excluding postgraduate PGCE) accounted for 31% and PGCE qualifications (at postgraduate and undergraduate level) accounted for the remaining 3% (Ref. Table 5 and Chart 7).
Chart 8 shows the time series trend in qualifications obtained between 2008/09 and 2012/13 by level of qualification obtained.
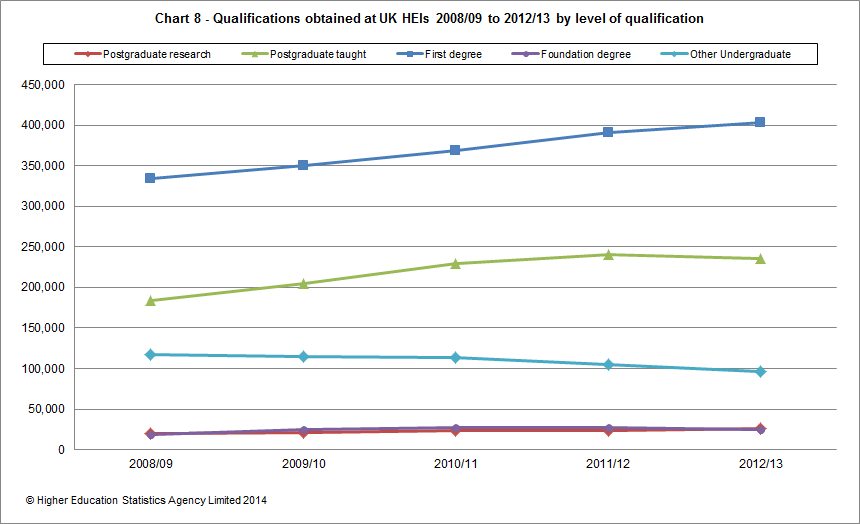
Over the time series shown in this SFR, the total number of qualifications gained has shown an overall increase in numbers between 2008/09 and 2012/13 and this trend is reflected for both postgraduate research and first degree qualifications. The inverse can be seen for other undergraduate qualifications which have decreased each year since 2008/09 (Ref. Table 8 and Chart 8).
Postgraduate taught qualifications observed a decrease for the first time in 2012/13 after steadily increasing each year since 2008/09 (Ref. Table 8 and Chart 8).
Of those gaining a classified first degree, the proportion who obtained a first or upper second has shown a steady increase from 62% in 2008/09 to 68% in 2012/13 (Ref. Table 9).
Chart 9 shows the percentage distribution of first degree classifications by mode and gender in 2012/13.
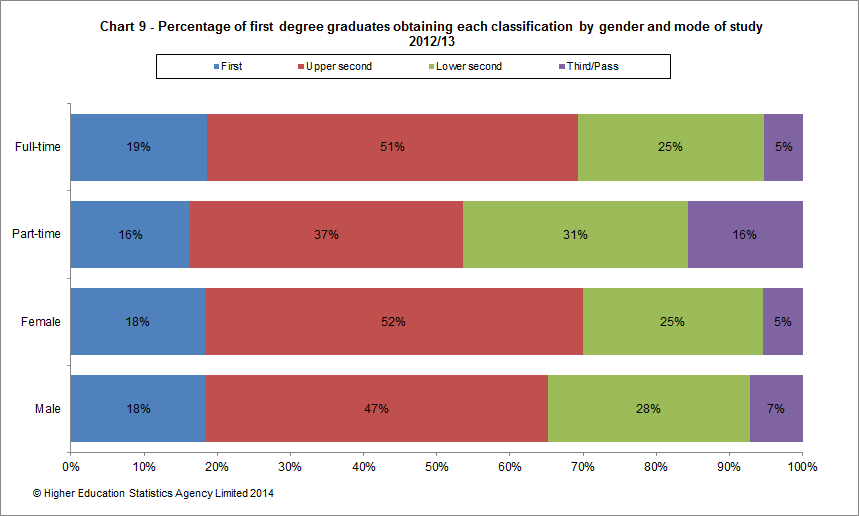
69% of first degrees undertaken through full-time study in 2012/13 achieved first or upper second classifications compared to 54% of those undertaken through part-time study (Ref Table 9 and Chart 9).
70% of first degree qualifications achieved by females in 2012/13 were at first or upper second level compared to 65% of those achieved by males (Ref Table 9 and Chart 9).
In 2012/13, 40% of qualifications obtained were in science subjects, a slight increase in the proportion since 2011/12 and an overall increase in numbers. In 2008/09, 36% of qualifications achieved by women were in science subjects compared to 45% for men. These have showed little change over the 5 year time series at 36% and 45% respectively in 2012/13 (Ref. Table 10).
Key points - students studying wholly overseas (all UK HEIs)
In 2012/13, there were 598,925 students studying wholly overseas compared to 571,010 in 2011/12, an increase of 5%, although earlier years of this time series should be interpreted with caution (refer to Notes to Tables) (Ref. Table 11). It should also be noted that students registered at Oxford Brookes University accounted for 43.7% of the total population of the 2012/13 Aggregate offshore record (44.1% in 2011/12, 47.6% in 2010/11 and 39.7% in 2009/10). The majority of these students were registered with an overseas partner on Association of Chartered Certified Accountants (ACCA) programmes.
Of those students studying wholly overseas in 2012/13, 13% were studying within the EU and 87% were studying outside the EU, the same percentages as in 2011/12 (Ref. Table 11 and Chart 10).
Chart 10 shows the number of students who were studying wholly overseas between 2008/09 to 2012/13 by level of provision and location of study.

Key points - enrolments (England only)
The total number of HE enrolments at England HEIs stood at 1,944,995 in 2012/13, showing a decrease of 7% from 2011/12. Postgraduate enrolments decreased by 6% and undergraduate enrolments decreased by 8% between 2011/12 and 2012/13. (Ref. Table 1a).
Between 2011/12 and 2012/13, the number of enrolments of UK domiciled students decreased by 8% from 1,740,070 to 1,597,440. The number of all other European Union (EU) domiciled students decreased by 7% from 105,185 to 97,925. Over the same period, the number of non-EU domiciled students decreased by 1% (from 251,980 to 249,630) (Ref. Table 1a).
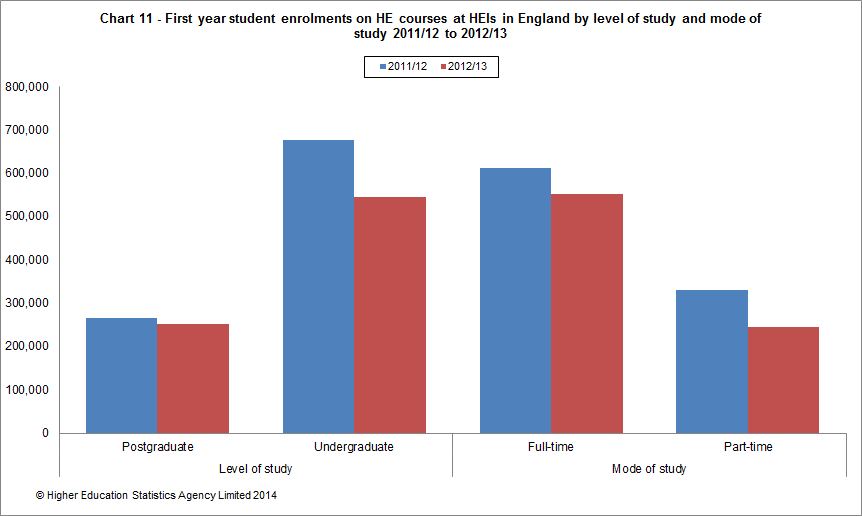
The number of full-time first year enrolments decreased by 10% between 2011/12 and 2012/13 and part-time first year enrolments decreased by 26% over the same period. The number of postgraduate first year enrolments decreased by 5% and undergraduate first year enrolments decreased by 19% (Ref. Table 2a and Chart 11).
In 2012/13, 96% of English domiciled first year undergraduates studied at England HEIs (excluding The Open University), compared to 97% in 2011/12. 96% of English domiciled first year postgraduates studied at England HEIs (excluding The Open University), the same as in the previous year (Ref. Table 4 and Chart 6).
Among students from outside the UK studying at HEIs in England the largest numbers from other EU countries came from Germany and for non-EU countries, the largest number came from China followed by India (Ref. Table 5 and Table 6).
Just over a quarter (26%) of all part-time enrolments at HEIs in England were enrolled at The Open University national centre in England (Ref. Table 7).
Key points - qualifications obtained (England only)
In 2012/13 there were 337,655 first degree graduates compared to 326,530 in 2011/12, an increase of 3% (Ref. Table 8a).
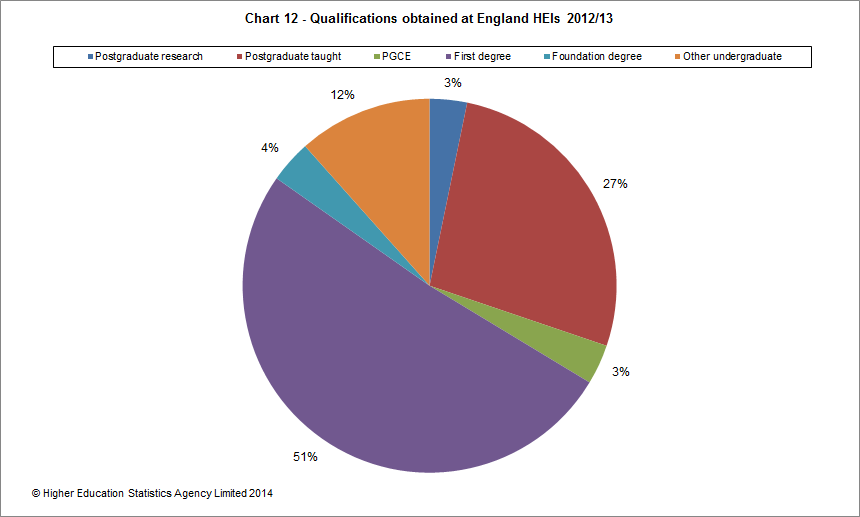
First degrees accounted for 51% of qualifications obtained in 2012/13 (Ref. Table 8a and Chart 12).
Chart 12 illustrates the distribution of qualifications obtained at England HEIs in 2012/13.
196,595 HE qualifications obtained in 2012/13 were at postgraduate taught level, a decrease of 1% from 2011/12 (Ref. Table 8a).
Key points - enrolments (Wales only)
The total number of HE enrolments at Wales HEIs stood at 128,780 in 2012/13, showing a 2% decrease from 2011/12. Postgraduate enrolments decreased by 2% and undergraduate enrolments decreased by 2% between 2011/12 and 2012/13 (Ref. Table 1a).
Between 2011/12 and 2012/13, the number of enrolments of UK domiciled students decreased by 1% (from 105,915 to 104,355). The number of all other European Union (EU) domiciled students decreased by 8% (from 6,020 to 5,550). Over the same period, the number of non-EU domiciled students decreased by 2% (from 19,250 to 18,875) (Ref. Table 1a).
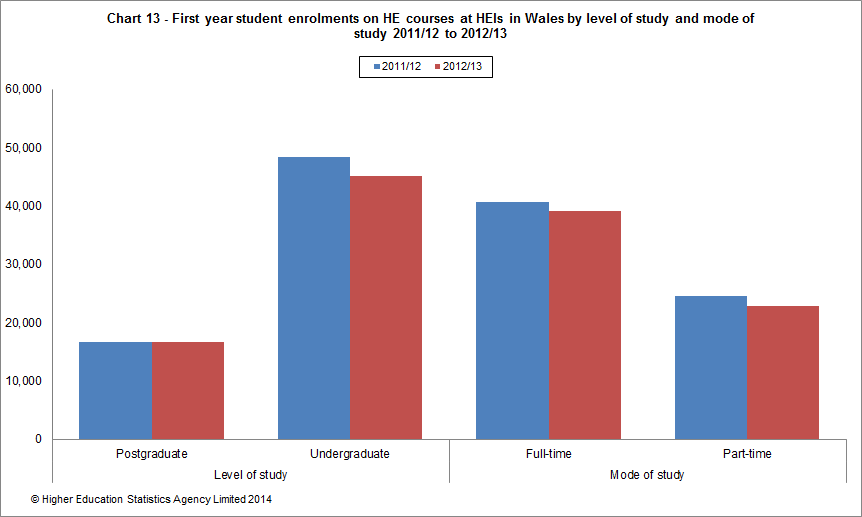
The number of full-time first year enrolments decreased by 4% between 2011/12 and 2012/13. Part-time first year enrolments decreased by 7% over the same period. The number of postgraduate first year enrolments showed no percentage change while undergraduate first year enrolments fell by 7% (Ref. Table 2a and Chart 13).
In 2012/13, 77% of Welsh domiciled first year undergraduates studied at Wales HEIs (excluding The Open University), the same as in 2011/12. In 2012/13, 70% of Welsh domiciled first year postgraduates studied at Wales HEIs (excluding The Open University), the same as the previous year (Ref. Table 4 and Chart 6).
Among students from outside the UK studying at HEIs in Wales the largest numbers from other EU countries came from Germany and for non-EU countries China (Ref. Table 5 and Table 6).
A fifth (20%) of all part-time enrolments at HEIs in Wales were enrolled at The Open University national centre in Wales (Ref. Table 7).
Key points - qualifications obtained (Wales only)
In 2012/13 there were 22,490 first degree graduates compared to 22,250 in 2011/12, an increase of 1% (Ref. Table 8a).
First degrees accounted for 53% of qualifications obtained in 2012/13 (Ref. Table 8a and Chart 14).
Chart 14 illustrates the distribution of qualifications obtained at HEIs in Wales in 2012/13.
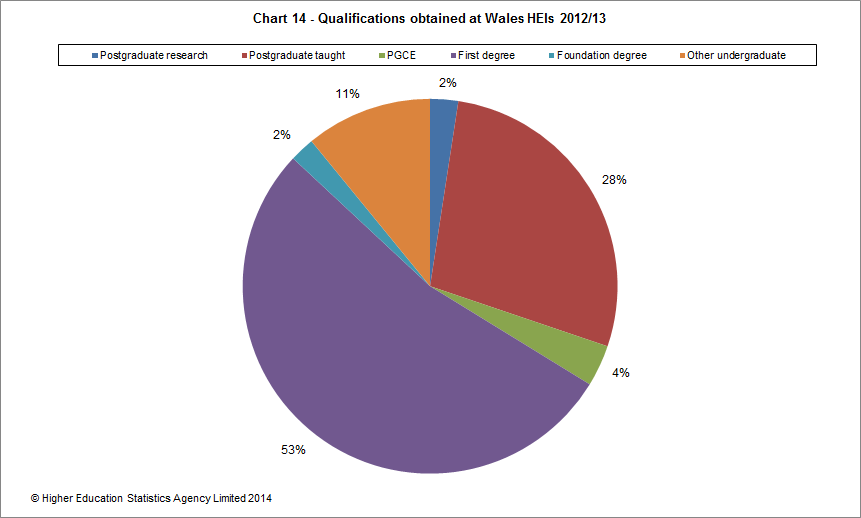
12,870 HE qualifications obtained in 2012/13 were at postgraduate taught level, a decrease of 14% from 2011/12 (Ref. Table 8a).
Key points - enrolments (Scotland only)
The total number of HE enrolments at Scotland HEIs stood at 214,785 in 2012/13, a 1% decrease from 2011/12. Postgraduate enrolments decreased by 3% while undergraduate enrolments showed no percentage change between 2011/12 and 2012/13 (Ref. Table 1a).
Between 2011/12 and 2012/13, the number of enrolments of UK domiciled students decreased by 1% (from 170,345 to 167,840). The number of all other European Union (EU) domiciled students increased by 7% (from 17,475 to 18,640). Over the same period, the number of non-EU domiciled students fell by 1% (from 28,500 to 28,305) (Ref. Table 1a).
The number of full-time first year enrolments increased by 1% between 2011/12 and 2012/13, part-time first year enrolments showed no percentage change over the same period. The number of postgraduate first year enrolments showed no percentage change and undergraduate first year enrolments rose by 1% (Ref. Table 2a and Chart 15).
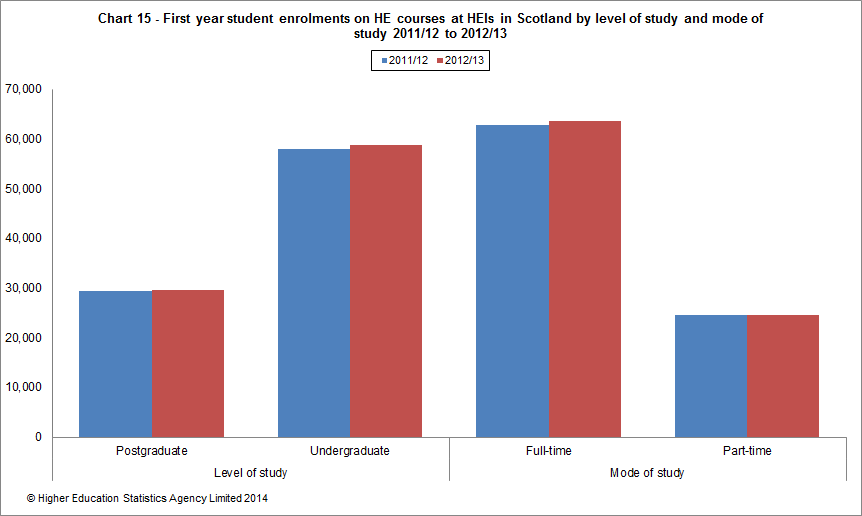
In 2012/13, 95% of Scottish domiciled first year undergraduates studied at Scotland HEIs (excluding The Open University), compared to 92% in 2011/12. Similarly, 86% of Scottish domiciled first year postgraduates studied at Scotland HEIs (excluding The Open University), compared to 85% in 2011/12 (Ref. Table 4 and Chart 7).
Among students from outside the UK studying at HEIs in Scotland the largest numbers from other EU countries came from Germany and for non-EU countries China (Ref. Table 5 and Table 6.
A quarter (25%) of all part-time enrolments at HEIs in Scotland were enrolled at The Open University national centre in Scotland (Ref. Table 7.
Key points - qualifications obtained (Scotland only)
In 2012/13 there were 34,730 first degree graduates compared to 33,300 in 2011/12, an increase of 4% ( Ref. Table 8a).
First degrees accounted for 51% of qualifications obtained in 2012/13 (Ref. Table 8a and Chart 16).
Chart 16 illustrates the distribution of qualifications obtained at Scotland HEIs in 2012/13.
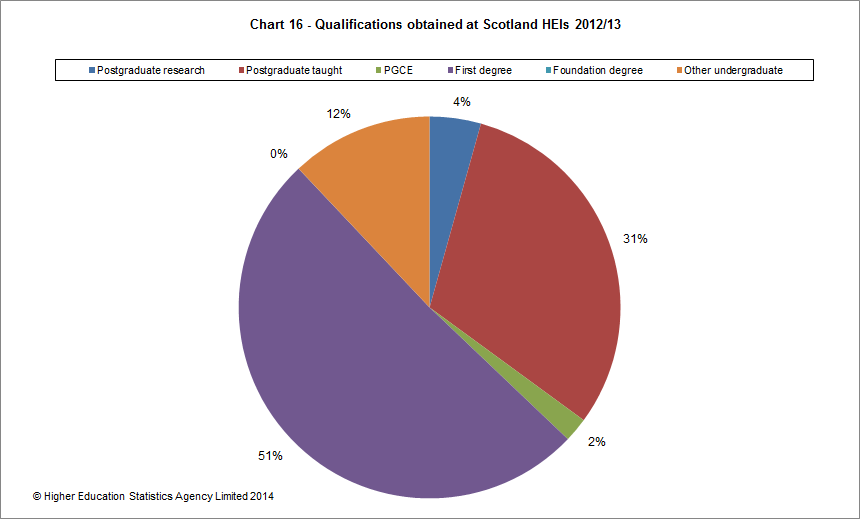
22,385 HE qualifications obtained in 2012/13 were at postgraduate taught level, an increase of 1% from 2011/12 (Ref. Table 8a).
Key points - enrolments (Northern Ireland only)
The total number of HE enrolments at Northern Ireland HEIs stood at 51,715 in 2012/13, showing no percentage change from 2011/12. Postgraduate enrolments decreased by 3% and undergraduate enrolments showed no percentage change between 2011/12 and 2012/13 (Ref. Table 1a).
Between 2011/12 and 2012/13, the number of enrolments of UK domiciled students increased by 1% (from 45,085 to 45,380). The number of all other European Union (EU) domiciled students decreased by 18% (from 3,875 to 3,180). Over the same period, the number of non-EU domiciled students increased by 7% (from 2,950 to 3,160) (Ref. Table 1a).
The number of full-time first year enrolments decreased by 3% between 2011/12 and 2012/13, part-time first year enrolments increased by 2% over the same period. The number of postgraduate first year enrolments decreased by 2% and undergraduate first year enrolments showed no percentage change (Ref. Table 2a and Chart 17).
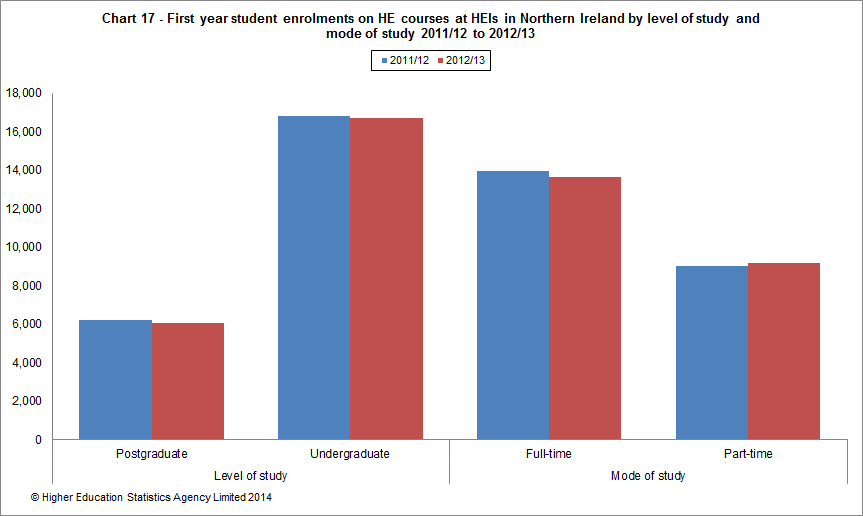
In 2012/13, 77% of Northern Ireland domiciled first year undergraduates studied at Northern Ireland HEIs (excluding The Open University) compared to 71% in 2011/12. Similarly, 76% of Northern Ireland domiciled first year postgraduates studied at Northern Ireland HEIs (excluding The Open University), compared to 73% in 2011/12 (Ref. Table 4 and Chart 6).
Among students from outside the UK studying at HEIs in Northern Ireland the largest numbers from other EU countries came from Ireland, although this number decreased by 19% since 2011/12 for all enrolments and among first years decreased by 28% and for non-EU countries China which increased by 41% over the same time (Ref. Table 5 and Table 6).
Nearly a quarter (23%) of all part-time enrolments at HEIs in Northern Ireland were enrolled at The Open University national centre in Northern Ireland (Ref. Table 7).
Key points - qualifications obtained (Northern Ireland only)
In 2012/13 there were 8,895 first degree graduates compared to 8,905 in 2011/12, showing no percentage change (Ref. Table 8a).
First degrees accounted for 54% of qualifications obtained in 2012/13 (Ref. Table 8a and Chart 18).
Chart 18 illustrates the distribution of qualifications obtained at Northern Ireland HEIs in 2012/13.
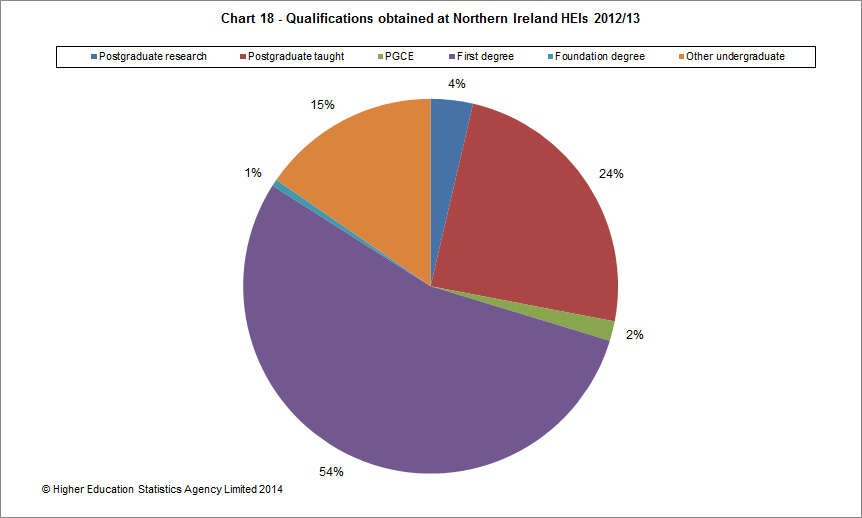
4,265 HE qualifications obtained in 2012/13 were at postgraduate taught level, an increase of 2% from 2011/12 (Ref. Table 8a).
Tables
| All student enrolments on HE courses by level of study, mode of study and domicile 2008/09 to 2012/13. | |
| All student enrolments on HE courses by location of HE institution, mode of study, domicile and level of study 2008/09 to 2012/13. | |
| HE students in the UK by mode of study and level of study 2011/12 & 2012/13 | |
| Table 2 | First year student enrolments on HE courses by level of study, mode of study and domicile 2008/09 to 2012/13. |
| First year student enrolments on HE courses by location of HE institution, mode of study, domicile and level of study 2008/09 to 2012/13. | |
| Table 3 | Student enrolments on HE courses by level of study, subject area and mode of study 2008/09 to 2012/13. |
| Student enrolments on HE courses by level of study, subject area, mode of study and location of HE institution 2012/13. | |
| Table 4 | UK domiciled, first year student enrolments on HE courses by level of study, mode of study, domicile and location of HE institution 2011/12 and 2012/13. |
| Top ten other EU countries of domicile in 2012/13 for student enrolments on HE courses by location of HE institution and country of domicile 2008/09 to 2012/13 | |
| Top ten other EU countries of domicile in 2012/13 for first year student enrolments on HE courses by location of HE institution and country of domicile 2008/09 to 2012/13 | |
| Top ten non-EU countries of domicile in 2012/13 for student enrolments on HE courses by location of HE institution and country of domicile 2008/09 to 2012/13 | |
| Top ten non-EU countries of domicile in 2012/13 for first year student enrolments on HE courses by location of HE institution and country of domicile 2008/09 to 2012/13 | |
| All student enrolments on HE courses by location of HE institution, mode of study, Open University location and level of study 2011/12 to 2012/13 | |
| Qualifications obtained by students on HE courses at HEIs in the UK by sex, level of qualification obtained, mode of study and domicile 2008/09 to 2012/13. | |
| Qualifications obtained by students on HE courses at HEIs in the UK by location of HE institution, sex, level of qualification obtained, mode of study and domicile 2008/09 to 2012/13. | |
| Class of degree achieved by students obtaining first degree qualifications at HEIs in the UK by sex and mode of study 2008/09 to 2012/13. | |
| Class of degree achieved by students obtaining first degree qualifications at HEIs in the UK by location of HE institution, sex and mode of study 2012/13. | |
| Table 10< | Qualifications obtained by students on HE courses at HEIs in the UK by sex, subject area and level of qualification obtained 2008/09 to 2012/13. |
| Table 10a | Qualifications obtained by students on HE courses at HEIs in the UK by sex, subject area, location of HE institution and level of qualification obtained 2012/13. |
| Table 11 | Students studying wholly overseas by location of HE institution, location, type of provision and level of provision 2008/09 to 2012/13. |
None of the tables presented should be interpreted without reference to the Notes to Tables and Definitions provided below.
Notes to tables
The United Kingdom Statistics Authority has designated these statistics as National Statistics, in accordance with the Statistics and Registration Service Act 2007 and signifying compliance with the Code of Practice for Official Statistics.
Designation can be broadly interpreted to mean that the statistics:
- Meet identified user needs
- Are well explained and readily accessible
- Are produced according to sound methods
- Are managed impartially and objectively in the public interest.
Once statistics have been designated as National Statistics it is a statutory requirement that the Code of Practice shall continue to be observed.
- Analyses of subject information show Full Person Equivalents (FPE). These are derived by splitting student instances between the different subjects that make up their course aim. Further detail is provided in the Definition of Subject area.
- Students with a sex of 'other' are included in total figures but not shown in separate breakdowns.
- Students with a domicile of ‘UK unknown' have been included in total figures but not in separate breakdowns.
- First degree data submitted without a classification is included in total figures but not in separate breakdowns. These qualifiers are also not included in percentage calculations.
- For the purposes of Table 5 and 5a, 'Cyprus (European Union)' includes students whose domicile is recorded as 'Cyprus not otherwise specified'.
- For the purposes of Table 4, ‘England HEIs' does not include data for The Open University. Data for this institution is shown separately and included in total figures. For the purposes of Table 7, Open University students are counted within the country where their national centre is located rather than in England. For all other tables in this SFR, The Open University is counted as a wholly English institution and its students are counted within ‘England HEIs'.
-
The 2012/13 data for HE enrolments in further education colleges in the UK is included in Table 1b of this SFR. FE students, in the same way as HE students, are counted as an instance of engagement with the institution. As a student can have more than one instance of engagement, the total FE figure will exceed the number of students. Due to the nature of FE programmes, it is likely that the average number of instances per FE student is slightly higher than the average number of instances per HE student.
Figures for FE institutions in England were obtained from The Data Service and based on the final Individualised Learner Record (ILR) FE 12/13. Figures were supplied as a census count (snapshot date) as at 1 December 2012 where full-time full year students are normally required to attend more than 450 guided learning hours.
Figures for FE institutions in Wales were obtained from the Lifelong Learning Wales Record (LLWR) data collection. The count is of learners pursuing Higher Education Funding Council for Wales (HEFCW) funded learning activities where full-time students are those with 450 or more guided contact hours per year.
Figures for FE institutions in Scotland were supplied by the Scottish Further and Higher Education Funding Council (SFC) as a session count (actively studying anytime during the academic year). Full-time students are those normally required to attend an institution for periods equal to 480 hours or more within the year of programme of study.
Figures for FE institutions in Northern Ireland were supplied by the Department for Employment and Learning Northern Ireland (DEL(NI)) as a full-year count for the 2012/13 academic year. Full-time students are those normally required to attend an institution for periods amounting to a minimum of 15 hours per week, with at least seven sessions a week.
- In 2008/09, an institution in Northern Ireland misreported a number of part-time students (280) as non-EU domicile. Consequently this had a considerable effect on the number of non-EU and UK domiciled students in Northern Ireland institutions. As a result, part-time and total data by domicile for Northern Ireland HEIs has been suppressed from Tables 1a and 2a and shown as $$.
- In 2008/09, an institution in Northern Ireland miscoded a number of part-time, other undergraduate post-registration nursing and midwifery qualifiers (525). Consequently the number of part-time other undergraduate qualifiers at institutions in Northern Ireland was under-reported by this amount. As a result, affected data in Table 8a has been suppressed and shown as $$.
- In 2011/12 an institution in Northern Ireland returned students enrolled from a new partnership which includes significant numbers of Non-EU students. This is reflected in the numbers and percentage change for Non-EU students for Northern Ireland institutions in Tables 1a and 2a.
- In 2008/09, an institution in Scotland misreported a number of students as ‘Students registered at a UK HEI' instead of ‘Students studying for an award of a UK HEI'. This should be taken into account when comparing these Aggregate offshore figures in Table 11.
- In 2011/12 several institutions returned a substantial number of additional students compared to 2010/11. These increases do not represent new provision, but rather represent previously unreported students registered with an overseas partner for an award validated by the UK institution resulting from a clarification in the coverage of the Aggregate offshore record.
Definitions
The data presented in this SFR is based on the 2012/13 HESA Student and Aggregate offshore records. The statistics in this SFR are derived by HESA from data collected from all publicly funded HEIs in the UK (including The Open University - see definition 6) and The University of Buckingham, which is privately funded. The figures (in all tables except 1b) therefore exclude HE enrolments and qualifications obtained by students registered at UK further education colleges and at other private and independent UK HE colleges. The volume also includes summary statistics about study at higher education level in further education colleges Similar data for HE students enrolled at FE sector colleges (shown in Table 1b) are taken from individual student data collected by The Data Service (covering English FECs), the Scottish Funding Council, the Department for Children, Education, Lifelong Learning and Skills (Wales) and the Department for Employment and Learning Northern Ireland.
-
Higher education
Higher education (HE) students for the purpose of HESA's data collection are those students on courses for which the level of instruction is above that of level 3 of the Office of Qualifications and Examinations Regulation (Ofqual) Qualifications and Credit Framework (QCF), or the former Qualifications and Curriculum Authority (QCA) National Qualifications Framework (NQF) (e.g. courses at the level of Certificate of HE and above).
The HESA standard registration population has been derived from the HESA Student record, from all registered higher education and further education instances active at a reporting institution in the reporting period 1 August to 31 July, following courses that lead to the award of a qualification or institutional credit, and ensures that similar activity is counted in a similar way irrespective of when it occurs.
The reporting period for the 2012/13 Student record is 1 August 2012 to 31 July 2013.
-
Level of study/qualification obtained
Postgraduate courses are those leading to higher degrees, diplomas and certificates (including Postgraduate Certificate of Education (PGCE) and professional qualifications) and usually require that entrants are already qualified to degree level (i.e. already qualified at level H of the International Standard Classification of Education (ISCED) and Bologna frameworks). In analyses where postgraduate level of study is disaggregated into postgraduate (research) and postgraduate (taught), the following groupings are used:
Postgraduate (research) includes doctorate (incorporating New Route PhD), masters degrees and postgraduate diplomas or certificates (not Postgraduate Certificate in Education (PGCE) at level M) studied primarily through research.
Postgraduate (taught) includes doctorate, and masters degrees, postgraduate bachelors degrees at level M and postgraduate diplomas or certificates not studied primarily through research, including Postgraduate Certificate in Education (PGCE) at level M (unless shown separately), Masters in Teaching and Learning, level M Diploma in Teaching in the Lifelong Learning Sector, and professional qualifications.
First degree includes first degrees with or without eligibility to register to practice with a health or social care or veterinary statutory regulatory body, first degrees with Qualified Teacher Status (QTS)/registration with a General Teaching Council (GTC), enhanced first degrees (including those leading towards obtaining eligibility to register to practice with a health or social care or veterinary statutory regulatory body), first degrees obtained concurrently with a diploma and intercalated first degrees.
Foundation degrees (e.g. FdA, FdSc) were introduced to provide vocational higher education qualifications at level I.
Other undergraduate includes qualification aims equivalent to and below first degree level, such as Professional Graduate Certificate in Education (PGCE) at level H, foundation degrees, diplomas in HE with eligibility to register to practice with a health or social care or veterinary statutory regulatory body, Higher National Diploma (HND), Higher National Certificate (HNC), Diploma of Higher Education (DipHE), Certificate of Higher Education (CertHE), foundation courses at HE level, NVQ/SVQ levels 4 and 5, post-degree diplomas and certificates at undergraduate level (including those in Teaching in the Lifelong Learning Sector), professional qualifications at undergraduate level, other undergraduate diplomas and certificates including pre- and post-registration health and social care and veterinary courses, other formal HE qualifications of less than degree standard, institutional undergraduate credit and non-formal undergraduate qualifications.
Further education programmes of study (applicable to table 8 only) include diplomas, certificates and National Vocational Qualification (NVQ)/Scottish Vocational Qualification (SVQ) at level 3 and below, A/AS levels, Advanced Highers/Highers (Scotland), GCSEs, Intermediates (Scotland), HE Access courses, Welsh for Adults and other qualifications below higher education level.
-
Mode of study - enrolments
Full-time includes students recorded as studying full-time, normally required to attend an institution for periods amounting to at least 24 weeks within the year of study, plus those enrolled on a sandwich course (thick or thin), irrespective of whether or not they are in attendance at the institution or engaged in industrial training, and those on a study-related year out of their institution. During that time students are normally expected to undertake periods of study, tuition or work experience which amount to an average of at least 21 hours per week for a minimum of 24 weeks study/placement.
Part-time students are those recorded as studying part-time, or studying full-time on courses lasting less than 24 weeks, on block release, or studying during the evenings only.
Mode of study - qualifications obtained
Full-time students are those whose study was recorded as full-time (as described above), and also includes awards from dormant and writing-up status where the student's mode of study was previously full-time.
Part-time students are those whose study was recorded as part-time (as described above), and also includes awards from dormant and writing-up status where the student's mode of study was previously part-time, and awards given to those on sabbatical.
-
Domicile
UK domiciled students are those whose normal residence is in the UK, and for the purposes of this publication include Guernsey, Jersey and the Isle of Man. Officially, the Crown Dependencies of Guernsey, Jersey and the Isle of Man are not part of the UK or the EU. Guernsey and Jersey in this context refer to the Bailiwicks of Guernsey and Jersey, which includes their smaller islands.
Other European Union domiciled students are those whose normal residence prior to commencing their programme of study was in countries which were European Union (EU) members (excluding the UK) at 1 December of the reporting period. This includes Austria, Belgium, Bulgaria, Cyprus, Czech Republic, Denmark, Estonia, Finland, France, Germany, Gibraltar, Greece, Hungary, Ireland, Italy, Latvia, Lithuania, Luxembourg, Malta, Netherlands, Poland, Portugal, Romania, Slovakia, Slovenia, Spain and Sweden. Croatia, having joined the EU on 1 July 2013, is not included in 'Other European Union' for 2012/13 publications but will be treated as such from 2013/14 onwards.
Non-European-Union students are those whose normal residence prior to commencing their programme of study was outside the EU. Where Non-EU countries are shown separately, individual country figures exclude the country's overseas territories. These individual country figures are listed within the geographic region in which they lie.
-
Subject area
For 2012/13, a review of a selection of the subject areas of the JACS coding system resulted in the implementation of a revised version of the coding frame, 'JACS3'. The JACS2 version it replaced had been in existence since 2007/08. The full listing of JACS3, including a mapping between JACS2 and JACS3, can be found here. JACS3 and JACS2 are not directly comparable at any level other than subject area, although many codes have been retained in the newer coding frame. HESA has defined 19 subject areas for reporting information broken down by subject to present a set of distinct categories that can be compared over time. The subject areas do not overlap, and cover the entire range of JACS principal subjects. If a student is studying a combination of subjects, a procedure of apportionment is used:
For split courses not involving an initial teacher training (ITT) component, a percentage is assigned to each subject to reflect the split (from 2007/08 institutions could choose to assign their own percentages based on a broad assessment of the relative contribution of subjects to a course), with the following standard percentages recommended (obligatory in Scotland):
- Balanced 50% for each of the two subjects
- Major - Minor 67% and 33%
- Triple 34%, 33% and 33%..
Total - Science subject areas has been added to certain analyses. This is the sum of the following subject areas: medicine & dentistry; subjects allied to medicine; biological sciences; veterinary science; agriculture & related subjects; physical sciences; mathematical sciences; computer science; engineering & technology plus architecture, building & planning (i.e. sum of JACS codes A to K inclusive).
-
Location of institution
The allocation of an institution to a geographical region is done by reference to the administrative centre of that institution. There may be students registered at institutions who are studying in regions other than that of the administrative centre of the institution.
The Open University is counted as a wholly English institution, with the exception of Table 7. The administrative centre is located in England, although The Open University teaches throughout the UK.
-
Class of first degree
The classification of a first degree indicates the qualification class obtained. Certain qualifications obtained at first degree level are not subject to classification of award, notably medical and general degrees. These, together with ordinary degrees and aegrotat qualifications, have been included within Unclassified. Third class honours, fourth class honours and the pass have been aggregated as Third/pass. Lower second and undivided second class honours have been aggregated as Lower second. The percentage calculations included in this SFR are expressed excluding unclassified first degrees from the denominator.
-
First year
First year students are based on the HESA standard registration population who commenced their instance in the relevant reporting period. The term 'instance' is used to describe a student's engagement with the institution aiming towards the award of a qualification(s) or credit.
-
Sex
This field records the sex of the student, as opposed to the gender with which they identify. Other is included for students who associate with the terms intersex, androgyne, intergender, ambigender, gender fluid, polygender and gender queer. The specification of this field is based on the Recommendations on monitoring from ECU (Equality Challenge Unit). HESA does not, however, include a 'prefer not to say' option.
-
Students studying wholly overseas
These are students studying wholly outside the UK who are either registered with a reporting UK higher education institution or who are studying for an award of the reporting institution.
-
Location of provision
Within the European Union includes students whose location of study country was a European Union (EU) member state.
Guernsey, Jersey, and the Isle of Man, are counted as within the European Union for the purposes of this SFR.
-
Type of activity
Type of activity defines the arrangements under which overseas programmes are provided.
Students registered at a UK higher education institution includes:
Overseas campus of reporting institution includes those studying at a campus set up as a branch campus of the parent institution, and as such it is seen as no different from any other campus of the institution.
Distance, flexible or distributed learning denotes educational provision leading to an award of an awarding institution delivered and/or supported and/or assessed through means which generally do not require the student to attend particular classes or events at particular times and particular locations. There are a small number of distance learning students studying outside the UK who are funded (e.g. Crown servants overseas and the Services). These students are returned in the Student record and not included in the Aggregate offshore record.
Other arrangement including collaborative provision denotes provision leading to an award of an awarding institution delivered and/or supported and/or assessed through an arrangement with a partner organisation. Collaborative provision, sometimes described as 'franchised' provision includes consortia and joint award arrangements.
Students studying for an award of a UK higher education institution includes:
Students studying for an award of a UK HEI are not registered students of the reporting institution but are studying for an award of the reporting institution, and are registered at an overseas partner organisation or via some other arrangement.
-
Rounding strategy
In the text and tables the figures presented are rounded. 0, 1 and 2 are rounded to 0. All other numbers are rounded up or down, to the nearest 5. Percentages are calculated on the base data and are suppressed if they are calculated on a population which contains 52 or fewer individuals. These cases are represented as '..'.
Press enquiries should be directed to the Press office at the Higher Education Statistics Agency (HESA), 95 Promenade, Cheltenham, GL50 1HZ: Tel: 01242 211120. General enquiries about the data contained within this SFR should be addressed to Jenny Bermingham, Statistical Analyst, HESA (at the same address), telephone: 01242 211115.
Ends

Embargo
16 January 2014, 9:30
Coverage
UK
Themes
Children, education and skills
Issued by
HESA, 95 Promenade, Cheltenham, GL50 1HZ
Press enquiries
01242 211120
Public enquiries
01242 211133
Statistician
Jenny Bermingham


