Destinations of Leavers from Higher Education in the United Kingdom for the academic year 2013/14
Introduction
This Statistical First Release (SFR) has been produced by the Higher Education Statistics Agency (HESA), in collaboration with statisticians from the Department for Business, Innovation and Skills (BIS), the Welsh Government (WG), the Scottish Government (SG) and the Department for Employment and Learning Northern Ireland (DEL(NI)). It has been released according to the arrangements approved by the UK Statistics Authority. From 2012/13, the HESA constituency includes all UK publicly funded higher education institutions (HEIs) and a number of alternative providers (APs), collectively referred to as higher education providers (HEPs). This SFR, as in previous years, contains information regarding only the HEI element of this constituency and the University of Buckingham and therefore uses the term 'higher education providers (HEPs)'. The SFR provides details of the destinations of UK and other European Union domiciled leavers from higher education (HE) who obtained qualifications in higher education providers (HEPs) in the United Kingdom (UK), during the academic year 2013/14. The data presented draws on the 2013/14 Destinations of Leavers from Higher Education (DLHE) survey and presents time series analysis relating back to 2011/12 when the revised DLHE survey was introduced. Read the changes to the survey document [pdf 138 KB] for more detail on the changes made to the survey in 2011/12.
Due to the changes in the DLHE survey, the destination categories reported in the SFR from 2011/12 differ from those reported prior to this. Direct comparisons should not therefore be made between figures in this SFR and those presented in SFRs prior to 2011/12.
A notable change in this release is the allocation of The Open University (OU) leavers to England, Wales, Scotland and Northern Ireland. Previously all OU leavers were counted within England, where the OU has its administrative centre. From this release onwards, and in line with the HE Student enrolments and qualifiers 2013/14 statistical first release (SFR210), leavers registered at one of the OU’s national centres in Wales, Scotland and Northern Ireland will contribute to the totals of those countries where statistics are shown by country of HEP. Please note that all non-UK domicile OU students and those who studied at postgraduate research level are registered to the OU administrative centre in England. To provide a comparable time series, all tables, charts and commentary within this release have been produced using the new allocation method. For this year only, parallel tables using the old allocation method are provided here.
The coverage of the DLHE survey consists of all UK, European Union and Non-EU domiciled leavers for whom destinations data is expected and sought (see Definitions) from UK HEPs in 2013/14. The target population in 2013/14 was 698,930 (compared to 704,670 in 2012/13). For this SFR the following populations are excluded:
- Non-EU leavers. The Non-EU leavers were added to the target population from 2011/12 and from 2013/14 HEPs were set a target response rate of 20%. There were 134,725 Non-EU leavers in the target population (131,380 in 2012/13) of which 42,575 responded, an overall response rate of 32%. Response rates vary across the sector and by level and subject of study. Further analysis is required to assess how accurate a representation this data is for the population of Non-EU leavers as a whole. Therefore, the data for these leavers are excluded from the rest of the SFR.
- UK & EU leavers who obtained postgraduate research qualifications from dormant status are also excluded from this SFR as the destination outcomes of these leavers are considered to be materially different in nature to the outcomes of the other postgraduate research leavers included in the survey. In 2013/14, these leavers represented 2,850 UK and EU leavers in the target population (2,960 in 2012/13).
In 2013/14, there were 443,110 UK and EU leavers who responded from the target population of 564,205, an overall response rate of 79% (UK 80%, EU 59%). Response rates by level of qualification and domicile have been added to this SFR for 2013/14 in Table 1. For more information on the coverage of the DLHE Survey please refer to the Definitions.
Readers should be aware that data definitions sometimes change over time and this can affect validity of time series comparisons. Any significant changes have been explained in the Notes to tables and/or Definitions. Please note, key points have been derived from the Excel tables (these can be found below). Comparisons with previous year's data have only been included where they can be derived from these tables.
A HESA publication Destinations of Leavers from Higher Education 2013/14, setting out more information about the destinations of students qualifying from HEPs in the UK, will be published by HESA in July 2015.
Key Points - All UK HEPs
In 2013/14, there were 424,375 UK and EU leavers (398,105 UK, 26,270 EU) whose destinations were known (427,870 in 2012/13). Over two-thirds, 71% (303,300) of leavers (both full-time (70%, 244,045) and part-time (76%, 59,255)) were working, either in the UK or overseas, a slight increase from 70% of leavers in 2012/13. A further 6% were working and studying, 12% were involved in further study, 6% (full-time 6%, part-time 3%) were unemployed (the same as in 2012/13) and the remaining 5% were involved in some other activity, such as taking time out to travel or something else, see Definitions (Ref. Table 1).
In 2013/14, 7% of all male leavers (both full-time and part-time) whose destinations were known were unemployed, compared to 5% of all females (both full-time and part-time). The percentage who were unemployed decreased for male leavers compared to 2012/13 (8% for male and 5% for female leavers in 2012/13) (Ref. Table 2 and Table 3).
In 2013/14, there were 257,395 (244,025 in 2012/13) full-time first degree UK and EU leavers whose destinations were known, 70% (179,590) were in employment (either in the UK or overseas) and were not also studying, showing an increase from 69% in 2012/13. 7% (16,730) were unemployed compared to 8% (18,500) in 2012/13 (Ref. Table 2 and Chart 1).
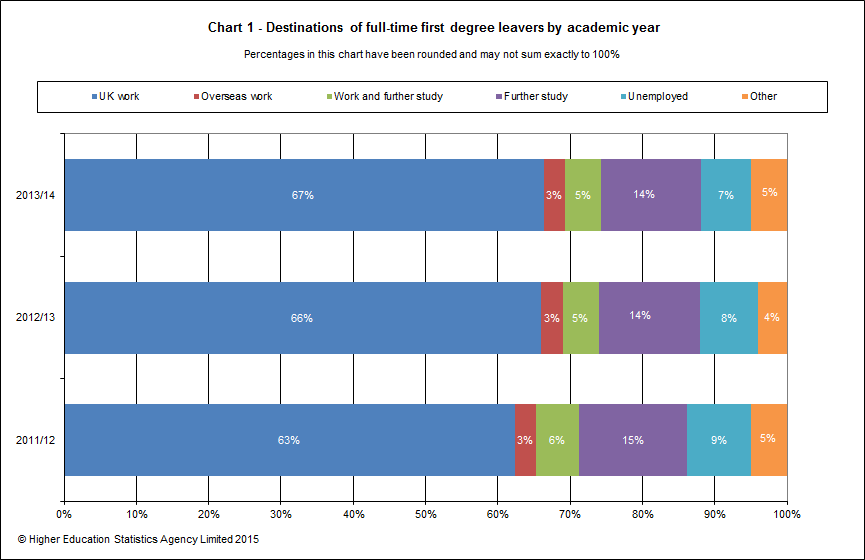
The percentage of full-time first degree leavers who were unemployed varied between subjects, ranging from those which have traditionally low percentages, such as Medicine & dentistry (less than 1%, although it should be noted numbers are small), Education (3%), Veterinary science (3%) and Subjects allied to medicine (3%) to those with higher percentages of unemployment such as Computer science (11%) and Mass communications & documentation (9%). For Science subject areas 71% of full-time first degree leavers were in employment (either in the UK or overseas) and 6% were unemployed. For other subject areas 69% were in UK or overseas employment and 7% were unemployed (Ref. Table 4).
In 2013/14, of the full-time first degree leavers who were employed in the UK, over two-thirds (68%) were in posts classified as Professional employment (66% in 2012/13). The remaining 32% were working in occupational groups classed as non-professional. Sales and customer service occupations accounted for 11% of all leavers in employment, the largest group in the Non-professional occupations. (Ref. Table 5a.) The DLHE survey gives an early indication of the occupations into which leavers are entering. These occupations may change over the leavers' careers, further information on progression is presented in the results of the Longitudinal DLHE survey which follows up leavers 3 years later.
Of full-time first degree graduates who were employed in the UK with known Standard Industrial Classification, 19% were in Human health and social work activities and 15% were in Wholesale and retail trade; repair of motor vehicles and motorcycles. The percentages of graduates in each classification varied by subject area (Ref. Table 5b).
Of those UK domiciled, first degree leavers (both full-time and part-time) reported as being in full-time paid employment in the UK in 2013/14, 70% disclosed their salary, a slight increase compared to 67% in 2012/13. The median salary reported (to the nearest £500) was £21,000 (£20,500 in 2012/13). The mean salary was £21,500 compared to £21,000 in 2012/13 (Ref. Table 6).
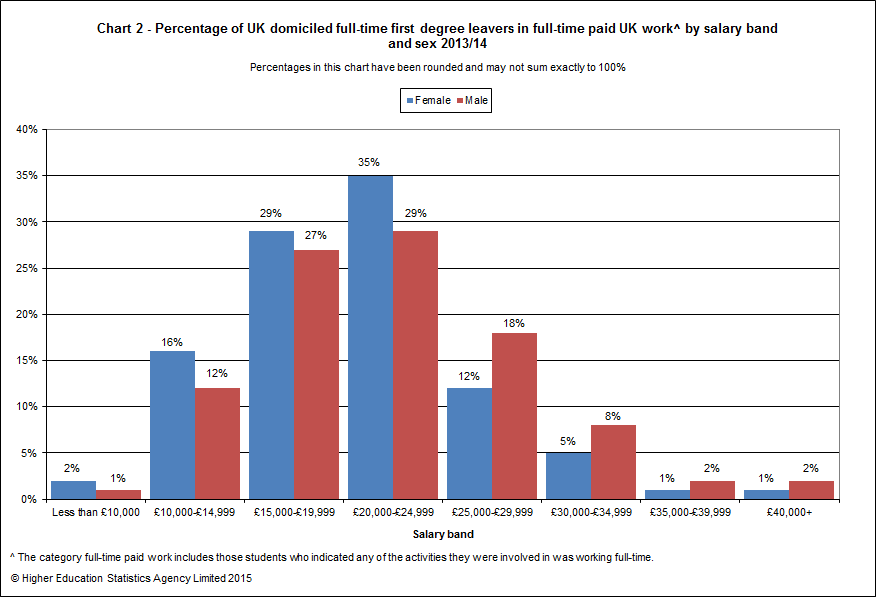
Chart 2 shows that a higher proportion of males than females have salaries of £25,000 or more. The difference between the salaries of males and females is also reflected in the mean and median values. The median salary for female leavers was £20,000 compared to £21,000 for males, and this difference is shown further by the mean salary, £20,500 for females compared to £22,500 for males. (Ref. Table 6.) Salaries also varied by subject of study and are shown in a new table (Ref. Table 7) in this SFR split by gender for full-time first degree leavers in full-time paid employment in the UK in 2013/14. The largest median salaries was reported by leavers who studied Medicine and dentistry (£30,000), Veterinary science (£26,000) and Engineering and technology (£25,000). Response to the salary question also varied by subject area, 80% of Mathematical science leavers declared their salary compared to 58% for Creative arts and design and 60% for Medicine and dentistry (Ref. Table 7).
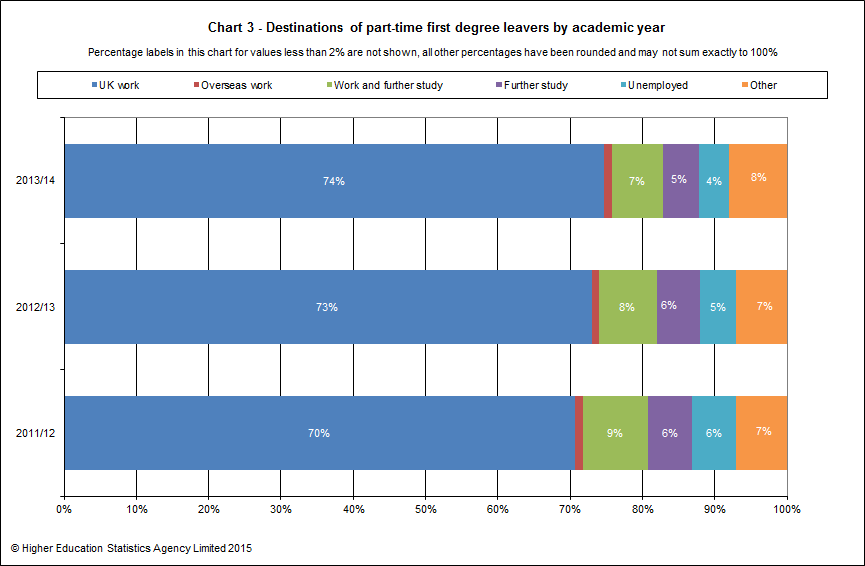
In 2013/14, there were 22,465 (23,615 in 2012/13) part-time first degree leavers whose destinations were known. Of these, 75% (16,860) were in employment (either in the UK or overseas) and were not also studying (74% in 2012/13) and 4% (975) were unemployed, compared to 5% in 2012/13 (Ref. Table 3 and Chart 3).
This SFR also includes information on postgraduate and other undergraduate leavers. Chart 4 shows that there is a considerable difference in the destinations of full-time leavers depending on the qualifications they had achieved. In 2013/14, 72% of full-time doctorate leavers were in employment compared to 67% for first degree leavers. Foundation degree leavers had the highest percentage entering further study at 44% compared to 14% of first degree leavers. A further 18% of foundation degree leavers entered work and further study.
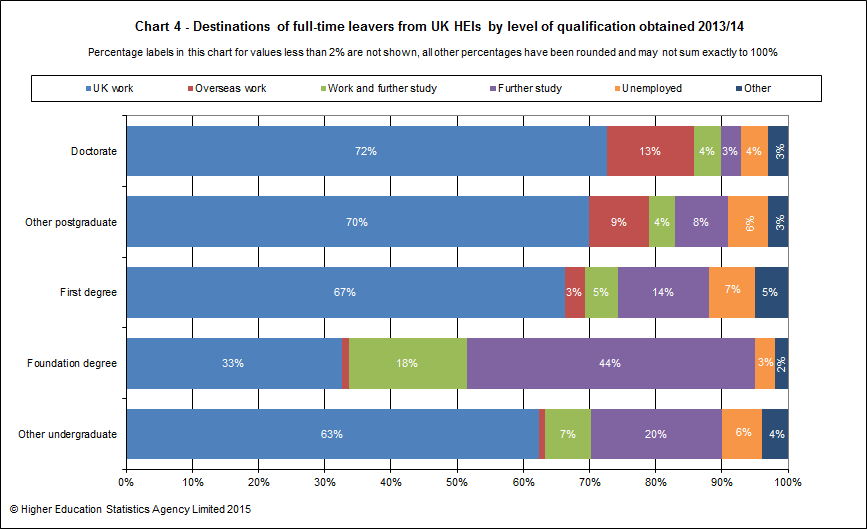
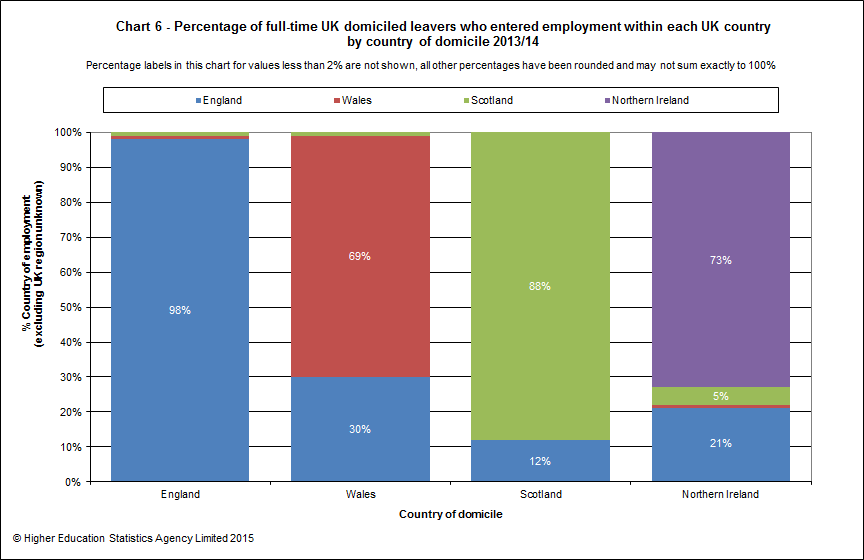
Chart 5 and Chart 6 present information on the movement of UK students from home to study and onto employment. They show the percentages of full-time UK domiciled leavers who entered employment in the UK by their country of domicile, country of HEP and country of employment.
Chart 5 shows that in 2013/14 the majority of full-time UK domiciled leavers who entered employment in the UK gained employment in the same country in which they studied, although this varied across the four countries from 98% in England to 57% in Wales.
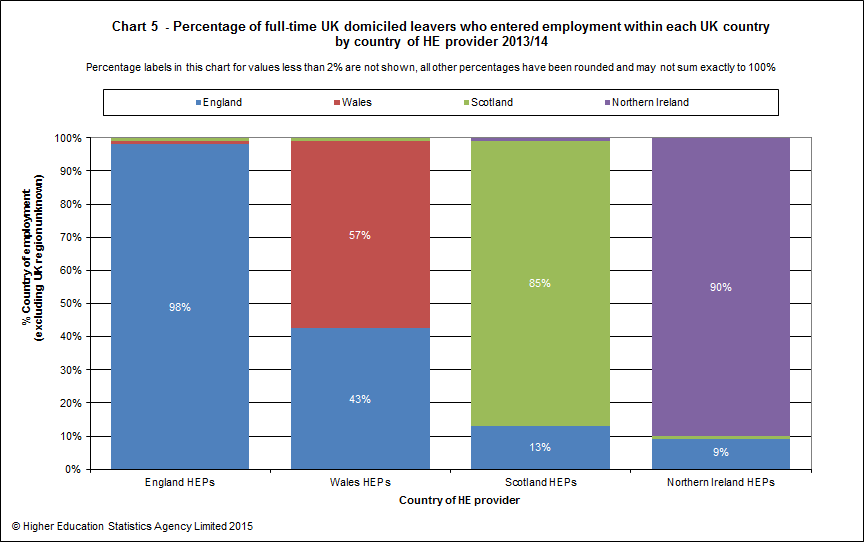
Chart 6 shows that in 2013/14 the majority of full-time UK domiciled leavers who entered employment in the UK gained employment in their original country of domicile. This varies across the four countries from a rate of 98% in England to 69% in Wales.
As noted for the purpose of this SFR, The Open University is no longer counted as a wholly English HEP and its students are counted within the country where their national centre is located rather than in England. Table 7 (Table 9 in the 2013/14 SFR) was included in the 2012/13 SFR to show this representation of leavers by their location of study and has been produced for the 2013/14 leavers. Of all part-time leavers of known destination, 15% studied at The Open University. For all part-time leavers 73% were in UK employment and 10% were in work and further study. For part-time leavers who studied at The Open University 61% were in UK employment and 15% were in a combination of work and further study (Ref. Table 9).
Key Points - England HEPs only
In 2013/14, there were 355,870 leavers from HEPs in England whose destinations were known (360,525 in 2012/13). Of these, 68% (243,670) were in UK employment (66% in 2012/13), 3% (12,225) were employed overseas, 6% (21,905) were in work and further study, 12% (42,045) were in further study, 4% (15,970) were engaged in other activities and 6% (20,060) were unemployed compared to 7% in 2012/13 (Ref. Table 2a, Table 3a and Chart 7).
In 2013/14, there were 215,915 full-time first degree leavers whose destinations were known (203,440 in 2012/13). Of these, 68% (145,935) were in UK employment (66% in 2012/13) and 7% (14,340) were unemployed compared to 8% in 2012/13 (Ref. Table 2a and Chart 7).
For Science subject areas 71% of full-time first degree leavers were in employment (either in the UK or overseas) and 6% were unemployed. For other subject areas 70% were in UK or overseas employment and 7% were unemployed (Ref. Table 4a).
In 2013/14, of the full-time first degree leavers who were employed in the UK, over two-thirds (68%) were in posts classified as Professional employment (66% in 2012/13). The remaining 32% were working in occupational groups classed as non-professional (Ref. Table 5a).
In 2013/14, of the 19,090 part-time first degree leavers whose destinations were known, 74% (14,075) were in UK employment (72% in 2012/13) and 5% (860) were unemployed (5% in 2012/13) (Ref. Table 3a and Chart 7).
Chart 7 shows the percentages of leavers in each destination by level of qualification obtained with a full-time/part-time split for first degree leavers.
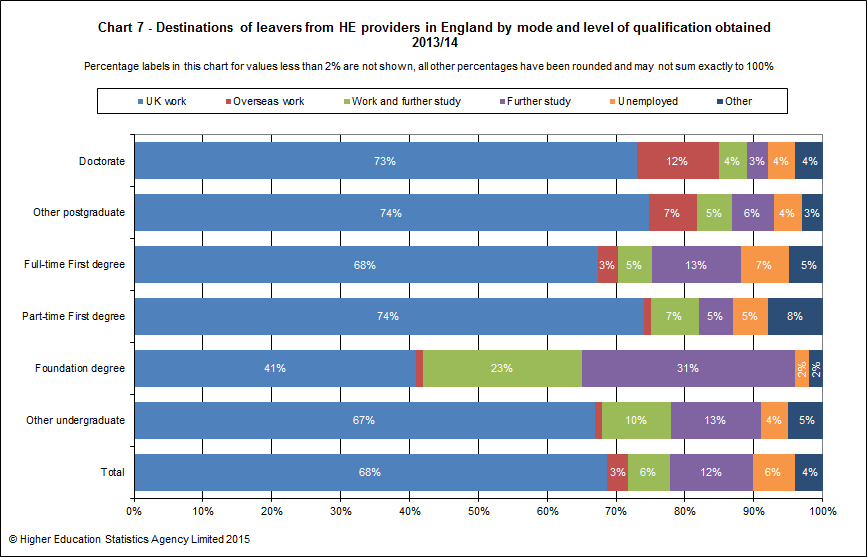
Of the 26,480 other undergraduate leavers (both full-time and part-time, excluding foundation degree) whose destinations were known, 67% (17,810) were in UK employment. Of the 75,095 other postgraduate leavers (both full-time and part-time, including Postgraduate Certificate in Education) whose destinations were known, 74% (55,565) were in UK employment and a further 7% (5,380) were working overseas (Ref. Table 2a, Table 3a and Chart 7).
In 2013/14, of those UK domiciled, first degree leavers (both full-time and part-time) reported as being in full-time paid employment in the UK, 71% disclosed their salary. The median salary reported (to the nearest £500) was £21,000, the lower quartile was £16,000 and the upper quartile £25,000. The mean salary was £21,500 (Ref. Table 6a).
Key Points - Wales HEPs only
In 2013/14, there were 22,750 leavers from HEPs in Wales whose destinations were known (22,130 in 2012/13). Of these, 66% (14,900) were in UK employment (63% in 2012/13), 3% (720) were employed overseas, 8% (1,860) were in work and further study, 14% (3,075) were in further study, 5% (1,030) were engaged in other activities and 5% (1,160) were unemployed (6% in 2012/13) (Ref. Table 2a, Table 3a and Chart 8).
In 2013/14, there were 14,640 full-time first degree leavers whose destinations were known (13,770 in 2012/13). Of these 64% (9,360) were in UK employment (62% in 2012/13) and 6% (860) were unemployed (7% in 2012/13) (Ref. Table 2a and Chart 8).
For Science subject areas 69% of full-time first degree leavers were in employment (either in the UK or overseas) and 5% were unemployed. For other subject areas 65% were in UK or overseas employment and 7% were unemployed (Ref. Table 4a).
In 2013/14, of the full-time first degree leavers who were employed in the UK, 62% were in posts classified as Professional employment (61% in 2012/13). The remaining 38% were working in occupational groups classed as non-professional (Ref. Table 5a).
In 2013/14, of the 965 part-time first degree leavers whose destinations were known, 69% (670) were in UK employment and 3% (30) were unemployed (Ref. Table 3a and Chart 8).
Chart 8 shows the percentages of leavers in each destination by level of qualification obtained with a full-time/part-time split for first degree leavers.
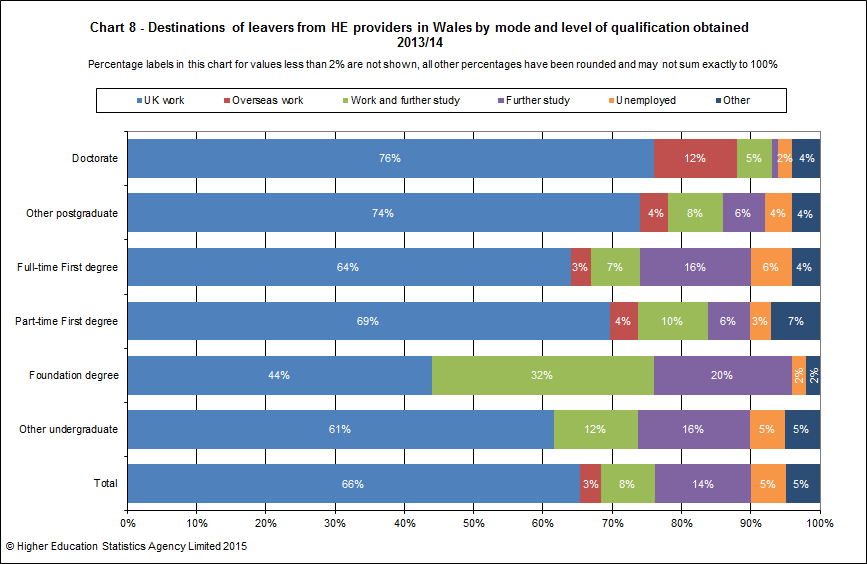
Of the 1,995 other undergraduate leavers (both full-time and part-time, excluding foundation degree) whose destinations were known 61%, (1,225) were in UK employment. Of the 4,150 other postgraduate leavers students (both full-time and part-time, including Postgraduate Certificate in Education) whose destinations were known, 74% (3,085) were in UK employment and 4% (185) were employed overseas (Ref. Table 2a, Table 3a and Chart 8).
In 2013/14, of those UK domiciled, first degree leavers (both full-time and part-time) reported as being in full-time paid employment in the UK, 64% disclosed their salary. The median salary reported (to the nearest £500) was £20,000, the lower quartile was £15,000 and the upper quartile £24,000. The mean salary was £20,000 (Ref. Table 6a).
Key Points - Scotland HEPs only
In 2013/14, there were 35,680 leavers from HEPs in Scotland whose destinations were known (34,860 in 2012/13). Of these, 64% (22,965) were in UK employment (64% in 2012/13), 5% (1,625) were employed overseas, 6% (2,115) were in work and further study, 15% (5,340) were in further study, 5% (1,770) were engaged in other activities and 5% (1,860) were unemployed (6% in 2012/13) (Ref. Table 2a, Table 3a and Chart 9).
In 2013/14, there were 20,740 full-time first degree leavers whose destinations were known (20,555 in 2012/13), 65% (13,490) were in UK employment (64% in 2012/13) and 6% (1,160) were unemployed (6% in 2012/13) (Ref. Table 2a and Chart 9).
For Science subject areas 70% of full-time first degree leavers were in employment (either in the UK or overseas) and 5% were unemployed. For other subject areas 66% were in UK or overseas employment and 6% were unemployed (Ref. Table 4a).
In 2013/14, of the full-time first degree leavers who were employed in the UK, 73% were in posts classified as Professional employment (69% in 2012/13). The remaining 27% were working in occupational groups classed as non-professional (Ref. Table 5a).
In 2013/14, of the 1,800 part-time first degree leavers whose destinations were known, 77% (1,385) were in UK employment and 3% (45) were unemployed (Ref. Table 3a and Chart 9).
Chart 9 shows the percentages of leavers in each destination by level of qualification obtained with a full-time/part-time split for first degree leavers.
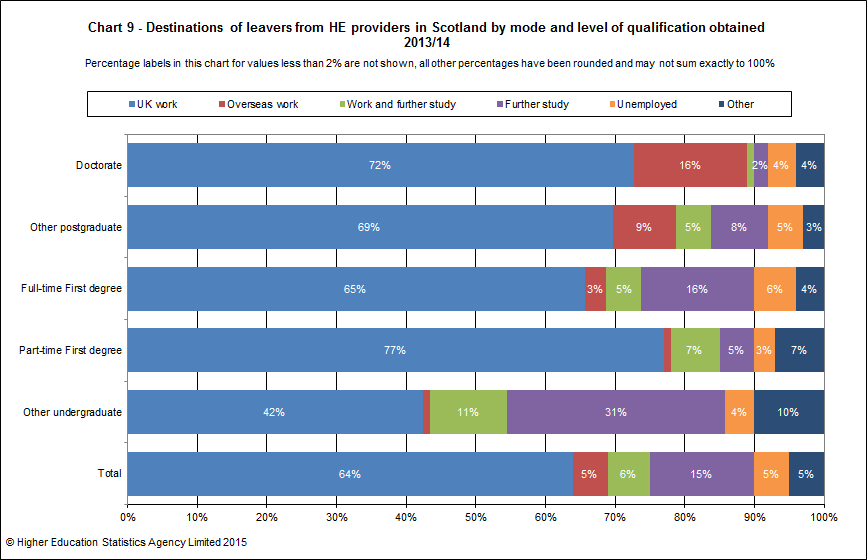
Of the 3,865 other undergraduate leavers (both full-time and part-time, excluding foundation degree) whose destinations were known, 42% (1,645) were in UK employment. Of the 8,455 other postgraduate leavers (both full-time and part-time, including Postgraduate Certificate in Education) whose destinations were known, 69% (5,860) were in UK employment and a further 9% (770) were employed overseas (Ref. Table 2a, Table 3a and Chart 9).
In 2013/14, of those UK domiciled, first degree leavers (both full-time and part-time) reported as being in full-time paid employment in the UK, 62% disclosed their salary. The median salary reported (to the nearest £500) was £22,000. The lower quartile was £18,000 and the upper quartile £26,000. The mean salary was £22,500 (Ref. Table 6a).
Key Points - Northern Ireland HEPs only
In 2013/14, there were 10,075 leavers from HEPs in Northern Ireland whose destinations were known (10,350 in 2012/13). Of these, 66% (6,640) were in UK employment (65% in 2012/13), 5% (545) were employed overseas, 8% (765) were in work and further study, 11% (1,140) were in further study, 4% (420) were engaged in other activities and 6% (555) were unemployed (7% in 2012/13) (Ref. Table 2a, Table 3a and Chart 10).
In 2013/14, there were 6,100 full-time first degree leavers whose destinations were known (6,260 in 2012/13). Of these 66% (4,010) were in UK employment compared to 64% in 2012/13 and 6% (375) were unemployed (8% in 2012/13) (Ref. Table 2a and Chart 10).
For Science subject areas 74% of full-time first degree leavers were in employment (either in the UK or overseas) and 6% were unemployed. For other subject areas 65% were in UK or overseas employment and 7% were unemployed (Ref. Table 4a).
In 2013/14, of the full-time first degree leavers who were employed in the UK, over two-thirds (68%) were in posts classified as Professional employment (63% in 2012/13). The remaining 32% were working in occupational groups classed as non-professional (Ref. Table 5a).
In 2013/14, of the 615 part-time first degree leavers whose destinations were known, 67% (410) were in UK employment and 6% (35) were unemployed (Ref. Table 3a and Chart 10).
Chart 10 shows the percentages of leavers in each destination by level of qualification obtained with a full-time/part-time split for first degree leavers.
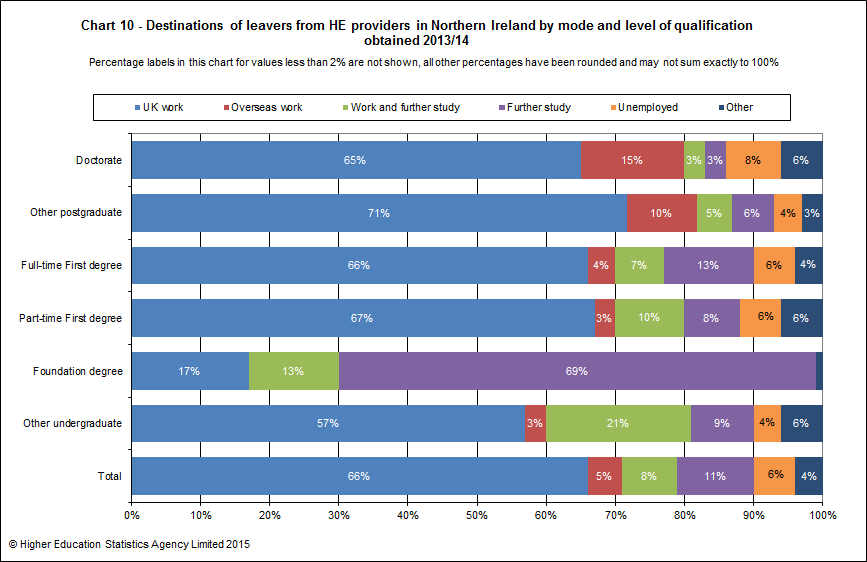
Of the 750 other undergraduate leavers (both full-time and part-time, excluding foundation degree) whose destinations were known, 57% (425) were in UK employment. Of the 2,305 other postgraduate leavers (both full-time and part-time, including Postgraduate Certificate in Education) whose destinations were known, 71% (1,640) were in UK employment and 10% (240) were employed overseas (Ref. Table 2a, Table 3a and Chart 10).
In 2013/14, of those UK domiciled, first degree leavers (both full-time and part-time) reported as being in full-time paid employment in the UK, 69% disclosed their salary. The median salary reported (to the nearest £500) was £20,000, the lower quartile was £15,000 and the upper quartile £23,000. The mean salary was £20,500 (Ref. Table 6a).
Tables
| Destinations of leavers by mode of qualification, domicile and activity 2013/14 | |
| Destinations of full-time leavers by sex, activity and level of qualification obtained 2011/12 to 2013/14 | |
| Destinations of full-time leavers by location of HEP, activity and level of qualification obtained 2011/12 to 2013/14 | |
| Destinations of part-time leavers by sex, activity and level of qualification obtained 2011/12 to 2013/14 | |
| Destinations of part-time leavers by location of HEP, activity and level of qualification obtained 2011/12 to 2013/14 | |
| Destinations of full-time first degree leavers by sex, activity and subject area 2011/12 to 2013/14 | |
| Destinations of full-time first degree leavers by location of HEP, activity and subject area 2011/12 to 2013/14 | |
| Occupation of full-time first degree leavers entering employment in the UK by location of HEP and subject area of degree 2011/12 to 2013/14 | |
| Industry of full-time first degree leavers entering employment in the UK by location of HEP and subject area of degree 2011/12 to 2013/14 | |
| UK domiciled leavers who obtained first degree qualifications and entered full-time paid work in the UK by mode of study, sex and salary 2011/12 to 2013/14 | |
| UK domiciled leavers who obtained first degree qualifications and entered full-time paid work in the UK by location of HEP, mode of study, sex and salary 2011/12 to 2013/14 | |
| UK domiciled full-time leavers who obtained first degree qualifications and entered full-time paid work in the UK by subject area, sex and salary 2013/14 | |
| UK domiciled full-time leavers who obtained first degree qualifications and entered full-time paid work in the UK by location of HEP, subject area, sex and salary 2013/14 | |
| Full-time UK domiciled leavers who entered employment within the UK by location of study, level of qualification obtained and location of employment 2011/12 to 2013/14 | |
| Full-time UK domiciled leavers who entered employment within the UK by domicile, level of qualification obtained and location of employment 2011/12 to 2013/14 | |
| Destinations of part-time leavers by location of HEP, Open University location, activity and level of qualification obtained 2013/14 |
None of the tables presented should be interpreted without reference to the Notes to tables and Definitions provided below.
Notes to tables
The United Kingdom Statistics Authority has designated these statistics as National Statistics, in accordance with the Statistics and Registration Service Act 2007 and signifying compliance with the Code of Practice for Official Statistics.
Designation can be broadly interpreted to mean that the statistics:
- Meet identified user needs
- Are well explained and readily accessible
- Are produced according to sound methods
- Are managed impartially and objectively in the public interest.
Once statistics have been designated as National Statistics it is a statutory requirement that the Code of Practice shall continue to be observed.
Definitions
The statistics in this SFR are derived by HESA from data collected from all publicly funded higher education providers (HEPs) in the UK (including The Open University) and The University of Buckingham, which is privately funded. The figures therefore exclude higher education (HE) qualifications obtained by students at further education colleges and at other private and independent HEPs.
The full set of definitions relating to the data in this release can be viewed online here.
- Coverage
- DLHE target and response
- Rounding strategy
- Activity publication category
- Domicile
- Level of qualification obtained
- Location of HEP
- Location of employment
- Mode of qualification
- Salary
- Sex
- Standard Industrial Classification
- Standard Occupational Classification (SOC) and Professional marker
- Subject of study
For data intelligence, please see the following webpage.
Press enquiries should be directed to the Press Office at the Higher Education Statistics Agency (HESA), 95 Promenade, Cheltenham, GL50 1HZ, telephone 01242 211120. General enquiries about the data contained within this SFR should be addressed to Jenny Bermingham, Senior Statistical Analyst, HESA (at the same address), telephone 01242 211115.
Ends

Embargo
25 June 2015, 9:30
Coverage
UK
Themes
Children, education and skills
Issued by
HESA, 95 Promenade, Cheltenham, GL50 1HZ
Press enquiries
01242 211120
Public enquiries
01242 211133
Statistician
Jenny Bermingham


