Breakdown of £29.4 billion expenditure
HESA publication 'Finances of Higher Education Providers 2013/14' released today.
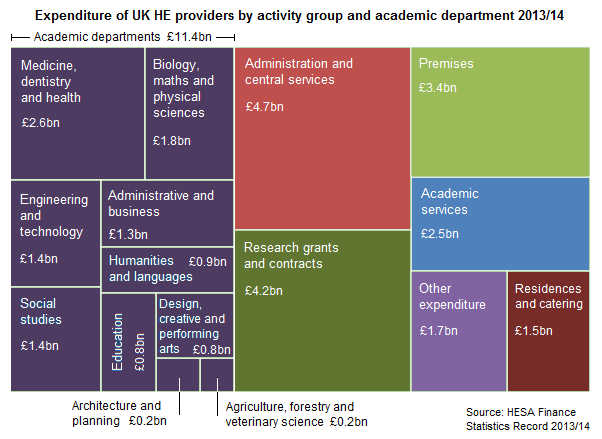
Finances of Higher Education Providers 2013/14 shows that UK HE providers had a total expenditure of £29.4 billion in 2013/14. £11.4bn (38.7% of the total) was spent through academic departments. Medicine, dentistry and health departments accounted for 8.9% of total expenditure.
The tree map and table below break down expenditure for the whole sector by activity. Expenditure activities are explained in the definitions. Expenditure by category (i.e. staff costs/interest/depreciation/other) can be found via Press Release 213.

| Expenditure of UK HE providers by activity group and academic department 2013/14 | ||
|---|---|---|
| Activity/department | Expenditure (£ thousands) | % of total expenditure |
| Academic departments, of which... | 11,394,586 | 38.7% |
| ...Medicine, dentistry and health | 2,628,643 | 8.9% |
| ...Biological, mathematical and physical sciences | 1,750,956 | 6.0% |
| ...Engineering and technology | 1,426,117 | 4.8% |
| ...Social studies | 1,422,787 | 4.8% |
| ...Administrative and business | 1,301,172 | 4.4% |
| ...Humanities and language based studies and archaeology | 907,910 | 3.1% |
| ...Education | 808,556 | 2.7% |
| ...Design, creative and performing arts | 750,811 | 2.6% |
| ...Architecture and planning | 224,026 | 0.8% |
| ...Agriculture, forestry and veterinary science | 173,608 | 0.6% |
| Administration and central services | 4,715,839 | 16.0% |
| Research grants and contracts | 4,209,602 | 14.3% |
| Premises | 3,398,072 | 11.6% |
| Academic services | 2,466,607 | 8.4% |
| Other expenditure | 1,726,417 | 5.9% |
| Residences and catering operations (including conferences) | 1,495,053 | 5.1% |
| Total expenditure | 29,406,176 | 100.0% |
| Source: HESA Finances of Higher Education Providers 2013/14. | ||
Finances publication
Finances of Higher Education Providers 2013/14 contains 12 tables of income and expenditure data at provider, regional and national level from the HESA Finance Statistics Return. Finances of Higher Education Providers 2013/14 is available to purchase and instantly download now from here.
The free online introduction to the publication includes sector level tables and charts covering balance sheet information, tuition fee and research income, and expenditure by type and department. Table 1 of the publication, showing income, expenditure and surplus/deficit of each UK HE provider, is published as a free online table.
Notes for Editors
- Press enquiries should be directed to:
- Simon Kemp
- HESA Press Officer
- 01242 211120
- [email protected]
- 95 Promenade, Cheltenham, GL50 1HZ.
- HESA Finance data is collected from all publicly funded higher education institutions (HEIs) in the UK, plus the University of Buckingham, which is a privately funded HE provider (collectively "higher education providers"). The 2013/14 data covers 161 HE providers (130 in England, 9 in Wales, 18 in Scotland and 4 in Northern Ireland).
- Financial data relates to the HE providers' financial year, i.e. 1 August 2013 to 31 July 2014.
- The definitions explain what is included within each expenditure activity.
- See data intelligence notes for any known issues with the 2013/14 HESA finance statistics.
- HESA cannot accept responsibility for any inferences or conclusions derived from the data by third parties.

Press Officer
