Performance Indicators 2009/10
The first set of Performance Indicators in Higher Education in the UK 2009/10 are published today.
The full tables, showing the indicators for each UK HE institution, are available from here.
Summary tables showing statistics for the whole UK can be found here.
Widening participation of under represented groups

More on widening participation of under-represented groups.
Non-continuation rates
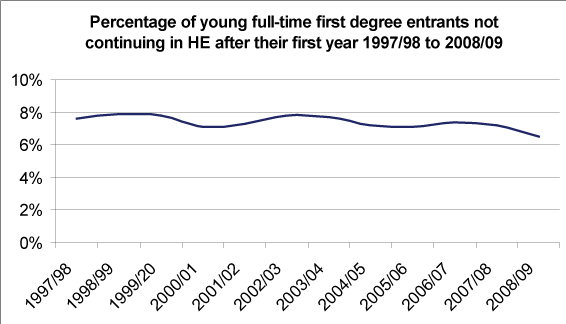
More on non-continuation rates.
About the Performance Indicators
The indicators are designed to provide information on the nature and performance of the higher education sector in the UK. They contribute to public accountability, and ensure that policy decisions are made on the basis of consistent and reliable information.
The Performance Indicators are specified by the Performance Indicators Steering Group (PISG) made up of funding bodies, government departments and representative bodies. They are calculated and published on behalf of PISG by HESA.
The Performance Indicators are published in two tranches. The first tranche of indicators, published on 31 March 2011, covers the following areas:
- Widening Participation indicators - the proportion of entrants from various under-represented groups such as state schools or colleges, specified socio-economic classes and low-participation neighbourhoods
- Students who are in receipt of Disabled Students’ Allowance (DSA)
- Non-continuation rates of full-time and part-time students
- Projected outcomes of full-time starters
- Module completion rates for part-time students at Welsh institutions.
The second tranche of Performance Indicators will be published on 15 July 2011 covering the following areas:
- Research output, looking at PhDs awarded, research grants obtained, academic staff costs and quality related research funding
- Employment of graduates.
What are the benchmarks?
Most of the areas above show an indicator for each institution and a benchmark. The indicator shows how well the institution performed. The benchmark is an adjusted average based on the characteristics of each institution. Benchmarks are adjusted according to the subject mix offered, age profile of students and qualifications of students on entry.
The benchmark can be used in two ways:
- To see how well an HEI is performing compared to the HE sector as a whole
- To decide whether it is meaningful to compare two institutions – for example it probably isn’t worth comparing a specialist art college with a large university offering a wide range of subjects.
The benchmarks are not government targets or quotas. However, some institutions do choose to refer to them as measures of their performance within their agreements with the Office for Fair Access (OFFA).
For more information on benchmarks please see the “Guide to PIs” accompanying the Performance Indicators: http://www.hesa.ac.uk/pis/09/10/guide
Notes for editors
General enquiries should be directed to:
- HESA PI Team
- +44 (0) 1242 211115
- [email protected]
- HESA Press Office
- +44 (0) 1242 211120
- [email protected]
Enquiries regarding how the Performance Indicators are defined and specified, and widening participation policy, should be addressed to PISG via the HEFCE Press Office telephone 0117 931 7363/7431.
Full text and tables of Performance Indicators in Higher Education in the UK 2009/10 can be found on our website from Thursday 31 March 2011 from 09:30. As in previous years, the indicators are set out in separate tables. Not all higher education institutions feature in every table. Performance Indicators prior to 2002/03 have been published by the Higher Education Funding Council for England and are available at www.hefce.ac.uk/data/pi/.
Ends