The value of a non-financial job quality measure in exploring graduate outcomes - Summary
This briefing provides an overview of a new non-monetary job quality composite measure developed by the Higher Education Statistics Agency (HESA) using the Graduate Outcomes survey.
Over time, we envisage introducing this measure into our official statistics publications to ensure that our outputs continue to remain valuable and relevant to users at a time of increasing interest in job quality.
The full technical report associated with this summary can be accessed via links on the side of this webpage.
 Why does job quality matter?
Decent work for all is one of the objectives set out in the 2015 Sustainable Development Goals outlined by the United Nations, as we highlight below. As a member state, this target also applies to the UK.
By 2030, achieve full and productive employment and decent work for all men and women, including for young people and persons with disabilities.
Naturally, this has led to a debate on what we mean by terms such as ‘decent work’ and ‘job quality’.
 How do we define 'job quality'?
The general consensus that appears to be emerging in the literature is that job quality relates to those aspects of an individual’s work that influence their wellbeing.
In the UK, the Measuring Job Quality Working Group was assigned the task of deciding what indicators should be used to understand job quality.
What are the agreed job quality indicators for the UK?
The group concluded that data on job quality should be covered by eighteen indicators, which themselves sit within seven broad dimensions.
| 1. |
Terms of employment (job security, minimum guaranteed hours, underemployment) |
 |
| 2. | Pay and benefits (actual pay, satisfaction with pay) |  |
| 3. | Health, safety and psychosocial wellbeing (physical injury, mental health) |  |
| 4. | Job design and nature of work (use of skills, control, opportunities for progression, sense of purpose) |  |
| 5. | Social support and cohesion (peer support, line manager relationship) |  |
| 6. | Voice and representation (trade union membership, employee information, employee involvement) |  |
| 7. | Work-life balance (over-employment, paid and unpaid overtime) |  |
 How have we historically explored graduate job quality in the UK?
The examination of graduate destinations has focused predominantly on two outcomes (only one of which is a marker of job quality based on the agreed approach).
These are earnings and whether they are in ‘highly skilled’ employment (i.e. in a professional or managerial job).
According to the framework developed by the Measuring Job Quality Working Group, being in ‘highly skilled’ employment is not an indicator of job quality, though it has been assumed that these are the jobs which align with graduate progression aspirations and use their skills (both markers of job quality).
However, the validity of this presumption has not been investigated through the use of data.
 Why shouldn’t we only use earnings to understand graduate outcomes/job quality?
Graduates themselves have noted that better earnings are not the only benefit they expect from studying for a degree. Rather, they are also looking for careers that allow them to use their skills and make a meaningful impact.
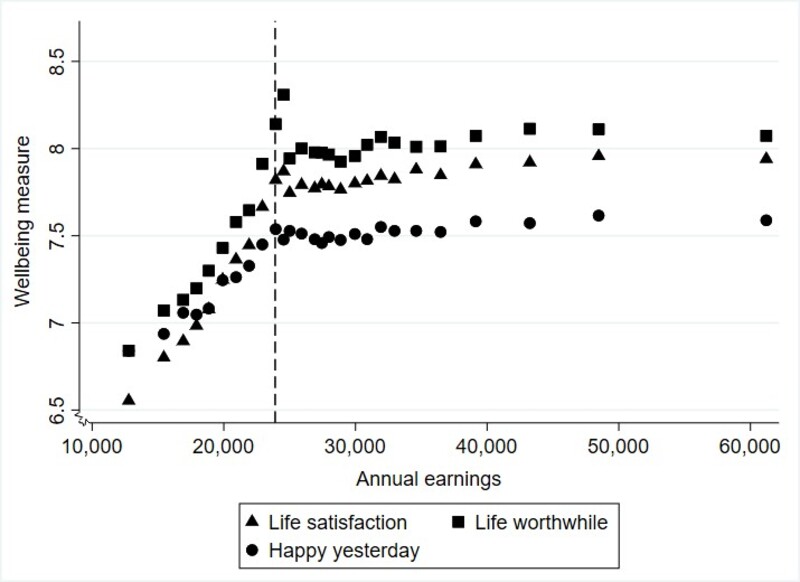
Additionally, job quality indicators should be correlated with wellbeing. Yet, evidence from our Graduate Outcomes survey suggests that an association between earnings and wellbeing only emerges for those earning up to approximately £24,000. Thereafter, there is no evident pattern.
This finding holds whether we focus on absolute values or percentage changes for earnings.
You can find a chart illustrating the association between earnings and wellbeing in the ‘Read more’ section.
After the financial crisis, it was concluded that individual and societal progress needed to be judged by more than just monetary values.
The lack of a clear association between earnings and wellbeing across the full wage distribution suggests earnings data will not necessarily be an informative guide to the non-monetary outcomes experienced by graduates.
In the Graduate Outcomes survey, graduates are asked to rate the below aspects of their life on an 11-point scale that goes from 0 to 10, where 0 represents ‘not at all’ and 10 indicates ‘completely’.
- Overall, how satisfied are you with your life nowadays?
- Overall, to what extent do you feel that the things you do in your life are worthwhile?
- Overall, how happy did you feel yesterday?
The chart beneath shows the correlation between these three wellbeing measures and graduate earnings.
 Can the Graduate Outcomes survey help us to understand more about job quality (beyond just earnings)?
Yes. In particular, we are able to look at indicators relating to the design and nature of work dimension of job quality.
This encompasses aspects such as skills use, the extent to which work is meaningful and whether the role provides suitable progression opportunities.
In Graduate Outcomes, we ask questions on all three of these matters.
 Should information on these three job quality indicators be summarised into a single composite measure?
The Measuring Job Quality Working Group advise that, where possible, a measure should be formed for each dimension based on the indicators that sit within that component.
Distilling (eighteen) separate indicators into (seven) composite measures can make it easier to understand and communicate general patterns in job quality.
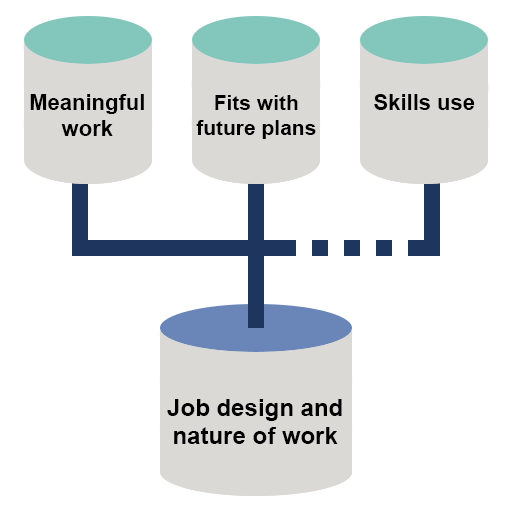
We therefore follow the recommendation of the group and devise a composite measure called ‘job design and nature of work’ to cover this dimension of job quality.
 How did you create a composite measure called ‘job design and nature of work’?
There is a section in the survey that asks graduates in employment to highlight the extent to which they agree or disagree with the following three statements:
- My current work is meaningful
- My current work fits with my future plans
- I am utilising what I learnt during my studies in my current work
A Likert scale is used that comprises five options ranging from strongly disagree to strongly agree (graduates are asked to choose one of these in each instance).
Each response is assigned a value (1 – strongly disagree, 2 – disagree, 3 – neither agree nor disagree, 4 – agree, 5 – strongly agree).
We take an average of the three responses. The final composite measure is therefore a continuous variable that also ranges from 1 to 5. A higher score would indicate better quality work.
Our technical report provides further details on the validity of our methodology.
 What is the association between this composite measure and wellbeing?
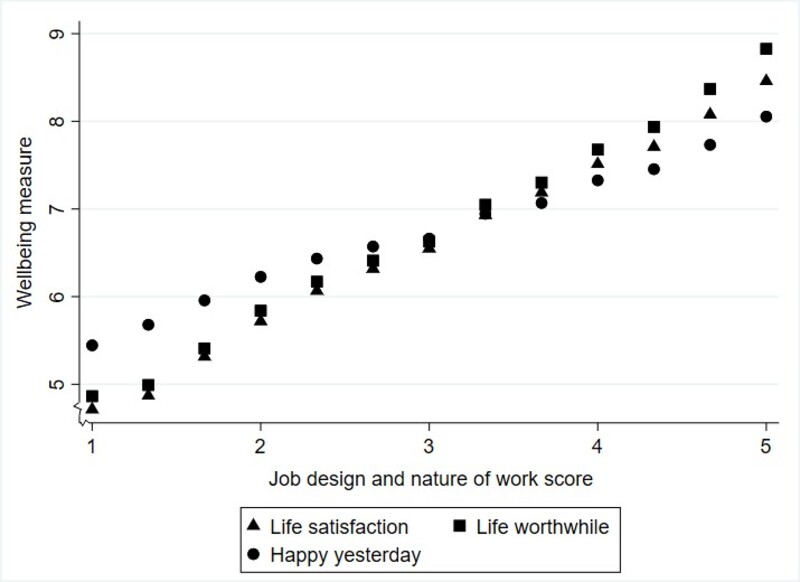
There is a clear linear correlation between the ‘job design and nature of work’ composite measure and wellbeing, as would be expected from an indicator of job quality.
That is, a higher ‘job design and nature of work’ score is associated with higher wellbeing (the ‘Read more’ section provides a chart that demonstrates this).
In the Graduate Outcomes survey, graduates are asked to rate the below aspects of their life on an 11-point scale that goes from 0 to 10, where 0 represents ‘not at all’ and 10 indicates ‘completely’.
- Overall, how satisfied are you with your life nowadays?
- Overall, to what extent do you feel that the things you do in your life are worthwhile?
- Overall, how happy did you feel yesterday?
The chart beneath shows the correlation between these three wellbeing measures and our ‘job design and nature of work’ measure.
 How do we determine whether a job can be defined as being ‘highly skilled’ (i.e. a professional or managerial role)?
In the UK, the Office for National Statistics classifies jobs into categories based on the skills needed for the job and the type of work/knowledge involved.
There are nine major groups and the 'See the data' section below has a table that indicates which are considered to be the ‘highly skilled’ (i.e. professional or managerial) occupations.
Analysis of graduate outcomes in the UK has tended to focus on the proportion of graduates who work in these ‘highly skilled’ roles.
| Table 1: The definition of 'highly skilled' occupations in the analysis of graduate outcomes | |
|---|---|
| Category | Considered to be 'highly skilled' occupations? |
| Managers, directors and senior officials | Yes |
| Professional occupations | Yes |
| Associate professional occupations | Yes |
| Administrative and secretarial occupations | No |
| Skilled trades occupations | No |
| Caring, leisure and other service occupations | No |
| Sales and customer service occupations | No |
| Process, plant and machine operatives | No |
| Elementary occupations | No |
 Is it always the case that ‘highly skilled’ jobs require higher education qualifications?
In the Graduate Outcomes survey, we ask graduates to self-assess whether they needed their qualification to secure their job (or whether it was an advantage).
The 'See the data' section below has a table that illustrates how responses to this question are associated with occupation categories.
As can be seen, there are a sizeable proportion of managerial roles that do not appear to require higher education qualifications from the graduate’s point of view.
On the other hand, a considerable fraction of administrative and secretarial occupations, skilled trades occupations, as well as caring, leisure and other service occupations have been judged by graduates to either require these qualifications or are deemed beneficial for the role.
| Table 2: Whether a higher education qualification was required/beneficial for the graduate in securing their job (NR - Not required, R - Required/Advantage) | ||||
|---|---|---|---|---|
| Occupational group | NR (%) | R (%) | Not known (%) | Sample size |
| Managers, directors and senior officials | 37.4 | 61.9 | 0.8 | 10,295 |
| Professional occupations | 9.1 | 90.2 | 0.7 | 159,115 |
| Associate professional occupations | 21.1 | 77.8 | 1.1 | 54,315 |
| Administrative and secretarial occupations | 44.5 | 54.1 | 1.4 | 18,820 |
| Skilled trades occupations | 55.0 | 44.2 | 0.8 | 3,240 |
| Caring, leisure and other service occupations | 48.6 | 50.2 | 1.2 | 14,015 |
| Sales and customer service occupations | 77.6 | 21.4 | 1.0 | 14,405 |
| Process, plant and machine operatives | 71.0 | 27.8 | 1.2 | 1,350 |
| Elementary occupations | 89.0 | 10.4 | 0.6 | 10,180 |
| Not known | 42.9 | 49.4 | 7.7 | 505 |
 What’s the association between the ‘job design and nature of work’ measure and occupation types?
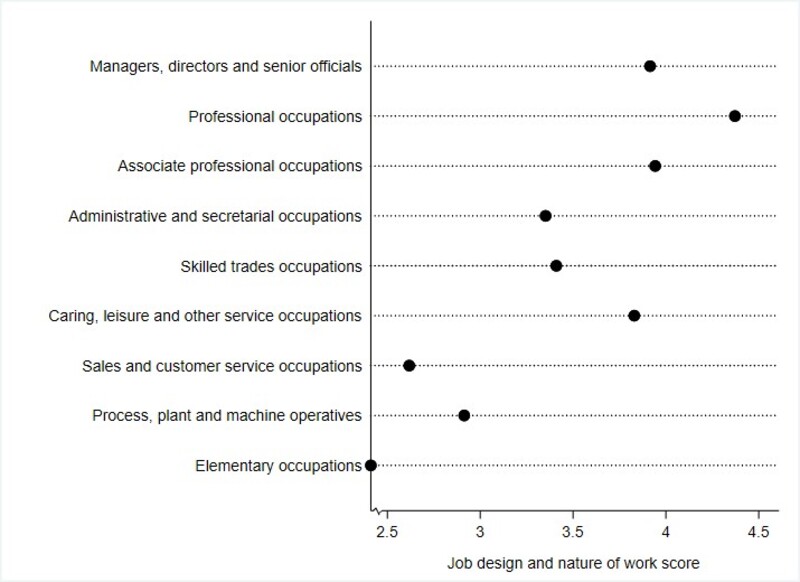
If one looks solely at a chart demonstrating the link between these two variables (supplied in the ‘Read more’ section), they would observe that the three occupation groups classified as ‘highly skilled’ also have the highest ‘job design and nature of work’ scores.
The chart below highlights the association between occupation type and the ‘job design and nature of work’.
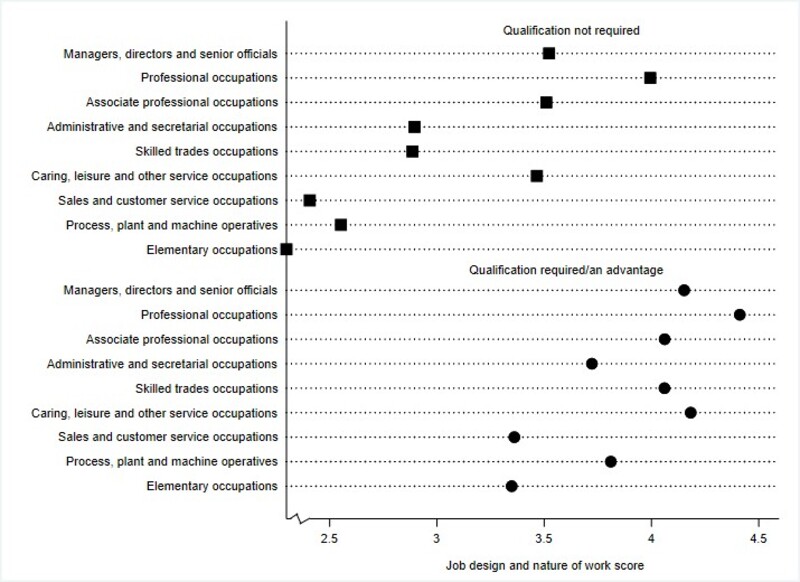
 Does the association between the ‘job design and nature of work’ change if we introduce additional variables into the exploration?
Previous research has noted that, for UK graduates, skills use in a role tends to be greater in instances where the qualification was deemed as being required or useful for their job.
Given what was found in Table 2 however, we also assessed the relationship between the ‘job design and nature of work’ measure and occupation types based on whether or not the graduate indicated their qualification was required/advantageous for their role (see chart in the ‘Read more’ section).
Doing so illustrates that the pattern is not as definitive as the initial analysis might indicate.
The (nearly) two-fifths of managerial roles that don’t require the graduate’s qualifications display lower ‘job design and nature of work’ scores, on average, than the (almost half of) jobs in skilled trades occupations and caring, leisure and other service occupations which do require/benefit from such qualifications.
The chart below illustrates the key findings discussed above.
 What are the key take-away messages from this analysis?
Based on the views submitted by graduates, it does not appear that it can be assumed that professional or managerial roles are always those that utilise graduate skills and align with their career aspirations, as has traditionally been the case.
Taken together with the points we make above about earnings, our ‘job design and nature of work’ measure can be a useful addition to statistics produced on graduate outcomes and help to enhance our knowledge on the quality of their jobs.
 How might the ‘job design and nature of work’ be of benefit to (prospective) students?
The introduction of this measure into statistical publications may help students to be better informed about the potential implications of particular education choices (especially given research suggests that they are not only interested in the financial benefits of completing a degree).
For example, while it is well known that those who study Economics tend to earn the most (alongside Medicine graduates), the table in the 'See the data' section below highlights that those who studied Economics do not have the highest ‘job design and nature of work’ scores.
| Table 3: Summary statistics on the 'job design and nature of work' score and subject area of study | ||
|---|---|---|
| Subject area of study | Mean 'job design and nature of work' score | Sample size |
| Agriculture & related subjects | 3.96 | 2,710 |
| Architecture, building and planning | 4.17 | 6,730 |
| Biological sciences | 3.80 | 25,900 |
| Business & administrative studies | 3.85 | 30,790 |
| Combined | 3.74 | 1,160 |
| Computer science | 3.98 | 10,970 |
| Creative arts & design | 3.44 | 13,295 |
| Economics | 3.78 | 3,800 |
| Education | 4.43 | 35,300 |
| Engineering & technology | 3.97 | 17,025 |
| Historical & philosophical studies | 3.60 | 8,270 |
| Languages | 3.61 | 8,350 |
| Law | 3.97 | 10,285 |
| Mass communications & documentation | 3.62 | 5,000 |
| Mathematical sciences | 3.83 | 4,290 |
| Medicine & dentistry | 4.60 | 8,740 |
| Physical sciences | 3.79 | 11,805 |
| Social studies | 3.88 | 21,470 |
| Subjects allied to medicine | 4.42 | 40,725 |
| Veterinary science | 4.54 | 875 |
| Multiple subject areas studied | 3.77 | 18,740 |
 How might the ‘job design and nature of work’ be utilised by graduate employers/policymakers?
The application of the measure in statistical outputs could also help to highlight inequalities in the labour market.
For instance, as we show in the technical paper, while evidence suggests that there are minimal ethnic disparities in graduate earnings, the same is not true when it comes to the ‘job design and nature of work’.
All ethnic minorities display lower ‘job design and nature of work’ scores and significant differences remain even after accounting for personal, study and employment characteristics.
| Table 4: Summary statistics on the 'job design and nature of work' score and ethnicity (before controlling for personal, study and employment characteristics) | ||
|---|---|---|
| Ethnicity | Mean 'job design and nature of work' score | Sample size |
| White | 4.02 | 228,570 |
| Indian | 3.98 | 9,470 |
| Pakistani | 3.92 | 6,585 |
| Bangladeshi | 3.81 | 3,410 |
| Chinese | 3.90 | 2,200 |
| Black African | 3.91 | 11,650 |
| Black Caribbean | 3.84 | 3,370 |
| Other | 3.90 | 17,140 |
| Not known | 4.09 | 3,840 |

Contents
- Summary
- Abstract
- 1. Introduction
- 2. Data
- 3. Methods
- 4. Associations with wellbeing and employment
- 5. Decent work for all?
- 6. Concluding remarks
- References
- Appendix
Download research paper as PDF