Destinations of Leavers from Higher Education in the United Kingdom for the academic year 2010/11
Introduction
This Statistical First Release (SFR) has been produced by the Higher Education Statistics Agency (HESA), in collaboration with statisticians from the Department for Business, Innovation and Skills (BIS), the Welsh Government (WG), the Scottish Government (SG) and the Department for Employment and Learning Northern Ireland (DEL(NI)). It has been released according to the arrangements approved by the UK Statistics Authority. It provides details of the destinations of UK and other European Union domiciled leavers from higher education (HE) who obtained qualifications in higher education institutions (HEIs) in the United Kingdom (UK), during the academic year 2010/11. The data presented draws on the 2010/11 Destinations of Leavers from Higher Education (DLHE) survey and presents five year time series analyses relating to the 2006/07-2010/11 DLHE surveys.
Key Points - All UK HEIs
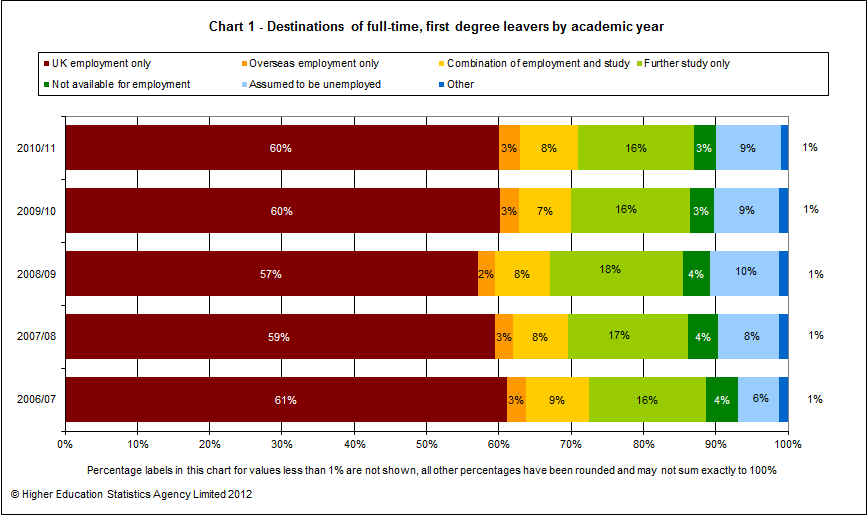
In 2010/11 there were 224,045 full-time first degree graduates whose destinations were known, compared to 213,390 in 2009/10. In 2010/11, 63% (140,085) were in employment only and 9% (20,620) were assumed to be unemployed both showing no change since 2009/10 (See Table 1 and Chart 1).
In 2010/11, of the full-time first degree graduates whose destinations were known and reported as being in employment only, 95% (133,660) were employed in the UK, compared to 96% in 2009/10 (See Table 1).
Over the time series shown in this SFR, the proportion of full-time first degree leavers in employment and/or study has decreased from 89% in 2006/07 to a low of 85% in 2008/09 increasing to 86% in 2010/11. The proportion who were assumed to be unemployed has increased from 6% in 2006/07 to 9% in 2010/11, reaching a high of 10% in 2008/09 (See Table 1 and Chart 1).
In 2010/11 of the full-time first degree graduates who were employed in the UK, 31% of these posts were classified as Associate professional & technical occupations, the same as in 2009/10. 24% were classified as Professional occupations, 25% in 2009/10; 14% as Sales & customer service occupations, 13% in 2009/10, and 9% as Administrative & secretarial occupations, the same as in 2009/10. These are the occupational groups with the highest proportions of leavers (See Table 4a).
Unemployment rates for full-time first degree graduates whose destinations were known varied between subjects, ranging from those which have traditionally low rates of unemployment, such as Medicine & dentistry (0%), Education 5% and Subjects allied to medicine 6% to those with higher rates of unemployment, such as, Mass communications & documentation (12%), Creative arts & design (12%) and for Computer science (14%) (See Table 3).
Of those UK domiciled, first degree graduates (both full-time and part-time) reported as being in full-time paid employment (excluding self-employed) in the UK in 2010/11, 69% disclosed their salary compared to 55% in 2009/10. This large increase can be attributed to a slight change in the wording of the question on the survey. (See note to editor 6). The median salary reported (to the nearest £500) was £20,000, the same as 2009/10. The mean salary increased to £21,000 from £20,500 in 2009/10 (See Table 5).
For UK domiciled, full-time first degree graduates who entered full-time paid employment in the UK and provided salary information the mean salary has increased from £19,500 in 2006/07 to £20,000 in 2010/11.
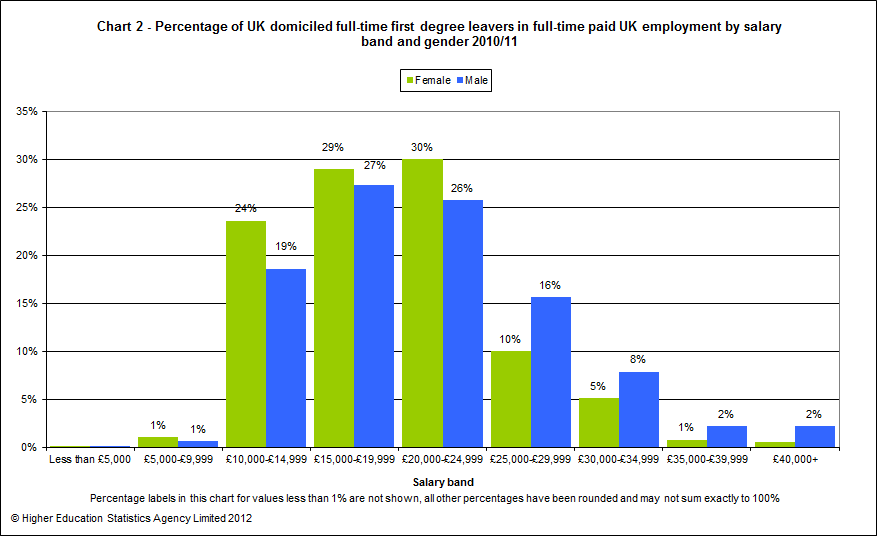
Chart 2 shows that a higher proportion of males than females have salaries of £25,000 or more. The difference between the salaries of males and females is further reflected in the mean and median values (not shown in the chart), the median salary for female leavers was £18,500 compared to £20,000 for males, and the mean salary showed a larger difference, £19,000 for females compared to £21,000 for males (See note to editors 10).
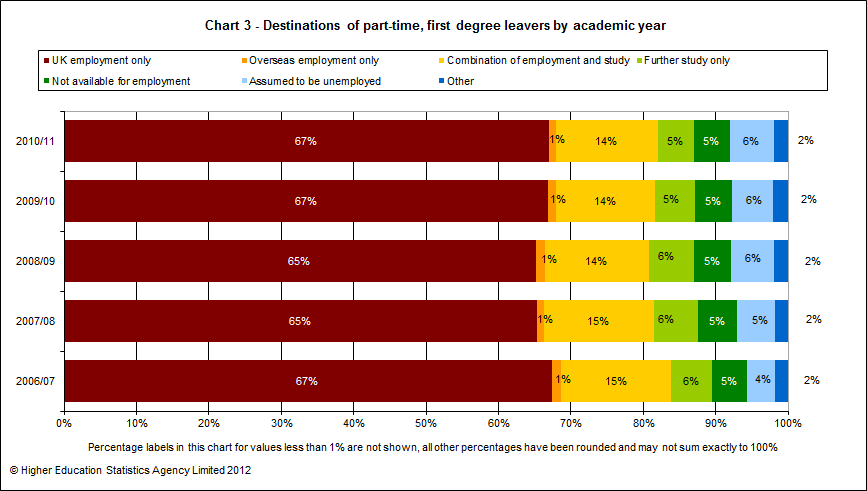
In 2010/11, there were 22,310 part-time first degree graduates whose destinations were known compared to 22,540 in 2009/10. The percentages involved in each activity showed no change from the previous year (See Table 2 and Chart 3).
The proportion of part-time first degree leavers in employment and/or further study decreased from 90% in 2006/07 to 87% in 2008/09 and has remained at that level to date.
This SFR also includes information on postgraduate and other undergraduate leavers. Looking at Chart 4, it can be seen that there is a considerable difference in the destinations of full-time leavers depending on the qualifications they have achieved. This is particularly noticeable for leavers entering employment only; 88% of full-time PGCE leavers in 2010/11 were in employment only compared to 30% for foundation degrees. The percentages entering further study only also varied from 1% for PGCE leavers to 44% for foundation degree leavers.
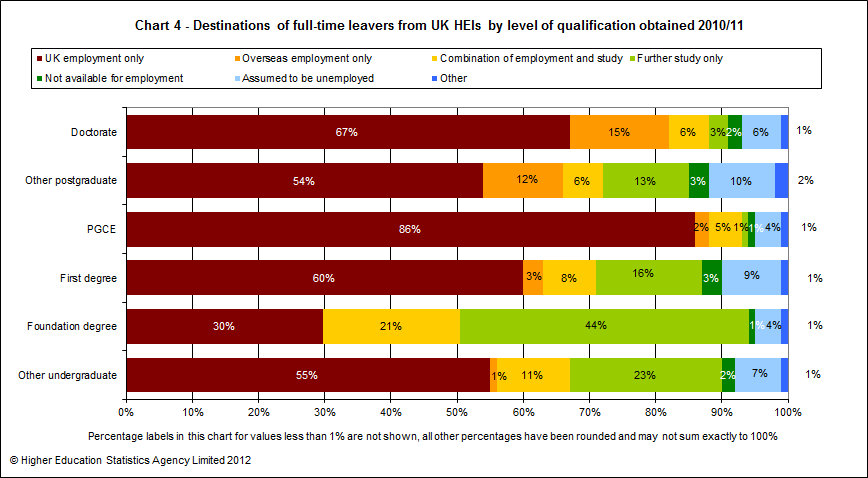
The proportion of full-time other undergraduate leavers (excluding foundation degree and Professional Graduate Certificate in Education) in employment and/or further study decreased from 92% in 2006/07 to 89% in 2010/11 (See Table 1).
The proportion of full-time other postgraduate leavers (excluding Postgraduate Certificate in Education) in employment and/or further study decreased steadily from 90% in 2006/07 to 86% in 2010/11 (See Table 1).
Overall, in 2010/11 9% of all males leavers (both full-time and part-time) whose destinations were known were assumed to be unemployed, compared to 6% of all females (both full-time and part-time); these percentages showed no change from 2009/10 (See Tables 1 and 2 and previous SFR, ref Notes to editors 4).
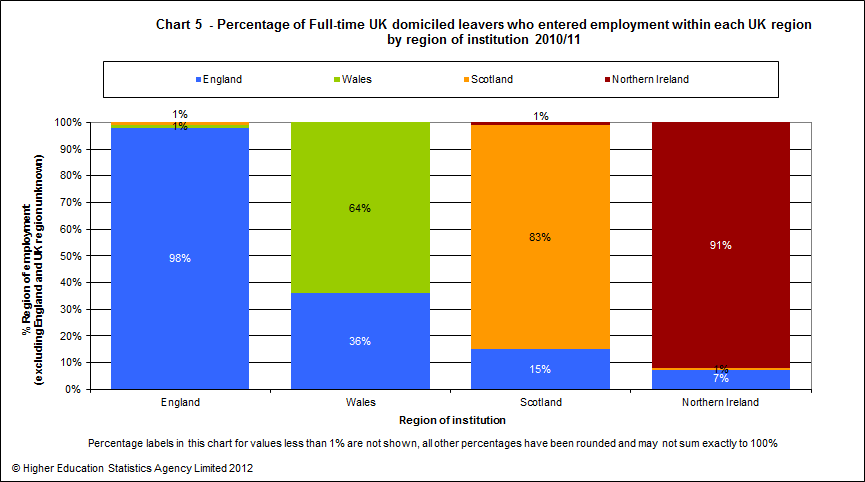
Charts 5 and Chart 6 show the percentages of full-time UK domiciled leavers who entered employment in the UK by their region of domicile, region of institution and region of employment.
Chart 5 shows that in 2010/11 the majority of full-time UK domiciled leavers who entered employment in the UK gained employment in the same region in which they studied although this varied across the four countries from 98% in England to 64% in Wales.
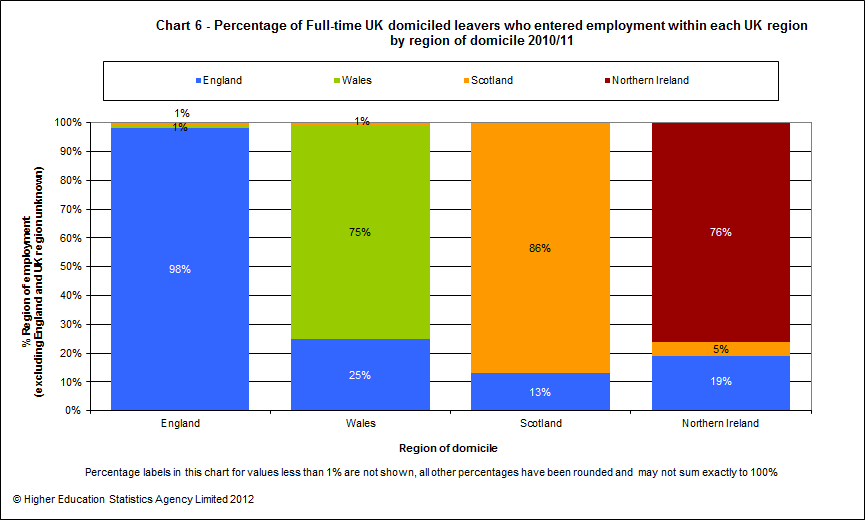
Chart 6 shows that in 2010/11 the majority of full-time UK domiciled leavers who entered employment in the UK gained employment in their original country of domicile, and similarly this varies across the four countries from 98% in England to 75% in Wales.
Key Points - England HEIs only
In 2010/11 there were 185,385 full-time first degree graduates whose destinations were known compared to 176,100 in 2009/10. In 2010/11, 62% (115,745) were in employment only; compared to 63% in 2009/10 and 10% (17,680) were assumed to be unemployed, compared to 9% in 2009/10 (See Table 1a and Chart 7).
In 2010/11, of the 19,540 part-time first degree graduates whose destinations were known, 67% were in employment only compared to 66% in 2009/10 and 6% were assumed to be unemployed, the same as in 2009/10 (See Table 2a and Chart 7).
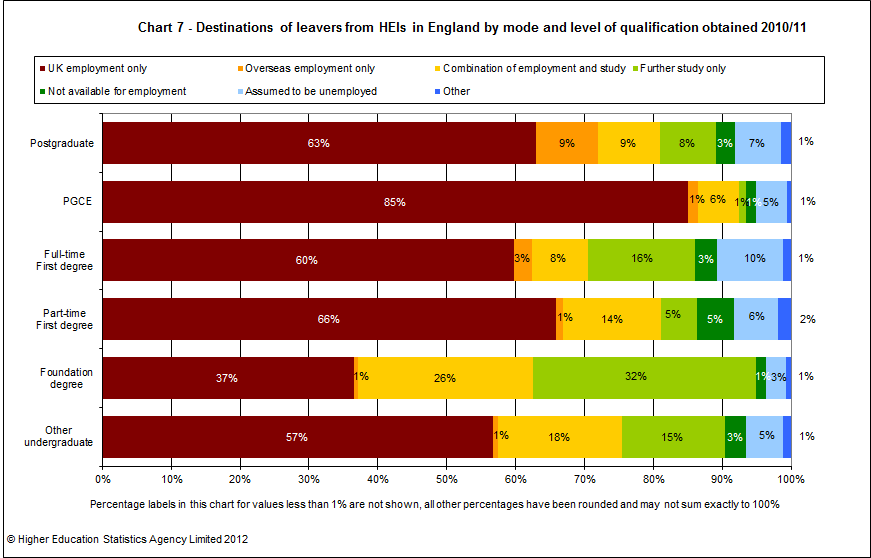
Chart 7 shows the percentages of leavers in each destination by level of qualification obtained with a mode of study split for first degree leavers.
Of the 26,250 other undergraduate leavers (both full-time and part-time excluding foundation degree and Professional Graduate Certificate in Education) whose destinations were known, 57% (15,080) were in employment only, compared to 60% in 2009/10. Of the 65,365 postgraduate leavers (both full-time and part-time excluding Postgraduate Certificate in Education) whose destinations were known 72% (47,045) were in employment only; the same as in 2009/10 (See Tables 1a, 2a and Chart 7).
Of those UK domiciled, first degree graduates (both full-time and part-time) reported as being in full-time paid employment (excluding self-employed) in the UK in 2010/11, 71% disclosed their salary, compared to 57% in 2009/10. (See note to editor 6). The median salary reported (to the nearest £500) was £20,000, (the same as in 2009/10). The lower quartile was £15,000 and the upper quartile £25,000. The mean salary was £21,000 (£20,500 in 2009/10) (See Table 5).
Key Points - Wales HEIs only
In 2010/11 there were 13,355 full-time first degree graduates whose destinations were known compared to 12,620 in 2009/10. In 2010/11, 62% (8,250) were in employment only; compared to 63% in 2009/10 and 9% (1,140) were assumed to be unemployed in 2010/11 compared to 8% in 2009/10 (See Table 1a and Chart 8).
In 2010/11, of the 670 part-time first degree graduates whose destinations were known, 72% were in employment only compared to 75% in 2009/10. In 2010/11, 2% (15) were assumed to be unemployed, compared to 3% in 2009/10 (See Table 2a and Chart 8).
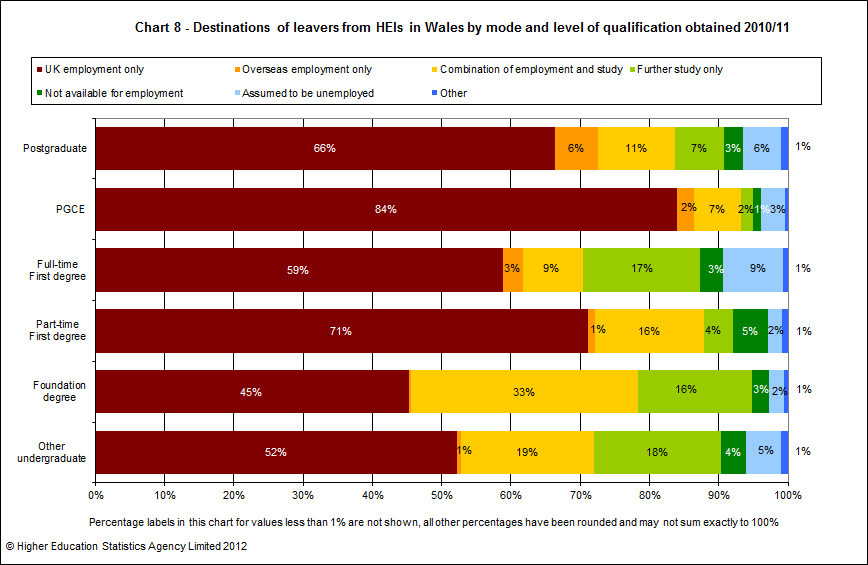
Chart 8 shows the percentages of leavers in each destination by level of qualification obtained with a mode of study split for first degree leavers.
Of the 2,070 other undergraduate leavers (both full-time and part-time excluding foundation degree and Professional Graduate Certificate in Education) whose destinations were known 53%, (1,090) were in employment only, compared to 50% in 2009/10. Of the 3,285 postgraduate leavers students (both full-time and part-time excluding Postgraduate Certificate in Education) whose destinations were known 73% (2,385) were in employment only; the same as in 2009/10 (See Tables 1a, 2a and Chart 8).
Of those UK domiciled, first degree graduates (both full-time and part-time) reported as being in full-time paid employment (excluding self-employed) in the UK in 2010/11, 58% disclosed their salary, compared to 35% in 2009/10. (See note to editor 6). The median salary reported (to the nearest £500) was £18,000, (£19,000 in 2009/10). The lower quartile was £14,000 and the upper quartile £22,000. The mean salary was £19,500 (£19,000 in 2009/10) (See Table 5).
Key Points - Scotland HEIs only
In 2010/11 there were 19,390 full-time first degree graduates whose destinations were known compared to 19,035 in 2009/10. There was a small increase in the percentages in employment only, 63% compared to 62% in 2009/10 while the percentage assumed to be unemployed remained at 7%. (See Table 1a and Chart 9).
In 2010/11, of the 1,570 part-time first degree graduates whose destinations were known, 79% were in employment only compared to 81% in 2009/10. In 2010/11, 4% (60) were assumed to be unemployed, the same as in 2009/10. (See Table 2a and Chart 9).
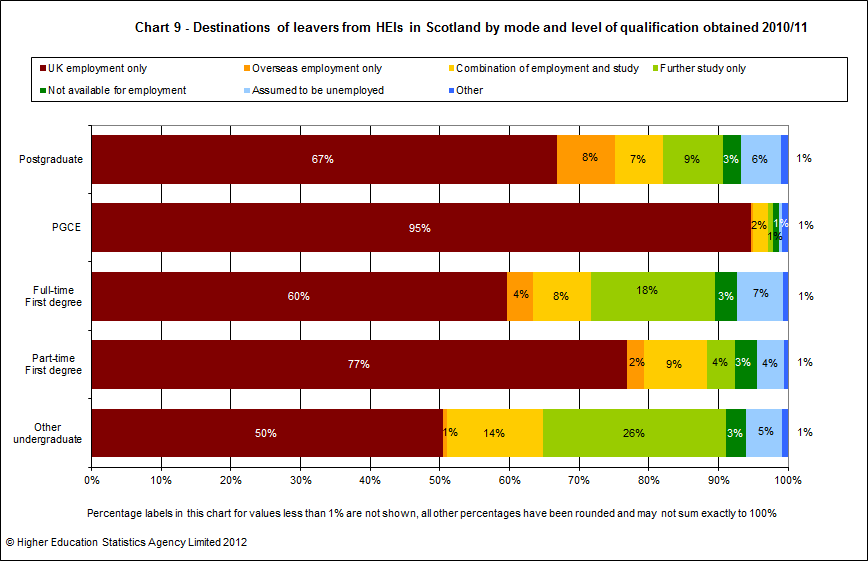
Chart 9 shows the percentages of leavers in each destination by level of qualification obtained with a mode of study split for first degree leavers.
Of the 2,985 other undergraduate leavers (both full-time and part-time excluding foundation degree and Professional Graduate Certificate in Education) whose destinations were known, 51% (1,525) were in employment only, compared to 50% in 2009/10. Of the 6,885 postgraduate leavers (both full-time and part-time excluding Postgraduate Certificate in Education) whose destinations were known 75% (5,175) were in employment only, compared to 74% in 2009/10 (See Tables 1a, 2a and Chart 9).
Of those UK domiciled, first degree graduates (both full-time and part-time) reported as being in full-time paid employment (excluding self-employed) in the UK in 2010/11, 64% disclosed their salary, compared to 48% in 2009/10 (See note to editor 6). The median salary reported (to the nearest £500) was £21,000, (the same as in 2009/10). The lower quartile was £16,000 and the upper quartile £25,000. The mean salary was £21,500 (the same as in 2009/10) (See Table 5).
Key Points - Northern Ireland HEIs only
In 2010/11 there were 5,910 full-time first degree graduates whose destinations were known compared to 5,630 in 2009/10. There was an increase in the percentage in employment only, 64% compared to 60% in 2009/10 while the percentage assumed to be unemployed fell to 9% compared to 10% in 2009/10 (See Table 1a and Chart 10).
In 2010/11, of the 530 part-time first degree graduates whose destinations were known, 71% were in employment only compared to 77% in 2009/10 and 8% (45) were assumed to be unemployed in 2010/11, the same as in 2009/10 (See Table 2a and Chart 10).
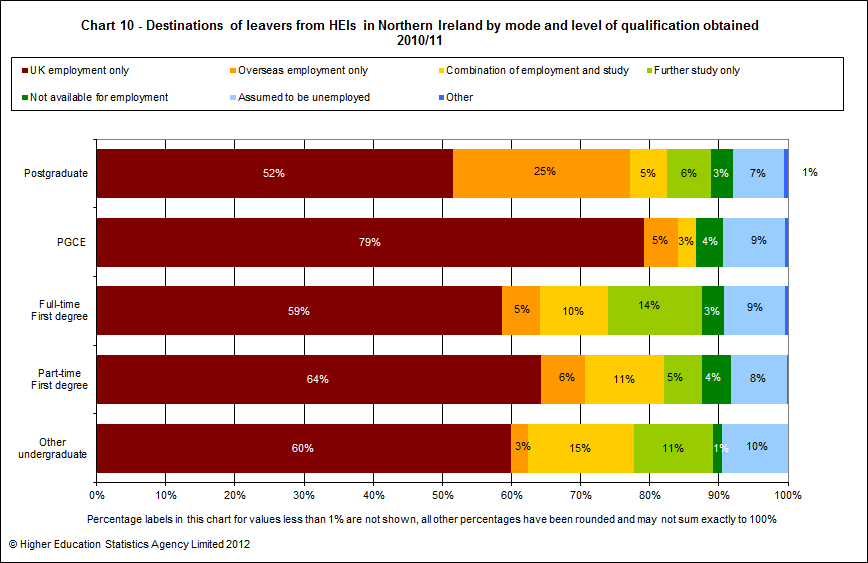
Chart 10 shows the percentages of leavers in each destination by level of qualification obtained with a mode of study split for first degree leavers.
Of the 155 other undergraduate leavers (both full-time and part-time excluding foundation degree and Professional Graduate Certificate in Education) whose destinations were known, 62% (100) were in employment only, compared to 72% in 2009/10. Of the 2,025 postgraduate leavers (both full-time and part-time excluding Postgraduate Certificate in Education) whose destinations were known 77% (1,560) were in employment only; 80% in 2009/10 (See Tables 1a, 2a and Chart 10).
Of those UK domiciled, first degree graduates (both full-time and part-time) reported as being in full-time paid employment (excluding self-employed) in the UK in 2010/11, 62% disclosed their salary, compared to 45% in 2009/10. (See note to editor 6). The median salary reported (to the nearest £500) was £20,000, (£18,000 in 2009/10). The lower quartile was £15,000 and the upper quartile £24,000. The mean salary was £20,000 (£19,000 in 2009/10) (See Table 5).
Tables
| Destinations of full-time leavers by gender, activity and level of qualification obtained 2006/07-2010/11 | |
| Destinations of full-time leavers by location of institution, activity and level of qualification obtained 2006/07-2010/11 | |
| Destinations of part-time leavers by gender, activity and level of qualification obtained 2006/07-2010/11 | |
| Destinations of part-time leavers by location of institution, activity and level of qualification obtained 2006/07-2010/11 | |
| Destinations of full-time first degree leavers by gender, activity and subject area 2006/07-2010/11 | |
| Occupation of full-time first degree leavers entering employment in the UK by location of institution and subject area of degree 2006/07-2010/11 | |
| Industry of full-time first degree leavers entering employment in the UK by location of institution and subject area of degree 2006/07-2010/11 | |
| UK domiciled leavers who obtained first degree qualifications and entered full-time paid employment in the UK by location of institution, mode of study and salary 2006/07-2010/11 | |
| Full-time UK domiciled leavers who entered employment within the UK by location of study, level of qualification obtained and location of employment, 2006/07-2010/11 | |
| Full-time UK domiciled leavers who entered employment within the UK by domicile, level of qualification obtained and location of employment 2006/07-2010/11 | |
| View all tables |
Notes to Editors
- The statistics in this SFR are derived by HESA from data collected from all publicly-funded higher education institutions (HEIs) in the UK (including The Open University) and from The University of Buckingham, which is privately funded. The figures therefore exclude HE qualifications obtained by students at further education colleges and at other private and independent HE providers.
- The 2010/11 Destinations of Leavers from Higher Education (DLHE) data includes all those students whose study was full-time or part-time (see Definition 5) and who obtained relevant qualifications (see Definition 4) reported to HESA for the reporting period 1 August 2010 to 31 July 2011.
-
The HESA DLHE Target Population contains all UK and European Union domiciled HE students for whom destinations data is expected and sought (see Definition 6). The figures presented in this SFR are based on information obtained by institutions and returned to HESA. Where the category ‘unknown' appears, the data relates both to non-respondents and to those leavers who have explicitly refused to answer the survey. Data on the number of unknowns is obtained by cross-checking the actual respondents with the total expected to reply, as returned in the 2010/11 HESA Student record.
In 2010/11, 331,050 full-time qualifiers responded from a target population of 414,290, which amounts to an overall response rate of 80% the same as in 2009/10. 83,680 part-time qualifiers responded from a target population of 112,010, an overall response rate of 75%, again the same as in 2009/10. These response rates include explicit refusals and are calculated separately from this SFR. They will be presented in a reference volume published by HESA in July 2012 (see Note 4).
In this SFR the figures for whom destinations are known exclude explicit refusals, for which no other information is available. It can be seen from Table 1 that the percentage of records returned for full-time HE students is 77% (77% in 2009/10) and from Table 2 for part-time HE students 70% (71% in 2009/10).
-
An electronic publication ‘Destinations of Leavers from Higher Education 2010/11', setting out more information about the destinations of students qualifying from HEIs in the UK, will be published by HESA in July 2012.
The 2009/10 DLHE SFR can be found here
-
The Joint Academic Coding System (JACS) of subject classification has been used as the basis for HESA data collections and this SFR. A variant of the SOC2000 was created for the coding of occupational information for use in the DLHE survey; this classification is termed SOC(DLHE).
From 2008/09 the aggregations reflect the Standard Industrial Classification economic activity sections as summarised in the UK Standard Industrial Classification of Economic Activities 2007 (SIC 2007). To enable production of comparable time series the new SIC categories have been grouped to fit with the old categories using: www.statistics.gov.uk/methods_quality/sic/downloads/SIC2007explanatorynotes.pdf.
- For 2010/11 the option ‘I do not wish to give that information' was removed from the telephone script when asking about a leaver's salary. The resulting effect of this change was an overall increase in the percentage disclosing salary information. In 2010/11, 69% of UK domiciled leavers who obtained first degree qualifications and entered full-time paid employment in the UK disclosed their salary (55% in 2009/10). The equivalent percentages for the administrations are as follows: England (71%), Wales (58%), Scotland (64%), and Northern Ireland (62%). HESA therefore advises caution in analysis of leavers by salary.
- The qualification acronym ‘PGCE' has traditionally been an abbreviation of ‘Postgraduate Certificate in Education'. However, the academic level of PGCE courses does vary. In April 2005 the Quality Assurance Agency for Higher Education issued guidance in relation to the Framework for HE Qualifications, which introduced a distinction between those PGCEs pitched at a level equivalent to the final year of an undergraduate Honours degree and those pitched beyond Honours level. The existing postgraduate level qualification was augmented by a new undergraduate level version, entitled the ‘Professional Graduate Certificate in Education'. This change was reflected in the HESA Student Record from 2008/09. For purposes of time series in this SFR, within Tables 1,1a, 2 and 2a where PGCEs are shown separately both postgraduate and undergraduate versions are included. Where the level of study disaggregation does not show PGCEs separately, ‘Postgraduate Certificates in Education' are included in ‘Postgraduate' totals and ‘Professional Graduate Certificates in Education' are included in ‘Other undergraduate' totals.
- The wording of the further study question within the DLHE questionnaire was altered from 2007/08 to clarify that leavers registered as research students, not those employed as researchers, should respond to this question. The resulting effect of this change can be seen most notably in the fall in proportion of doctorate leavers appearing within the combination of employment and study category from the equivalent figure for 2006/07.
- Within this SFR, where the phrase "same as in the previous year" is stated, this relates to the corresponding percentage rather than the underlying numbers.
- When comparing mean and median salaries, it should be noted that whilst a mean shows the arithmetic average salary, this could be skewed by a few abnormally high or low values. The median takes the middle value and is therefore less affected by very high or low salaries.
Definitions
- HE students are those students on courses for which the level of instruction is above that of the Qualifications and Curriculum Development Agency (QCDA) National Qualifications Framework (NQF)/Qualifications and Credit Framework (QCF) level 3 (or equivalent) e.g. courses at the level of Certificate of HE and above.
-
The survey dates for this DLHE return were 18 April 2011 (if the leaver obtained the qualification between 1 August 2010 and 31 December 2010) and 9 January 2012 (if the leaver obtained the qualification between 1 January 2011 and 31 July 2011). The reference dates of the 2009/10 DLHE return were 19 April 2010 and 10 January 2011 respectively.
Leavers separately report what they are doing in relation to employment and study; this enables the following destination categories to be derived from DLHE:
- employment only
- combination of work and study
- further study only
- assumed to be unemployed.
In addition, the destination category combination of work and study can be aggregated with the explicit employment only and further study only categories as follows:
- in employment only or a combination of work and study
- in study only or a combination of work and study.
For further details see Definitions 8 to 10.
-
Qualifications
Relevant qualifications for inclusion in the 2010/11 DLHE return are listed in Definition 4 below.
The population for the DLHE return does not necessarily represent the full cohort graduating during the reporting period; examples of those excluded are professional qualifications (e.g. associate membership or membership of a body such as the Institute of Bankers) and undergraduate diplomas and certificates (other than foundation degrees, HND, DipHE, HNC and CertHE).
-
Level of qualification obtained
Postgraduate qualifications obtained includes doctorate degrees obtained/not obtained primarily through research and New Route PhD; masters degrees obtained/not obtained primarily through research, Masters in Teaching and Learning, pre-registration masters degrees leading towards obtaining eligibility to register to practice with a health or social care or veterinary statutory regulatory body and postgraduate bachelors degrees; postgraduate diplomas, certificates and professional qualifications, Postgraduate Certificates in Education or Professional Graduate Diplomas in Education; other taught qualifications at level M including those leading towards registration with the Architects Registration Board (Part 2 qualification); level 7 Diploma in Teaching in the Lifelong Learning Sector, institutional postgraduate credits and non-formal postgraduate qualifications.
In certain analyses where PGCE is shown separately, this includes both Postgraduate Certificates in Education/Professional Graduate Diplomas in Education and Professional Graduate Certificates in Education.
In analyses where postgraduate qualification obtained is disaggregated into Doctorate and Other postgraduate the following groupings are used:
Doctorate qualifications obtained includes qualifications obtained includes doctorate degrees obtained/not obtained primarily through research and New Route PhD.
Other postgraduate qualifications obtained includes masters degrees obtained/not obtained primarily through research, Masters in Teaching and Learning, pre-registration masters degrees leading towards obtaining eligibility to register to practice with a health or social care or veterinary statutory regulatory body and postgraduate bachelors degrees; postgraduate diplomas, certificates and professional qualifications; other taught qualifications at level M including those leading towards registration with the Architects Registration Board (Part 2 qualification); level 7 Diploma in Teaching in the Lifelong Learning Sector, institutional postgraduate credits and non-formal postgraduate qualifications.
First degree qualifications obtained includes integrated undergraduate/postgraduate taught masters degrees on the enhanced/extended pattern, and first degrees with honours on the enhanced/extended pattern at level H; first degrees with honours/ordinary first degrees (including those leading to qualified teacher status (QTS)/registration with a General Teaching Council (GTC), but excluding those from the intercalated pattern); first degrees with honours leading towards registration with the Architects Registration Board (Part 1 qualification); pre-registration first degrees with honours/ordinary first degrees leading towards obtaining eligibility to register to practice with a health or social care or veterinary statutory regulatory body; first degrees with honours and diploma; postgraduate bachelors degrees at level H, and diploma at level M.
Other undergraduate includes qualification aims equivalent to and below first degree level, including, but not limited to, Professional Graduate Certificate in Education (PGCE) at level H (unless shown separately), foundation degrees (unless shown separately), diplomas in higher education (including those with eligibility to register to practice with a health or social care or veterinary statutory regulatory body), Higher National Diploma (HND), Higher National Certificate (HNC), Diploma of Higher Education (DipHE), Certificate of Higher Education (CertHE), foundation courses at higher education level, National Vocational Qualification (NVQ)/Scottish Vocational Qualification (SVQ) at NQF levels 4 and 5, post-degree diplomas and certificates at undergraduate level (including those in Teaching in the Lifelong Learning Sector), professional qualifications at undergraduate level, other undergraduate diplomas and certificates including post-registration health and social care courses, other formal higher education qualifications of less than degree standard, institutional undergraduate credit and non-formal undergraduate qualifications.
In certain analyses Foundation degrees (e.g. FdA, FdSc) are shown separately. Foundation degrees were first introduced in September 2001 to provide vocational higher education qualifications.
Further details of the frameworks used to classify courses are available here.
-
Mode of study
Full-time includes full-time and sandwich modes plus those writing-up where the mode of study was previously full-time and students recorded as dormant status who were previously enrolled full-time.
Part-time includes those studying part-time, those who were full-time for less than 24 weeks in the academic year, block release or studying during the evenings, plus those writing-up theses who were previously enrolled part-time.
-
Domicile
UK domicile students are those whose normal residence is in the UK, including those living in Guernsey, Jersey and the Isle of Man. Other European Union (Other EU) domicile students are those whose normal residence is in countries which were EU members or in their designated territories as at 1 December 2010.
-
Location of employment
Respondents to the HESA DLHE survey were asked to supply the location of their employment. Where this was unknown but the activity was full-time paid work only (including self-employed), part-time paid work only or voluntary/unpaid work only, a United Kingdom location of employment has been assumed. These numbers are, however, relatively small. Where location of employment is not known it is assumed to be UK. This represented 0.3% of the total number in UK Employment for Table 1 and 0.8% for Table 2.
Where location of employment is given as Great Britain, this is taken to be England, Scotland and Wales only (i.e. it excludes those located in Guernsey, Jersey or the Isle of Man).
-
Employment
The category Employment only includes those students who gave their employment circumstances as employed full-time in paid work, employed part-time in paid work, self-employed/freelance, voluntary work or other unpaid work and who are also not in study.
The category Combination of work and study includes those students who gave their employment circumstances as employed full-time in paid work, employed part-time in paid work, self-employed/freelance, voluntary work or other unpaid work and who are also either in full-time study or part-time study.
The category Full-time employment only includes those students who gave their employment circumstances as employed full-time in paid work or self-employed/freelance and who are also not in study.
-
Further study
The category Further study includes those who gave their employment circumstances as temporarily sick or unable to work/looking after the home or family, not employed but not looking for employment, further study or training, or something else, and who were also either in full-time or part-time study, training or research. It also includes those who were due to start a job within the next month or unemployed and looking for employment, further study or training, and who were also in full-time study, training or research.
-
Unemployment
Assumed to be unemployed includes those students who gave their employment circumstances as unemployed and looking for employment, further study or training, and who were also either in part-time study or not studying, plus those who were due to start a job within the next month and who were also either in part-time study or not studying.
In Tables 1, 1a, 2, 2a and 3, the category Other includes those students who are not studying and also either gave their employment circumstances as not employed but not looking for employment, further study or training, or something else.
-
Unknown
This category includes non-respondents and explicit refusals, and is used in Tables 1, 1a, 2, 2a and 3.
-
Salary
Describes the annual salary surveyed to the nearest thousand pounds before tax, for leavers in full-time paid work (excluding self-employed). Provision of salary information may legitimately be refused. Salary calculations in Table 5 are expressed to the nearest £500.
-
Location of institution
The allocation of an institution to a geographical region is done by reference to the administrative centre of that institution. There may be students registered at institutions who are studying in regions other than that of the administrative centre of the institution.
The Open University is counted as a wholly English institution. The administrative centre is located in England, although The Open University teaches throughout the UK.
-
Rounding Strategy
In the text and tables the figures presented are rounded. 0, 1 and 2 are rounded to 0. All other numbers are rounded up or down, to the nearest multiple of 5. This rounding strategy is also applied to totals figures, a consequence of which is that the sum of numbers in each row or column rarely precisely matches the totals shown. Percentages are calculated on precise raw numbers and are suppressed if they are calculated on a population which contains 52 or fewer individuals. These cases are represented as '..'. Within this SFR percentages in tables, charts and text are displayed to 0 decimal places.
Press enquiries should be directed to the Press Office at the Higher Education Statistics Agency (HESA), 95 Promenade, Cheltenham, GL50 1HZ, telephone 01242 211120. General enquiries about the data contained within this SFR should be addressed to Jenny Skeet, Statistical Analyst, HESA (at the same address), telephone 01242 211133.
Ends

Embargo
28 June 2012, 9:30
Coverage
UK
Themes
Children, education and skills
Issued by
HESA, 95 Promenade, Cheltenham, GL50 1HZ
Press enquiries
01242 211120
Public enquiries
01242 211133
Statistician
Jenny Skeet


