Summary - UK Performance Indicators 2002/03
This section summarises the sector-wide information for each of the indicators, and provides a comparison with the sector values from previous years, where appropriate. Indicators for institutions where the number of students with the requisite information is less than 500 tend to be rather variable, and in the following paragraphs are referred to as small institutions. When referring to the summary charts below, the range a to b on the x-axis should be interpreted as greater than a and less than or equal to b, for example, the label 5-10 means greater than 5 and less than or equal to 10.
Percentage from schools and colleges in the state sector
This indicator, shown in table series T1, is produced for young full-time undergraduate entrants. The term ‘State schools or colleges’ is for all schools that are not classed as independent.
Table 1 gives figures for entrants to first degree courses at institutions in each country and shows comparative values over the past five years. These figures do not take into account any changes in population, or in the pattern of school attendance, over this time.
Table 1 Percentage of young entrants to full-time first degree courses from state schools
| 1998 | 1999 | 2000 | 2001 | 2002 | |
|---|---|---|---|---|---|
| UK | 85.0 | 84.9 | 85.7 | 86.0 | 87.2 |
| England | 84.4 | 84.1 | 85.0 | 85.2 | 86.4 |
| Wales | 90.5 | 90.8 | 90.8 | 90.9 | 91.9 |
| Scotland | 83.2 | 84.1 | 84.0 | 85.0 | 87.5 |
| Northern Ireland | 99.8 | 99.8 | 99.9 | 99.7 | 99.9 |
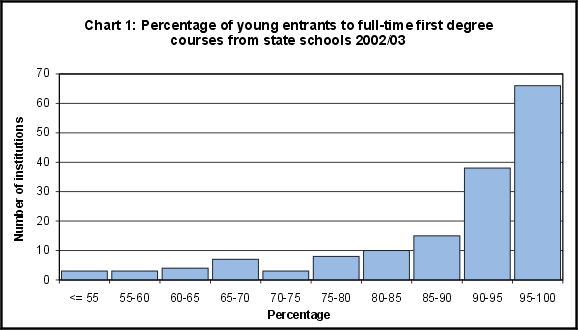
Nationally, over 90% of 17 year-olds in full-time education attend schools or colleges in the state sector (Source: Department for Education and Skills). 87.2% of young entrants to full-time first degree courses in 2002/03 had attended such schools. Most institutions take more than 90% of their young students from state schools. About one in 9 institutions take less than 70% of their young entrants to full-time first degree courses from state schools. Chart 1 shows this pattern.
Percentage from NS-SEC Classes 4, 5, 6 and 7
This indicator is produced for young full-time undergraduate entrants to higher education, and is also given in table series T1.
Following the revision by the Office of National Statistics (ONS) of the old Social and Occupational classification, this indicator has been completely re-defined. The new definition includes categories 4 to 7 of the new National Statistics Socio-Economic Classification (NS-SEC) in the 'low SEC' group, with categories 1 to 3 as 'not low SEC'. This change means that comparison with last year's figures cannot be made. Further details of the change are provided in the ‘Changes to PIs’ document.
Figures based on the Labour Force Survey and quoted in Regional Trends 37 (Source: Office for National Statistics) show that nearly 50% of the population of working age are classified in groups 4 to 7, where classification is based on current or most recent occupation. Nationally, 28.4% of young entrants to full-time first degree courses come from this section of the population.
Table 2 Percentage of young entrants to full-time first degree courses from NS-SEC Classes 4, 5, 6 or 7
| NS-SEC classes 4-7 | |
|---|---|
| 2002 | |
| UK | 28.4 |
| England | 27.9 |
| Wales | 29.8 |
| Scotland | 28.0 |
| Northern Ireland | 41.3 |
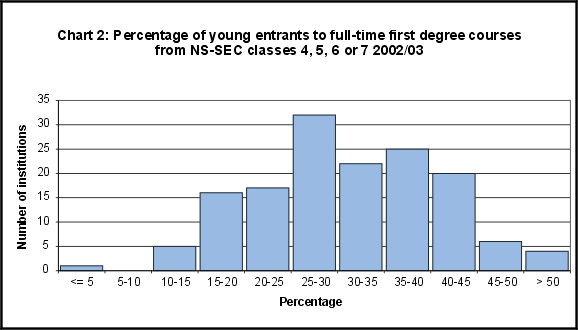
The percentage from NS-SEC Classes 4, 5, 6 and 7 varies widely between institutions. The spread of values for this indicator is shown in Chart 2. The institutions with the indicator values at the extremes are mainly those with under 500 entrants with known data.
Percentage from low participation neighbourhoods
The percentage of entrants from low participation neighbourhoods is provided separately for young and mature undergraduate entrants, both full-time and part-time. The definition of and further information about low participation neighbourhoods is given in Annex A.
The indicators are given in Table T1 for young full-time entrants, Table T2a for mature full-time entrants, and Table T2b for part-time entrants.
Full-time entrants
In the UK as a whole, about 30% of young people live in areas classed as low participation (Source: Higher Education Funding Council for England). 13.3% of young entrants to full-time first degree courses and 13.8% of mature entrants to full-time first degree courses (who also had no previous higher education qualification) came from low participation neighbourhoods, which are similar to the percentages in previous years. Table 3 shows the percentages for young and mature students for all the countries in the United Kingdom.
Table 3a Percentage of young entrants to full-time first degree courses from low participation neighbourhoods
| Young | |||||
|---|---|---|---|---|---|
| 1998 | 1999 | 2000 | 2001 | 2002 | |
| UK | 12.3 | 12.4 | 12.5 | 13.1 | 13.3 |
| England | 11.6 | 11.7 | 11.8 | 12.4 | 12.5 |
| Wales | 15.4 | 14.6 | 15.0 | 15.0 | 16.0 |
| Scotland | 16.9 | 17.6 | 17.8 | 18.3 | 18.6 |
| Northern Ireland | 9.4 | 9.1 | 9.2 | 9.3 | 10.1 |
Table 3b Percentage of mature entrants to full-time first degree courses (who also had no previous higher education qualification) from low participation neighbourhoods
| Mature | |||||
|---|---|---|---|---|---|
| 1998 | 1999 | 2000 | 2001 | 2002 | |
| UK | 13.6 | 13.6 | 14.0 | 14.1 | 13.8 |
| England | 13.4 | 13.4 | 13.9 | 14.1 | 13.8 |
| Wales | 16.8 | 16.8 | 15.5 | 15.3 | 18.3 |
| Scotland | 13.4 | 13.4 | 13.6 | 13.7 | 11.4 |
| Northern Ireland | 13.1 | 13.1 | 13.1 | 11.9 | 11.4 |
Part-time entrants
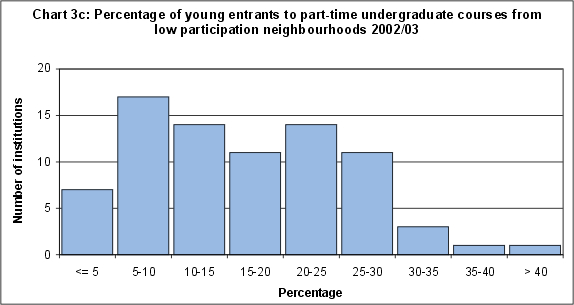
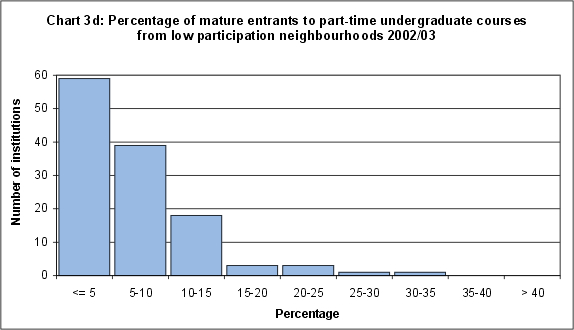
There is a difference between young and mature part-time entrants as regards this indicator. 20.5% of young entrants and 7.6% of mature entrants to part-time undergraduate courses come from low participation neighbourhoods. The figure for young entrants shows an increase over last year, but the small numbers involved mean that this should be treated with caution.
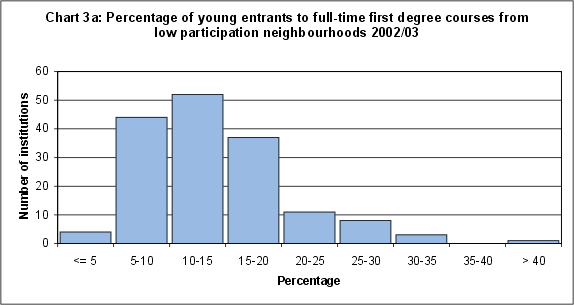
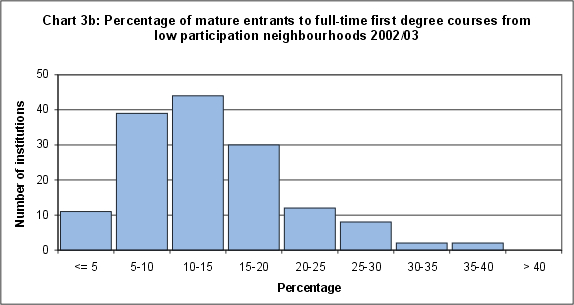
Table 4 shows the pattern for part-time entrants for the countries of the United Kingdom, and Chart 3 shows the spread across institutions for the indicators between young and mature, and full-time and part-time entrants.
Table 4a Percentage of young entrants to part-time undergraduate courses from low participation neighbourhoods
| Young | |||||
|---|---|---|---|---|---|
| 1998 | 1999 | 2000 | 2001 | 2002 | |
| UK | 16.4 | 16.3 | 16.4 | 19.8 | 20.5 |
| England | 15.2 | 15.6 | 15.8 | 19.8 | 17.7 |
| Wales | 22.7 | 23.6 | 22.9 | 32.8 | 34.0 |
| Scotland | 24.7 | 16.5 | 17.0 | 23.2 | 20.4 |
| Northern Ireland | 9.2 | 4.5 | 2.9 | 17.9 | 3.6 |
Table 4b Percentage of mature entrants to part-time undergraduate courses from low participation neighbourhoods
| Young | |||||
|---|---|---|---|---|---|
| 1998 | 1999 | 2000 | 2001 | 2002 | |
| UK | 7.2 | 7.5 | 7.4 | 7.7 | 7.6 |
| England | 6.9 | 7.4 | 7.2 | 7.7 | 7.4 |
| Wales | 13.1 | 12.6 | 13.5 | 12.9 | 13.8 |
| Scotland | 5.4 | 4.9 | 5.4 | 7.6 | 6.5 |
| Northern Ireland | 7.3 | 7.2 | 6.0 | 5.6 | 4.3 |
Percentage of disabled students
This indicator, in Table T7, is provided separately for full-time and part-time undergraduates. Unlike the other access indicators, it is based on all undergraduates, not just entrants, because of the small numbers involved. The indicator used is the proportion of students who are in receipt of the disabled students' allowance (DSA), as this is more robust than the proportions reporting that they are disabled.
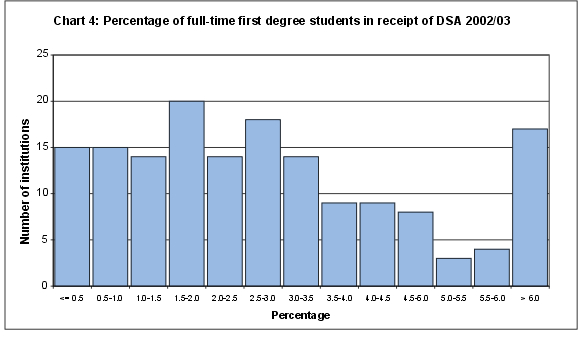
The proportion of students in receipt of DSA is relatively small. The percentage of such students on full-time undergraduate courses in 2002/03 was 2.5% (2.0% in 2001/02), with institutional values ranging from 0.0% to 18.2%.
For part-time students, apart from those at the Open University (OU), 0.9% (0.7% in 2001/02) were in receipt of DSA. The OU, with nearly a third of all eligible part-time students, had 1.8% of its students in receipt of DSA.
Table 5 shows the equivalent figures for the countries of the UK over a three-year period and Chart 4 shows the spread of values for full-time first degree students.
Table 5 Percentage of students in receipt of DSA, for full-time first degree and part-time undergraduate students
| Full-time first degree | Part-time undergraduate | ||||||
|---|---|---|---|---|---|---|---|
| 2000 | 2001 | 2002 | 2000 | 2001 | 2002 | ||
| UK (excl. OU) | 1.5 | 2.1 | 2.6 | 0.4 | 0.7 | 0.9 | |
| England | 1.6 | 2.1 | 2.6 | 0.4 | 0.8 | 0.9 | |
| Wales | 2.0 | 2.9 | 4.0 | 0.5 | 0.7 | 0.9 | |
| Scotland | 1.1 | 1.8 | 2.2 | 0.3 | 0.4 | 0.7 | |
| Northern Ireland | 0.6 | 1.2 | 1.7 | 0.1 | 0.7 | 1.0 | |
| Open University | 4.6 | 1.8 | 1.8 | ||||
Non-continuation rates after first year at institution
Table series T3 gives this indicator, which shows what proportion of entrants to an institution continue in higher education beyond the first year. Table T3a provides this indicator separately for young and mature full-time first degree entrants to higher education.
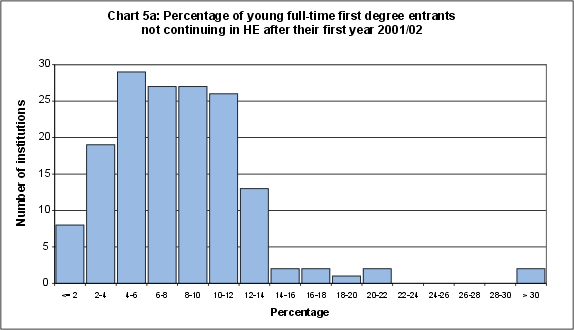
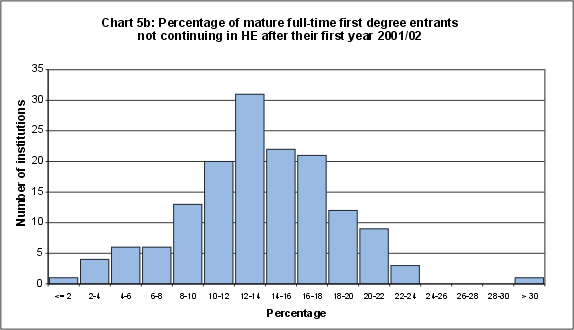
In general, a higher proportion of mature entrants than young entrants do not continue in higher education after their first year. The UK non-continuation rate is 14.9% (14.5% in 2000) for mature entrants compared with 7.3% (7.1% in 2000) for young entrants. The non-continuation rate for young entrants is below 10% at 70% of institutions. For mature entrants it is between 5% and 20% at the majority of institutions. However, it is above 20% at around 9% of institutions.
Tables 6a and 6b shows the non-continuation rates for the countries of the UK from 1997 to 2001, for young and mature full-time first degree entrants respectively. Charts 5a and 5b illustrate the spread of values between institutions in 2001, again for young and mature full-time first degree entrants respectively.
Table 6a Percentage of young full-time first degree entrants not continuing in HE after their first year
| Young | |||||
|---|---|---|---|---|---|
| 1997 | 1998 | 1999 | 2000 | 2001 | |
| UK | 7.6 | 7.9 | 7.8 | 7.1 | 7.3 |
| England | 7.6 | 7.9 | 7.7 | 6.9 | 7.0 |
| Wales | 7.8 | 6.7 | 7.3 | 6.9 | 7.2 |
| Scotland | 7.9 | 8.6 | 9.2 | 8.8 | 9.6 |
| Northern Ireland | 6.9 | 8.1 | 7.3 | 7.2 | 9.2 |
Table 6b Percentage of mature full-time first degree entrants not continuing in HE after their first year
| Mature | |||||
|---|---|---|---|---|---|
| 1997 | 1998 | 1999 | 2000 | 2001 | |
| UK | 15.3 | 16.0 | 15.9 | 14.5 | 14.9 |
| England | 15.3 | 16.3 | 16.0 | 14.4 | 14.8 |
| Wales | 17.9 | 14.4 | 14.9 | 14.3 | 16.5 |
| Scotland | 14.4 | 14.8 | 15.7 | 15.5 | 15.4 |
| Northern Ireland | 14.0 | 12.4 | 11.9 | 10.8 | 10.6 |
This year there is a new table (T3d) which shows what proportion of full-time other undergraduate entrants to an institution continue in higher education beyond the first year. This is also provided separately for young and mature full-time other undergraduate entrants to higher education.
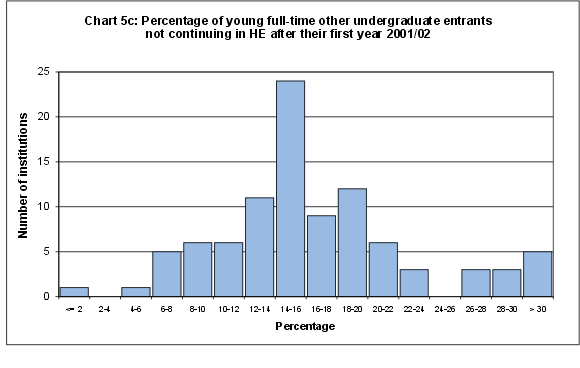
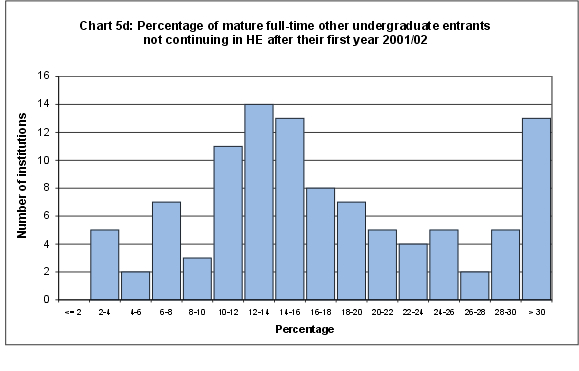
In general, a very similar proportion of mature and young full-time other undergraduate entrants do not continue in higher education after their first year. The UK non-continuation rate is 17.1% for mature entrants compared with 18.7% for young entrants.
Table 6c shows the non-continuation rates for the countries of the UK in 2001, for young and mature full-time other undergraduate entrants. Charts 5c and 5d illustrates the spread of values between institutions in 2001, again for young and mature full-time other undergraduate entrants.
Table 6c Percentage of full-time other undergraduate entrants not continuing in HE after their first year
| Young 2001 | Mature 2001 | |
|---|---|---|
| UK | 18.7 | 17.1 |
| England | 16.3 | 15.8 |
| Wales | 21.6 | 25.1 |
| Scotland | 32.6 | 23.5 |
| Northern Ireland | 18.7 | 8.6 |
Return after a year out
Further information is provided in Table T4 about full-time first degree students who started at university or college in 2000/01, but were not in higher education in 2001/02. Nationally, 13.4% of young full-time first degree students and 11.3% of mature full-time first degree students in this category returned to their original institution in 2002/03, with a further 13.8% of young full-time first degree students and 5.7% of mature full-time first degree students transferring to another institution.
Projected outcomes
The projected outcomes in Table T5 summarise the pattern of movements of students at institutions between 2001/02 and 2002/03. They give the outcomes that would be expected from starters at the institution in 2001/02 if these progression patterns were to remain unchanged over the next few years.
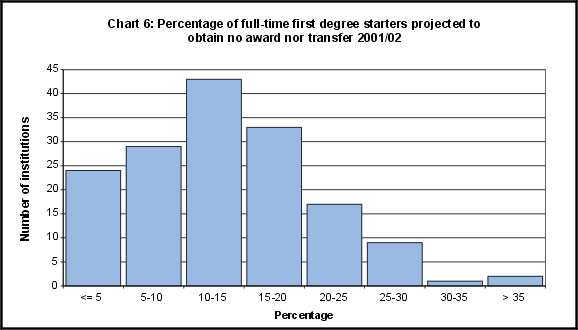
The sector averages for the UK and its constituent countries are obtained by taking a (weighted) average of all the relevant institutional values. They show that 77.9% of full-time first degree students starting at an institution are expected to qualify from that institution with a degree, and 14.1% are expected to get no qualification. A further 6.4% are expected to transfer to another institution. The projected percentage of students who leave before gaining any award, and who neither return to study nor transfer to another institution, is less than 20% for the majority of institutions. Tables 7 and 8 give a summary across the countries of the United Kingdom for the last four years.
Table 7 Projected outcomes – percentage of full-time first degree starters expected to gain a degree (sector averages)
| Obtain degree | ||||
|---|---|---|---|---|
| 1998 | 1999 | 2000 | 2001 | |
| UK | 77.2 | 77.3 | 77.8 | 77.9 |
| England | 77.4 | 77.4 | 78.1 | 78.4 |
| Wales | 78.4 | 77.3 | 78.7 | 78.2 |
| Scotland | 75.2 | 74.3 | 73.6 | 73.0 |
| Northern Ireland | n/a | 85.2 | 83.3 | 81.9 |
Table 8 Projected outcomes – percentage of full-time first degree starters expected to neither obtain an award nor transfer (sector averages)
| No award nor transfer | ||||
|---|---|---|---|---|
| 1998 | 1999 | 2000 | 2001 | |
| UK | 15.8 | 15.9 | 15.0 | 14.1 |
| England | 15.8 | 15.9 | 15.0 | 13.8 |
| Wales | 14.4 | 15.0 | 13.8 | 14.7 |
| Scotland | 16.3 | 17.6 | 16.5 | 16.3 |
| Northern Ireland | n/a | 11.1 | 11.8 | 12.2 |
Chart 6 shows the spread of values across institutions for the percentage of starters projected to neither obtain an award nor transfer to another institution.
Module completion rates
Table T6 looks at module completion rates for part-time students. The provision of this information is dependent on how student data are returned to HESA, and so currently only institutions in Wales are included as institutions in Wales are required to return a module record to HESA. The table shows what percentage of modules undertaken by part-time students are successfully completed, along with statistics to put this percentage into context. For 2002/03, 60.5% of the relevant modules had results provided, and in 86.3% of cases the module was passed. Each part-time student undertook just under three modules, on average, and each module was worth an average 13.0% full-time equivalent.
Research indicators
Research indicators, which are given in Table R1, are different in kind to other indicators, in that they do not wholly relate to the student population. They measure research output (as shown by the number of PhDs awarded and the amount of research grants or contracts for which expenditure has been incurred) against resource inputs (namely, academic staff costs and the funding councils’ allocations for research).
These indicators do not measure research quality. That is done by the Research Assessment Exercise. The results from the 2001 RAE exercise are available at http://www.rae.ac.uk/2001/.
Research indicators are all standardised to a value of 1 and take account of the differing ratios of output to input in different cost centres. A value of 1 for an indicator shows that the institution is producing the same as the rest of the sector, relative to its input. A value below 1 shows it is producing less than the sector, and a value greater than 1 shows that it is producing more than the sector, again relative to its input.
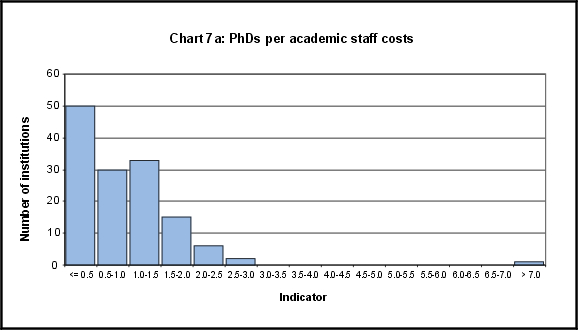
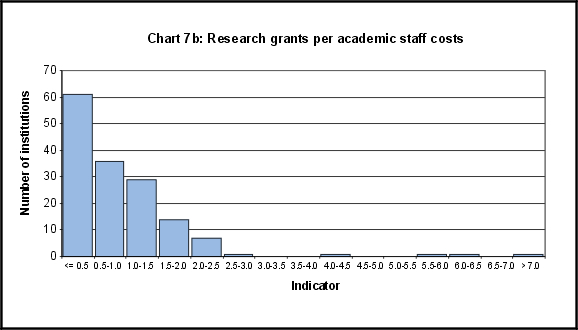
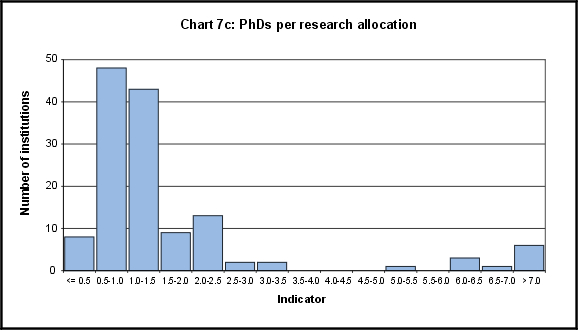
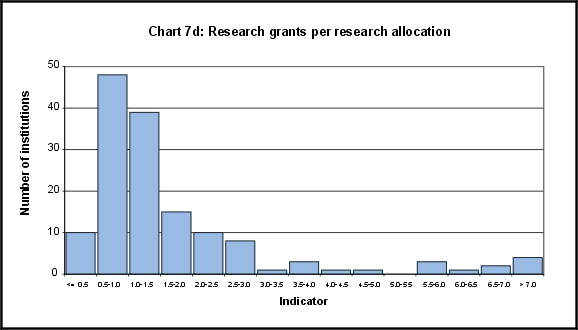
All four research indicators show similar patterns to those from last year, with the majority of institutions having values below 2. The indicators using academic staff costs as the input are less variable between the years than the indicators which use funding councils’ research allocation, in part because the amount of funding for some institutions is very small relative to that for the large research universities.
Charts 7a to 7d show the spread of the four research indicators across institutions with non-zero outputs.
Employment indicator
This is the fourth year in which employment indicators have been published. The indicator is based on the responses to the Destination of Leavers from Higher Education (DLHE) survey, which replaced the First Destinations survey last year. The response rate this year for those graduating from full-time courses with a first degree was 83.2% (83.8% in 2001). Table 9 shows comparative results for the last four years.
Table 9 Employment outcomes of full-time first degree qualifiers
| 1999 | 2000 | 2001 | 2002 | |
|---|---|---|---|---|
| Eligible population | 207,235 | 208,655 | 208,895 | 213,715 |
| Respondents | 168,755 | 175,435 | 175,080 | 177,745 |
| Response rate | 81.4% | 84.1% | 83.8% | 83.2% |
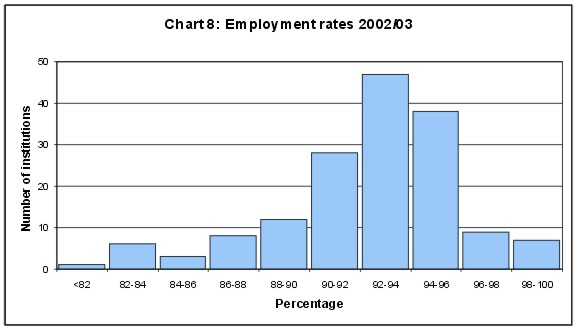
Chart 8 shows the spread of the employment indicator across institutions.
Enquiries
- Press: Call 01242 211120 or email [email protected].
- General enquiries should be sent to [email protected].
- Enquiries regarding the UK Performance Indicators Steering Group (UKPISG) should be directed to the HEFCE Press Office on 0117 931 7363
- This work is licensed under a Creative Commons Attribution 4.0 International License.

