Inclusive growth: Can data support policymakers and the higher education sector meet this objective?
In this insight, HESA researchers carry out an empirical analysis exploring the association between education provision, the skill level within the local population and productivity.
Summary and key findings
- One of the key challenges facing policymakers throughout the UK is how to improve productivity (particularly in areas with lower living standards) in an era of tighter fiscal budgets.
- Existing literature suggests that raising skills and qualifications is one of the factors that can contribute to boosting productivity.
- Given limited financial resource, empirical analysis is therefore needed to identify areas which could benefit most from investment in education.
- Our study identifies 38 local authorities/council areas across the UK, which have the smallest proportion of residents with Level 4 qualifications or above. Furthermore, school attainment is often below the national average.
- On average, these localities also have the lowest productivity levels.
- These places tend to have a manufacturing, mining or industrial legacy, with many continuing to see a net outflow of graduates today.
- The local authorities identified also contain some of our most deprived vicinities, with 44% of neighbourhoods within these localities falling within the lowest quintile of the HESA measure of deprivation.
- The vast majority of these areas do not have any higher education provision according to HESA records, while those that do are often served by a single establishment.
- The key information currently missing in this analysis is higher education provision in further education colleges.
- Adding this to HESA records will give a more complete picture of education supply across the country, which would support policymakers in determining how education investment could help to increase productivity in areas that have faced relative economic decline in recent decades.
Map and data
We have provided the dataset used to produce this insight in the form of an interactive map (which also offers the option of downloading the underlying data). Please note that data relating to attainment cannot be included, as there is no UK-wide attainment measure available. Furthermore, as the HESA measure of deprivation is generated at small/output area level (and our maps are at local authority level), this data is also excluded from the visualisation.
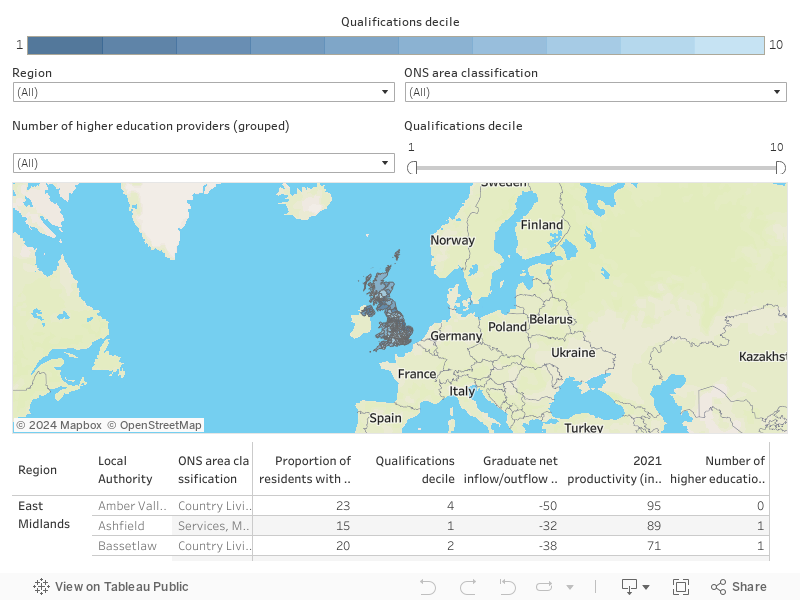
An interactive map/postcode search tool for the HESA measure of deprivation will be published on Tuesday 19th March 2024, as an experimental statistic.
Introduction
Back in 2022, we released a research insight detailing a new graduate mobility marker that utilised information on the local authority (council areas in Scotland and local government districts in Northern Ireland) of domicile/employment of the individual, as well as their region of study.[1] Naturally, one of the next stages in the development of this new field is to see if we can introduce local authority of study in place of the more aggregated level of geography we rely upon at present. Over the past year, we have therefore attempted to begin creating such a variable. In turn, this data can inform us of the number of providers in each local authority across the UK based on existing HESA records. Linking this information to external sources can help one to understand how factors such as education provision, the skill level of the local population and productivity correlate throughout the country. This exploration is the primary purpose of this piece.
Policy context
As the Resolution Foundation (2023) have recently noted[2], the UK economy since the Great Recession has been characterised by low growth and high inequality. Furthermore, Stansbury et al. (2023) state that the inequality we observe is primarily a productivity issue (stylised fact 1).[3] Consequently, a key focus for governments in all parts of the country over forthcoming years is how to boost productivity, particularly in those areas which are currently experiencing lower standards of living. While research has tended to show that education and income levels are positively associated, it is far trickier to determine whether education has a causal impact on productivity, given there is no easy way by which statisticians/social scientists can conduct random experiments to explore this issue (as has been neatly highlighted by David Deming).[4] However, one paper that gets as close as one may ever get to understanding whether human capital can explain income variations is by Hendricks and Schoellman (2018).[5] The authors look at how the earnings of migrants from poor countries change when they move to the US. If they remain constant, income differences must be entirely explained by worker skills. In contrast, if their earnings change to some degree, there must be other factors at play (alongside human capital). Indeed, it is the latter scenario which emerges through their data. While this paper focuses on cross-country variations in income, the general finding does seem to align with stylised fact 4 in the work by Stansbury et al. (2023), as well as what is stated in a Resolution Foundation (2022) report. That is, education is among a range of aspects that help explain differentials in output/productivity.[6] The empirical analysis carried out by the Resolution Foundation (2022) suggests that, holding all else constant, a 1% rise in the graduate share within an area is associated with a 0.6% increase in productivity.
Research question
The literature therefore highlights that education may well form part of the solution to the productivity problem. Consequently, a key question for both policymakers and (higher) education providers is where to target interventions in an era of more limited financial resource. Answering this requires the analysis of data on area-level productivity, education provision, as well as both the stock and flow of skills across different parts of the country. It is this empirical exploration that we focus upon here.
Data and summary statistics
To tackle this research question, we link a HESA variable relating to the number of providers located in a particular local authority to external data. Using our Student Record, the provider number field was formed using postcode data relating to a particular provider/campus (which could then be mapped to a local authority).[7] If a provider had multiple campuses in the same area, they would only be counted once. While there may be some instances where the provider postcode is an administrative address (and hence no students study at the location), the main limitation of this variable at present is that we are missing information on further education colleges that offer higher education courses, though we are looking to rectify this through a separate project.[8] As the number of providers can change year on year, we have calculated this field across four academic years (2017/18 to 2020/21) and taken the maximum value across this timeframe in each local authority.
The first external source that we linked to was Census 2011 records. The Office for National Statistics (ONS), Northern Ireland Statistics and Research Agency (NISRA) and National Records of Scotland (NRS) all release data relating to the qualifications of residents at local authority level.[9] We ingest this data and create a variable that indicates the proportion of individuals in the area with Level 4 qualifications (i.e. generally degree level) or above.[10] With some parts of England having been merged to form new local authorities since 2011, proportions were determined for these localities by firstly summing the populations of the individual areas (as well as the number of residents with Level 4 qualifications or above) before computing the share.[11]
Additionally, for this Census, the ONS have produced a suite of area classifications, which we merge into our dataset.[12] This gives us supplementary information on local authorities, such as whether they are a coastal town or have a mining/manufacturing legacy. We must rely on 2011 records, as such information is not currently available for the latest 2021 Census, with Scotland due to release the bulk of its 2022 collection later this year.[13]
In the past few years, ONS have started to produce productivity indices at local authority level too, so we are also able to bring this into our master dataset. Specifically, we introduce 2021 productivity data (i.e. a measure of output per hour worked). It should be stated that these figures are smoothed and therefore (where possible) they take into account data from the previous/following two years as well, given the smaller sample size associated with using just a single year would lead to greater volatility/uncertainty.[14]
The Centre for Cities have pointed out that for areas to boost the number of highly-skilled individuals in their area, they must both attract and retain graduates.[15] By amalgamating the first four collections of the Graduate Outcomes survey, we are able to develop a percentage figure that tells us the extent to which an area may be experiencing a net inflow/outflow of graduates. Based on linked Graduate Outcomes-HESA Student Record data, we do this by firstly deriving the sum of graduates working in the local authority across the four years, as well as the total count of students domiciled in that local authority prior to higher education entry in the same period (for whom we are able to also ascertain their work location). The net inflow/outflow percentage within a local authority is therefore the difference between the working and domicile populations divided by the domicile total.
In summary, to conduct our investigation, we have developed a dataset containing the following fields;
- UK local authority name/code
- Proportion of residents with Level 4 qualifications or above in the local authority
- ONS area classification of the local authority
- Productivity in the local authority
- Net inflow/outflow of graduates from the local authority across four years of Graduate Outcomes data
- Number of higher education providers in the local authority
Before we look into the research question in more detail, it is perhaps helpful to begin by offering a brief overview of some of our key variables. Figure 1 plots the qualifications variable in the form of a histogram. What we can see from this chart is that the data is positively skewed with a small number of areas with a relatively large proportion of residents who hold a Level 4 qualification or above. These are all located in London and include places like Camden or Westminster. The vast majority of localities have shares of 30% or below, with the median value being 26%.
Figure 1: The distribution of the Census 2011 qualification variable across the UK at local authority level

Meanwhile, Figure 2 supplies a histogram of the productivity data we ingest from the ONS. As these are indexed, a value of 100 indicates the UK average. Consequently, the productivity of an area with a figure of 75 (for example) is 25% below the UK average. As with the qualifications data, we see a positive skew with the majority of areas having productivity levels below the average, though we have a small proportion of highly productive localities (typically found in London and south eastern England).
Figure 2: The distribution of productivity across the UK at local authority level

Finally, given the large number of data points we have (374), one way to evaluate the association between education and productivity is to split the qualifications variable into deciles and to then plot the median productivity value in each of these deciles (additional summary statistics on the categorical qualifications variable can be found in the appendix). Hence, the value furthest to the left (right) will represent the 10% of areas with the smallest (highest) proportion of residents with Level 4 qualifications or above. This is what we do in Figure 3 from which the positive correlation between the two variables is apparent. Alongside this, we see evidence of the UK having a small number of areas with both high levels of productivity (on average) and a relatively large share of individuals with Level 4 qualifications or above.
Figure 3: The association between education and productivity in the UK

Key findings
Given the ambition to increase prosperity in an equitable manner at a time of tighter fiscal budgets, the data point from Figure 3 that merits further investigation in the first instance is the one to the far left. Here, we have a cluster of areas which have both the lowest productivity levels (on average) and proportion of residents with Level 4 qualifications or above across the country. So, what are the characteristics of these 38 local authorities?
Firstly, the qualifications variable we use from the Census tells us about the education levels of an area at a particular point in time (i.e. in March 2011). To understand how this might evolve, we also need to explore the inflow/outflow of individuals from an area. While we do not currently capture location of domicile after graduation in the Graduate Outcomes survey, our net inflow/outflow variable does offer some indication as to whether an area may be attracting/retaining graduates. In only 5 of the 38 areas that form part of the lowest decile do we see an inflow of graduates (Blackpool, Harlow, Hull, Middlesborough and Stoke-on-Trent). All other localities report an outflow. One other limitation of this examination is that we are collecting data at 15 months after graduation and it may be that different patterns emerge were we able to track individuals for a longer period of time after they had completed their course.
Table 1 draws upon the area classifications developed by the ONS for the 2011 Census and we see that these areas typically have a mining, manufacturing or industrial legacy. Examples of the types of localities that emerge include West Dunbartonshire, Merthyr Tydfil and Knowsley (a full list of the local authorities and associated classifications/summary statistics is supplied through the interactive map).
Table 1: The ONS area classifications for those local authorities that emerge in the lowest decile based on the proportion of residents with Level 4 qualifications or above.
| ONS Area classification | Number of local authorities | Proportion (%) |
|---|---|---|
| Services, Manufacturing and Mining legacy | 17.0 | 44.7 |
| Manufacturing Traits | 9.0 | 23.7 |
| Remoter Coastal Living | 3.0 | 7.9 |
| Scottish Industrial Heritage | 3.0 | 7.9 |
| Suburban Traits | 3.0 | 7.9 |
| Country Living | 2.0 | 5.3 |
| Town Living | 1.0 | 2.6 |
| Total | 38.0 | 0.0 |
Meanwhile, Table 2 shows how the number of providers varies based on our qualifications variable when segmented into deciles. In particular, we note that 66% of localities in the bottom decile are reported to have no higher education provision. Furthermore, even among those that do, there tends to be only one provider in the area. Indeed, the key distinction between the bottom two deciles and the other groups is that the higher deciles all have a greater proportion of places with at least 2 providers. Decile 10 appears an outlier with 70% of local authorities having multiple providers in the vicinity.
Table 2: The number of providers by the Census qualification variable. Decile 1 represents the places with the lowest proportion of residents who have Level 4 qualifications or above, with 10 being the localities with the highest proportions.
| 0 providers (%) | 1 provider (%) | 2 or more providers (%) | Total | |
|---|---|---|---|---|
| Decile 1 | 65.8 | 26.3 | 7.9 | 38 |
| Decile 2 | 62.2 | 32.4 | 5.4 | 37 |
| Decile 3 | 46.2 | 35.9 | 18.0 | 39 |
| Decile 4 | 41.7 | 30.6 | 27.8 | 36 |
| Decile 5 | 51.4 | 24.3 | 24.3 | 37 |
| Decile 6 | 39.5 | 31.6 | 29.0 | 38 |
| Decile 7 | 48.7 | 21.6 | 29.7 | 37 |
| Decile 8 | 55.3 | 21.1 | 23.7 | 38 |
| Decile 9 | 48.7 | 29.7 | 21.6 | 37 |
| Decile 10 | 24.3 | 5.4 | 70.3 | 37 |
Of course, higher education providers don’t only have a role to play in raising skill levels in an area through offering residents the opportunity to enrol on courses leading to higher qualifications. One of the key aims of widening participation activity within all countries of the UK is to raise aspiration and attainment among school pupils. Unfortunately, we were unable to add school attainment directly into our file. This is partly down to there being differing education systems across the four nations, but also due to attainment data sometimes being released at a different geographic domain to that used in our dataset. For example, the Department for Education in England supply Key Stage 4 data at upper tier local authority level, whereas we use lower tier geography in our work.
Nevertheless, where upper and lower tier local authorities are equivalent, we are able to provide summary statistics on attainment in England within those areas which are least likely to have residents with Level 4 qualifications or above. This information is supplied in Table 3, where we see that some of the lowest performing local authorities at Key Stage 4, such as Blackpool and Knowsley, are captured.[16] All of these areas have attainment that falls below the national average. Furthermore, in Wales, official statistics released by the Welsh Government (2019) show Blaenau Gwent and Merthyr Tydfil had the lowest capped point scores.[17] In Scotland, places like West Dunbartonshire and North Lanarkshire tend to have a smaller proportion of school leavers who achieve at least 5 awards at SCQF level 5 or better when compared with the national average.[18]
Table 3: Attainment 8 score (Key Stage 4) in selected local authorities in England that fall within the lowest decile based on the proportion of residents with Level 4 qualifications or above. Figures are for the 2022/23 academic year.
| Local authority | Attainment 8 score |
|---|---|
| Barnsley | 43.8 |
| Blackpool | 34.9 |
| Doncaster | 44.4 |
| Halton | 42.6 |
| Hartlepool | 41.2 |
| Kingston upon Hull, City of | 42.9 |
| Knowsley | 33.2 |
| Middlesbrough | 40.0 |
| North East Lincolnshire | 40.0 |
| Oldham | 42.9 |
| Rotherham | 43.1 |
| Sandwell | 42.4 |
| Stoke-on-Trent | 40.4 |
| Sunderland | 42.8 |
| Tameside | 43.2 |
| Thurrock | 43.8 |
| Wakefield | 45.6 |
| Walsall | 44.1 |
| Average attainment 8 score in England | 46.2 |
Concluding remarks
Against the backdrop of a less favourable fiscal climate, a primary aim of policy across the UK over coming years is to raise productivity and growth – especially in those areas where living standards are lagging behind the rest of the nation. While the literature provides evidence that raising skills and qualifications can help boost productivity, data is required to understand which areas could particularly benefit from investment in education at a time of more restrained resource. This briefing has attempted to begin addressing this challenge.
The key take-away message from our examination is as follows. There are a group of local authorities across the UK which exhibit both the lowest productivity levels (on average) and proportion of residents with Level 4 qualifications or above. School level attainment is also often below the national average. The evidence suggests these localities (often parts of the country with a mining, manufacturing or industrial legacy) continue to see an outflow of graduates and have less higher education provision when compared to other vicinities. Furthermore, based on the HESA measure of deprivation, 44% of small/output areas within these local authorities fall within the lowest quintile and hence represent some of the most deprived communities across the country.[19]
While we use Census 2011 data to determine qualification levels in an area, evidence presented by the Resolution Foundation (2022) does suggest that this statistic does not appear to change greatly over time.[20] The key drawback to our study at present, therefore, is the lack of data we hold on higher education provision through further education colleges.
To tackle the growth and inequality challenge, the Resolution Foundation (2023) have suggested that part of the solution will require the UK to increase the proportion of workers with sub-degree qualifications such as HNCs/HNDs (both examples of qualifications that would generally emerge in the ‘Level 4 qualifications or above’ category in the Census).[21] Indeed, they argue that addressing this matter is likely to necessitate expanding both the types of provision on offer, as well as potentially creating new providers to serve ‘cold spots’. This leads to the question of where such locations can be found. For instance, Millward (2023) points out that our industrial and coastal towns (as well as our rural communities) tend to have colleges located within them, as opposed to universities.[22] Currently though, we don’t hold information on both universities and colleges in one place to fully assess the extent to which this is true, meaning we have an incomplete picture of the supply of higher education courses across the UK. This is the next piece of the puzzle that is needed if we are to understand exactly how investment in education could form part of the solution in raising living standards in areas that have faced economic decline in recent decades.
[4] https://forklightning.substack.com/p/can-cross-country-income-differences?mc_cid=67dc5754cf&mc_eid=e32ca2a3c0
[7] As local authorities can change over time (e.g. due to mergers), we rely on the latest cut of data we work with to determine the local authority of the provider.
[9] The data can be found at https://www.nomisweb.co.uk/census/2011/bulk/r2_2#KeyStatistics, https://www.scotlandscensus.gov.uk/census-results/download-data/census-table-data/ and https://www.nisra.gov.uk/publications/2011-census-key-statistics-tables-qualifications.
[10] It should be noted that HNCs/HNDs are placed in the Level 3 qualifications category within Scotland, but Level 4 within all other nations.
[11] Additionally, some local authorities in England/council areas in Scotland have seen their code changed over time. To ensure the data could be successfully linked, we updated the codes to the latest versions in all of our files prior to ingestion.
[12] The data can be found at https://www.ons.gov.uk/methodology/geography/geographicalproducts/areaclassifications/2011areaclassifications/datasets
[13] Merged local authorities in England (representing 8 out of the 374 observations) were allocated a category of ‘Multiple’ in our dataset, as the individual areas that formed part of the new authority had been given different classifications based on the Census 2011 data.
[14] https://www.ons.gov.uk/employmentandlabourmarket/peopleinwork/labourproductivity/datasets/subregionalproductivitylabourproductivityindicesbylocalauthoritydistrict
[16] https://explore-education-statistics.service.gov.uk/find-statistics/key-stage-4-performance-revised
[17] https://www.gov.wales/sites/default/files/statistics-and-research/2020-01/examination-results-september-2018-august-2019-revised-477.pdf
[19] Further information on our measure of deprivation can be found at https://www.hesa.ac.uk/insight/08-11-2022/new-area-based-measure-deprivation-summary. Interactive maps relating to our measure of deprivation will be published as experimental statistics on Tuesday 19th March 2024.


Contents
- Insight
- Appendix