Projected outcomes: Technical notes and detailed information (table 5)
The projected outcomes have been produced using a census cohort approach. The method involves identifying a group of starting students known as a cohort, consisting of all students who started at the HE provider (HEP) on a full-time first degree course of study in a particular year. Their future progression outcomes – whether they qualify, transfer to another HE provider, or do not continue – are then projected, based on current progression patterns at their HE provider.
This page provides details of the method used. Supplementary table SN4 shows the complete transition matrix for the sector, of the type used to produce table T5. A similar matrix was calculated for each HE provider.
Technical details
General information
The progression behaviour of all the students at a HE provider can be summarised in a transition matrix. The rows of this matrix are possible states in the reference year (state 0), the columns possible states in the following year (state 1). The values in the cells of each row are the proportions of students from state 0 who make the transition to state 1. State 0 (row) might be ‘full-time first degree year of programme 1’, a possible state 1 (column) could be ‘full-time first degree year of programme 2’; the value at their intersection would be the proportion of students who are on year of programme 1 of a full-time first degree who then move to year 2 of that degree. By defining other modes or levels of study and inactive states, we can allow for students returning to study or being awarded a degree, for example, from part-time.
A student is assumed to have qualified with a first degree from the reference year if QUAL on the HESA record for that year is one of the first degree qualifications, see definitions for details. This also applies to QUAL equal to H24 if they are not continuing at the same HE provider on a full-time first degree course in the following year. Students who are found on a postgraduate course at the same HE provider in the following year are also assumed to have qualified with a first degree.
It is assumed that the probability of moving from state 0 to state 1 is the same, regardless of how the state has been reached. So, for example, this means that a student who has gone from first year to second year and is now in the third year of a degree has the same probability of qualifying at the end of the year as a student who transferred in to the second year of the course from another HE provider, or one who repeated a previous year. It also means that we allow the possibility of a student repeating a year more than once (which in practice is usually not acceptable). Although the assumption is not completely accurate, any errors it introduces are generally small. The effect of the errors will usually be to slightly underestimate the proportion of students leaving with no qualification and overestimate the time a student will spend in the system.
Some small HE providers and HE providers which have made major changes, either to the format of their degree programmes or to the way they record that format, may find that the projections lead to some students going into a state and not out of it. This can occur if there were no students in a particular state during one academic year, but there was movement into that state in the next academic year. For example, if a HE provider had no five-year-long programmes of study, but introduced such programmes so that the first year of programme 5 was to be in 2008/09, we would have a record of students moving into year of programme 5, but no record of students moving out of it. This would lead to a number of unknown outcomes.
Projected outcomes
To ensure that the data used in the calculations are robust, it is important to define the stage that a student has reached by reference to four years of data. These are: the ‘reference year’, which is the year to which all calculations relate; the two years prior to the reference year; and the year following the reference year. For the 2010/11 publication, the reference year is 2009/10.
At present, the method used is restricted to students who are residents of the United Kingdom, excluding Guernsey, Jersey and the Isle of Man, who are studying full-time for a first degree. In what follows, the term ‘student’ is taken to refer to someone with all these characteristics, unless it is further clarified.
There are three relevant states in which a student can be in any one year. These are:
- State A: Active at the HE provider as a full-time student with first degree qualification aim
- State B: Active at the HE provider as an undergraduate student not in state A (could be full-time other undergraduate, part-time degree and so on)
- State C: Not active at the HE provider as an undergraduate student (could be at another HE provider).
The starting population consists of students who are currently studying full-time for a first degree (in other words, are in state A) and were not in this state in either of the previous two years (in other words, were in one of the states B or C in the two years preceding the reference year). Note that no use is made of the date of commencement of studies in defining the starting population. The term ‘entrants’ is reserved for students reported as commencing studies in a given year, and ‘starters’ for members of the starting population as defined here.
As well as the starting population, we need to define a ‘transition population’, which will be used to determine the pattern of progression at the HE provider. This transition population is defined as all students who are in state A at the HE provider in the reference year, plus all those students who were in state A in the previous year and are in state B or state C in the reference year but have not obtained a first degree. This is essentially all students who are currently, or were in the previous year, full-time first degree students.
For each student in the transition population, we need to know what year of programme they are on in the reference year, or what year of programme they were on previously if they are currently in state C. For the year following the reference year, we need to know
- If they have qualified with a first degree or an other undergraduate qualification
- Which year of programme they are on if they are still at the HE provider and whether they are still studying full-time for a first degree
- If they have transferred to an other undergraduate or part-time programme
- If they have transferred to another HE provider.
A student is assumed to be 'absent’ if there is no record of the student as a full-time first degree student in the reference year (state B or C) and no record as an undergraduate student in the next year (state C). A student who is in state A in the reference year, but for whom no record can be found the following year, is initially deemed to become ‘inactive’, with the possibility of returning to the HE provider in the following year. It is only if students cannot be traced for a second year that they are categorised as ‘absent’.
A student who is awarded an other undergraduate qualification from state A is also initially placed in the inactive state. This allows for students who may return after a year to complete their degree programme. Students in state B in the reference year are categorised as failing to get an award if they cannot be traced in the following year.
To calculate the transition matrix, the state of the student in the reference year (state 0) and in the following year (state 1), need to be specified more fully. The specification includes mode of study, year of programme and whether or not the student has obtained a qualification. The values in the matrix are then found as:
tij = nij/ni
where nij is the number of students at the HE provider with i as their state in the reference year and j as their state in the following year, and ni is the number of students at the HE provider with i as their state in the reference year.
A simplified form of the transition matrix for the sector is shown in table SN4, with an explanation of the states used given below. The actual computations have used a more detailed matrix than that shown in table SN4, with the inactive and transfer categories separated by year of programme.
The matrix used in calculating the adjusted sector benchmarks is produced in a similar way, using all the students in the sector. However, each student is given a weight which reflects the relative importance of his or her subject of study, age and entry qualifications at the HE provider and it is the sums of these weights, rather than the actual number of students, that are used to calculate the values in the matrix. The weights are defined as:
- nj / n
- Nj / N
- where nj is the number of students in category j at the HE provider, Nj is the number of students in category j in the sector, and n and N are the total number of students in the population in the HE provider and the sector respectively.
Several of the states are what are known as ‘sink states’. Such states are characterised by the fact that once a student enters such a state, that is the end of their progress through the system as far as the HE provider is concerned. Four of the fifteen states shown are sink states, namely ‘qualifying with a degree’, ‘qualifying with an other undergraduate qualification without subsequent degree-level study’, ‘transfer’ and ‘absent’. Students cannot return to the HE provider, as a continuous part of their progress, from any of these states.
The data are then used to create a transition matrix T from the students in the transition population. Each row represents a state in the reference year (state 0), with each column representing a state in the following year (state 1). Each row of the matrix contains details of the percentage of students who were in the row state in the reference year, who are in the column state in the following year. Rows representing sink states contain only one non-zero value, on the diagonal, as all students in such a state will remain there.
The starters are described by the vector n which gives the number of starters in each of the states. All starters will be on a first degree programme and most will be in year of programme 1, but at some HE providers there may be considerable numbers of starters in later years.
The progression of the starters can be computed by applying the transition matrix to the vector of starters. After i years the cohort will be in state n.Ti-1. We make the assumption that after 15 iterations, which represents a period of 15 years, the numbers of students qualifying or transferring will no longer change.
There are some circumstances – for example, when a HE provider is starting a new course, or changing the pattern of an existing course – when there are values in the state vector q=n.Ti-1 for large i which are not in sink states. In such cases the outcome is recorded as unknown, and the projected outcomes should be treated with caution.
Standard deviations
The method of obtaining the adjusted sector outcomes is explained above. The table below shows the notation used to denote the proportions of students in each outcome category for both actual and adjusted outcomes.
We have only calculated the standard deviation for the ‘neither transfer nor obtain any qualification’ outcome category. If there are n starters at a HE provider, and the benchmark for this outcome category is (100 × )%, then the standard deviation of the proportion in category d has been calculated as
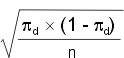
which assumes that the n starters have been chosen randomly from a large population in which of the population is in category d and (1-) is in one of the other categories. This assumption is reasonably good unless the pattern of outcomes of the benchmarks is quite different to the pattern of the actual values.
Transition matrix and starters
Table SN5 shows the sector profile of starters on first degree courses by year of entry to the course. The majority of students start on the first year, a small percentage on foundation year and a few start in year 2 or later. The supplementary table SN4 shows the transition matrix for the sector. As can be seen, most students in a particular state either move to the next year of programme, or qualify.
The transition matrices are only looking at patterns of movement for a particular HE provider. A student who transfers elsewhere is counted as being at the end of their course, as far as that HE provider is concerned. However, many of these transferring students will go on to obtain a qualification at their new HE provider.
States used in the transition matrix
| State | Description | Final state* |
|---|---|---|
| QFD | Qualified with degree | Degree |
| QOUG | Qualified with other undergraduate qualification | Other award |
| FT FD 0 | On full-time first degree, year 0 (foundation) | Not known |
| FT FD 1 | On full-time first degree, year 1 | Not known |
| FT FD 2 | On full-time first degree, year 2 | Not known |
| FT FD 3 | On full-time first degree, year 3 | Not known |
| FT FD 4 | On full-time first degree, year 4 | Not known |
| FT FD 5 | On full-time first degree, year 5 | Not known |
| FT FD 6+ | On full-time first degree, year 6 or above | Not known |
| FT OUG | On full-time other undergraduate programme (having previously been FT FD) | Not known |
| PT FD | On part-time first degree (having previously been FT FD) | Not known |
| PT OUG | On part-time other undergraduate programme (having previously been FT FD) | Not known |
| Transfer | Transferred to another HEP | Transfer |
| Inactive | Not currently in HE, but was FT FD in previous year | Not known |
| Absent | Absent from HE | Neither award nor transfer |
* Indicates the category in which the student will fall if they are still in that state at the end of the 15 year projection.
Progression types
The progression types are defined as follows:
| Order | Link type | Description |
|---|---|---|
| 1 | 1QFD | Qualify first Degree |
| 2 | 2FFD | Continue on full-time first degree |
| 3 |
|
|
| 4 |
|
|
| 5 | 5QOU | Qualify other undergraduate |
| 6 |
|
|
Progression from year x to year y (applicable to table T5).
| Order | Instid | Mode of study year y | Level of study year y | Level of qual year x | Level of qual year y | Active in year y | Left year y | Progress year y |
|---|---|---|---|---|---|---|---|---|
| First degree qualifiers in year x (regardless of if they link or not): | ||||||||
| 1 | N/A | N/A | N/A | First degree or intercalated or higher | N/A | N/A | N/A | 1QFD |
| Those who don't link to year y: | ||||||||
| 2 | N/A | N/A | N/A | Intercalated first degree | N/A | N/A | N/A | 1QFD |
| 3 | N/A | N/A | N/A | Other undergraduate | N/A | N/A | N/A | 6INA |
| 4 | N/A | N/A | N/A | N/A | N/A | N/A | N/A | 6INB |
| Active students in year y who haven't left before 1 December in year y: | ||||||||
| 5 | Different | N/A | First degree or other undergraduate | Intercalated first degree | N/A | yes | no | 1QFD |
| 6 | Different | Full-time | First degree | N/A | N/A | yes | no | 4TFFD |
| 7 | Different | Full-time | Other undergraduate | N/A | N/A | yes | no | 4TFOU |
| 8 | Different | Part-time | First degree | N/A | N/A | yes | no | 4TPFD |
| 9 | Different | Part-time | Other undergraduate | N/A | N/A | yes | no | 4TPOU |
| 10 | Different | Full-time or part-time or writing-up |
Postgraduate | N/A | N/A | yes | no | 4TPG |
| 11 | Same | Full-time | First degree | N/A | N/A | yes | no | 2FFD |
| 12 | Same | Full-time | Other undergraduate | Intercalated first degree | N/A | yes | no | 1QFD |
| 13 | Same | Part-time | First degree or other undergraduate | Intercalated first degree | N/A | yes | no | 1QFD |
| 14 | Same | Full-time | Other undergraduate | N/A | N/A | yes | no | 3FOU |
| 15 | Same | Part-time | First degree | N/A | N/A | yes | no | 3PFD |
| 16 | Same | Part-time | Other undergraduate | N/A | N/A | yes | no | 3POU |
| 17 | Same | Full-time or part-time or writing-up |
Postgraduate | N/A | N/A | yes | no | 1QFD |
| 18 | N/A | Full-time or part-time |
Further education | Intercalated first degree | N/A | yes | no | 1QFD |
| 19 | N/A | Writing-up, Sabbatical or dormant |
N/A | Intercalated first degree | N/A | yes | no | 1QFD |
| 20 | N/A | N/A | N/A | Other undergraduate | N/A | yes | no | 6INA |
| 21 | N/A | N/A | N/A | N/A | N/A | yes | no | 6INB |
| Students who left before 1 December in year y: | ||||||||
| 22 | Same | N/A | N/A | N/A | First degree or intercalated or higher | N/A | yes | 1QFD |
| 23 | Same | N/A | N/A | Intercalated first degree | N/A | N/A | yes | 1QFD |
| 24 | N/A | Full-time or part-time | Further education | Intercalated first degree | N/A | N/A | yes | 1QFD |
| 25 | N/A | Full-time or part-time | N/A | Intercalated first degree | N/A | no | yes | 1QFD |
| 26 | N/A | Writing-up, Sabbatical or dormant | N/A | Intercalated first degree | N/A | N/A | yes | 1QFD |
| 27 | Same | N/A | N/A | N/A | Other undergraduate | N/A | yes | 6INA |
| 28 | N/A | N/A | N/A | Other undergraduate | N/A | N/A | yes | 6INA |
| 29 | N/A | N/A | N/A | N/A | N/A | N/A | yes | 6INB |
| All other students: | ||||||||
| 30 | N/A | N/A | N/A | Intercalated first degree | N/A | no | no | 1QFD |
| 31 | N/A | N/A | N/A | Other undergraduate | N/A | no | no | 6INA |
| 32 | N/A | N/A | N/A | N/A | N/A | no | no | 6INB |
A student is deemed absent if their link type is inactive (6INA and 6INB) for two consecutive years or their link type is other undergraduate or part-time (3FOU, 3PFD and 3POU) between reference year minus 1 and reference year and inactive (6INA and 6INB) between reference year and reference year plus 1. Therefore, only students who are not active on a full-time first degree course in the reference year can go absent.
For absent students, update their link type to qualify with other undergraduate qualification (5QOU) if any of the following are applicable:
- They have an other undergraduate qualification in the reference year or the reference year minus 1.
- They have an other undergraduate qualification in the reference year plus 1 at the same HE provider and they left before 1 December.
Sector projected learning outcomes (supplementary table SN6)
A new table was produced in 2006/07 which looks at the HE sector projected learning outcomes of full-time students starting first degree courses. The method used to produce this table is the same as that used to produce table T5, but instead of looking at each HE provider individually, they are all treated as one large HE provider. Using this technique, students who transfer between HEPs are treated as continuing, therefore the percentage of students projected to transfer between HE providers will be zero. Since students may be registered at multiple HE providers, the transition and starters populations used to produce table SN6 will be lower than those used to produce table T5 as duplicate registrations of students across all HE providers have been removed.