Research indicators: technical notes and detailed information
The research indicators used here are based on two measures of input and two measures of output. Three of these measures are available through the HESA collections, while the fourth is obtained from the funding councils.
The four indicators are:
- Proportion of PhDs awarded per proportion of academic staff costs
- Proportion of PhDs awarded per proportion of funding council quality-related research (QR) funding allocation for research
- Proportion of research grants and contracts obtained per proportion of academic staff costs
- Proportion of research grants and contracts obtained per proportion of funding council QR funding allocation for research.
Prior to 2009/10 these indicators use QR funding data relating to the Unit of Assessment the member of staff was associated with in the 2001 RAE. From 2009/10, the indicators use QR funding data relating to the Unit of Assessment the member of staff was associated with in the 2008 RAE.
The QR funding data included research capability funds up until 2008/09 when they were last allocated. Elements of QR funding which are not calculated by subject, such as the business research element and funding for national research libraries have been excluded from the QR funding figures.
The indicators used are standardised by cost centre, as explained below. A value of 1 for an indicator shows that the HE provider is producing the same as the rest of the sector, relative to its input. A value below 1 shows it is producing less than the sector, and a value greater than 1 shows that it is producing more than the sector, again relative to its input.
To put the indicators into context, the number of active cost centres under each input heading has been included. In addition, the amount of QR research funding which a HE provider receives from the funding council has been included, along with the percentage that this forms of the total funding council allocation to that HE provider.
From 2012/13, the cost centres used in the production of the research indicators changed, see HESA Cost Centres for more details. This has resulted in a larger number of cost centres (in 2011/12, the RAE 2008 units of assessment were mapped to 33 cost centres and in 2012/13 they were mapped to 42 cost centres). As a result, the research indicators for 2012/13 may not be strictly comparable with those prior to this.
Measuring input to research
There are a number of problems in creating a measure of research input. These arise partly because data on expenditure are not split between research and teaching. There is therefore no one ideal input measure, so it is proposed to use two complementary measures. These are:
Academic staff costs. This measure is available for all HE providers by cost centre from the HESA finance record. It is therefore more complete than any based on the staff returns, although no separation of expenditure on research from that on teaching is possible. The figures shown in table R1 include academic staff costs relating to academic cost centres only.
Research income from funding councils. The measure based on academic staff costs takes no account of the varying relative levels of resources spent on research and teaching. The measure proposed here, the research income from funding councils allocated for quality (QR funding), aims to provide an indicator that does take account of the varying level of resources available for research. It is based on the funding allocation model used to allocate the recurrent research funds. Such funds form part of the block grant, which HE providers are free to distribute internally as they see fit. This measure assumes that this internal distribution will follow the funding allocation model used by the funding council. This, in general, will not be the case, so the measure will provide only a rough indication of what funds go where. The research funding is allocated by 69 RAE 2001 units of assessment or 67 RAE 2008 units of assessment. These have been mapped to 33 cost centres prior to 2009/10; 28 cost centres from 2009/10 to 2011/12 and 42 cost centres in 2012/13.
Measuring research output
Similarly, two measures of research output based on HESA records are proposed:
PhDs awarded. The number of doctoral degree completions provides a measure of the vitality of the HE provider in educating new researchers. The number of PhDs has been taken from the current HESA student record, summing records with a qualification obtained of ‘PhD mainly by research’. The cost centre has been identified through the same record, wherever possible, or from records for the student in previous years. In some cases, we have had to map the subject of study to cost centre.
Research grants and contracts. Although this could be thought of as an input, it also provides a measure of the success of researchers in attracting funds over and above those allocated by the funding councils. The value of research grants and contracts comes from the current HESA finance record. The figures shown in table R1 relate to academic cost centres only.
Standardising for subject variation
There are often differences in the characteristics of research output between subjects. These can be adjusted for by making the measure specific to cost centre. If the output is, say, research contract income, then the indicator treats a pound of income as a different ‘currency’ of research output for each cost centre. This is done by looking not at the actual input and output, but at what proportions they form of the sector input and output. This means that HE providers whose research is primarily in areas where the unit costs are low are not at a disadvantage compared with HE providers whose research is mainly in areas with high unit costs.
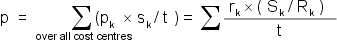
The computation of the indicators is carried out as follows. Let:
- rk = research output of HE provider
- Rk = research output of sector
- sk = input to HE provider
- Sk = input to sector
- all in cost centre k.
Then,  is the total input to the HE provider.
For cost centre k, the relative performance of a HE provider, pk, is given by:

The overall performance of the HE provider, p, is then calculated by summing these cost centre ratios using the weighting (sk/t):
Measures of coverage
To put these indicators into context, a number of measures of coverage were considered. The ones included in the table are amount of research funds from the funding councils, the percentage of funding from the funding councils allocated for research, and the total number of cost centres to which there is some input.
In addition, the table available under 'Extended' contains a measure of how different the HE provider’s pattern of provision is from the sector’s pattern. This is called a measure of specialisation, and it can be used in conjunction with the number of cost centres to give an indication of how specialist a HE provider is.
Context statistics
There is one context statistic for the research indicators, which has been called a ‘measure of specialisation’. It is designed to be used, in conjunction with the number of active cost centres, to show how comparable the HE provider is to others in the sector with regards to the spread of research quantity across cost centres.
If a HE provider has only one active cost centre, then the measure of specialisation gives a value of zero. In such cases, the HE provider is clearly very specialised, in the sense that it is concentrating all its research effort into one cost centre, so the measure of specialisation is unnecessary.
If a HE provider has more than one cost centre, the measure of specialisation gives an indication of how research activity (as measured by the input, that is either academic staff costs, or funding council allocation for research) is spread across these cost centres compared with how it is spread across the same centres in the sector as a whole. If the HE provider is similar to the sector in the way its research activity is spread across its cost centres, the measure of specialisation will be close to zero. If the HE provider is very different from the sector in the way its research activity is spread across its cost centres, then the measure of specialisation will be closer to one. In practice, it is rare for a value greater than 0.2 to occur, and any HE provider with such a value can be regarded as very different from the rest of the sector. Also in practice, HE providers with high numbers of active cost centres have very low values for the measure of specialisation, which is not unexpected as such HE providers are generally not very specialised.
The measure of specialisation depends on the inputs to the HE provider in each cost centre, and to the sector as a whole, again for each cost centre. Let sk be the input to the HE provider in cost centre k, and Sk be the input to the sector in cost centre k. Then t = ∑(sk) is the total input to the HE provider for all subjects.
In addition, for the HE provider of interest let
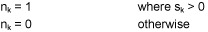
Then the number of active cost centres at the HE provider, n, is given by n = ∑(nk)
The measure of specialisation, d, for the HE provider can be derived as follows:
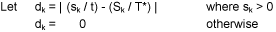
where  is the total input to the sector across all cost centres that are active at the HE provider (so the sum is over all values of k for which sk > 0). Then the measure of specialisation is d = ∑(dk/n)
Rounding strategy
Due to the provisions of the Data Protection Act 1998 and the Human Rights Act 1998, HESA implements a strategy in published and released tabulations designed to prevent the disclosure of personal information about any individual. This strategy involves rounding all numbers to the nearest 5. A summary of this strategy is as follows:
- 0, 1, 2 are rounded to 0
- All other numbers are rounded to the nearest 5.
So for example 3 is represented as 5, 22 is represented as 20, 3286 is represented as 3285, while 0, 20, 55, 3510 remain unchanged.
This rounding strategy is also applied to total figures; the consequence of which is that the sum of numbers in each row or column will rarely precisely match the total shown.
Average values, proportions and FTE values prepared by HESA will not be affected by the above strategy, and will be calculated on precise raw numbers. However, percentages and indicators calculated on populations which contain less than 22.5 individuals will be suppressed and represented as a blank value.