Introduction - Destinations of Leavers 2009/10
DLHE population
This product draws on the Destinations of Leavers from Higher Education (DLHE) survey and provides first phase information about patterns of employment and further study or training at a point about six months after completion. The second phase is a follow-up survey on a sample basis approximately three years and six months after completion. All subsequent references to DLHE in this volume relate to the first phase.
The DLHE survey covers full-time and part-time qualifiers who were of UK and other EU domicile at the point of entry, it excludes those domiciled outside the EU. The survey includes those qualifiers who completed their programmes during the academic year 2009/10, that is, the period 1 August 2009 to 31 July 2010. The reference date for those obtaining the qualification between 1 August 2009 and 31 December 2009 was 19 April 2010, and the reference date for those obtaining the qualification between 1 January 2010 and 31 July 2010 was 10 January 2011. The purpose of splitting the collection in this way is to bring the gap between the date of qualification and the reference date closer to the six-month target.
The survey covers qualifiers from the 165 UK higher education institutions (HEIs). Of these, 164 were publicly-funded and one, The University of Buckingham, was privately funded. The data capture is undertaken by HEIs but the procedure is prescribed by HESA and, with some degree of detailed flexibility, is uniform across all institutions, regardless of size, nature, and location. A standard questionnaire printed by HESA is used; this is also available in Welsh, for use on request in Welsh institutions only.
Data from the DLHE return has been linked to the student record collection to allow analysis by student characteristics such as level of qualification, mode of study and subject of study.
Performance against target response rates
In 2009/10, 379,865 qualifiers provided information about their destinations from a possible 501,540 within the eligible DLHE population. This gives a percentage with known destination of 75.7%, an increase of 0.4% since 2008/09. A further 15,940 qualifiers replied to the survey but explicitly declined to give information. Including the explicit refusals, the overall response rate was 78.9%.
Chart 1 below illustrates the differences in response rates by mode of study and domicile (sourced from Table A). This chart illustrates that full-time qualifiers were more likely to respond than part-time leavers and that response rates were higher for UK domicile qualifiers then for other EU domicile leavers.
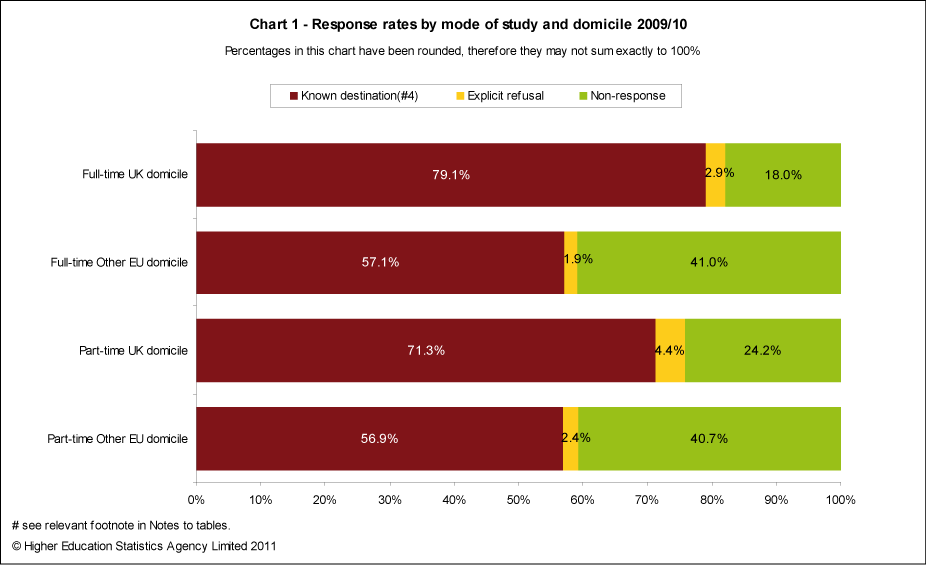
Table A provides the response rates and target rates by mode of study and domicile. It can be seen that for UK domiciled qualifiers, the full-time and the part-time response rate achieved the target by margins of 2.0% and 5.8% respectively. For other EU domicile qualifiers, the target rates were lower, but were achieved by even bigger margins at 9.0% for full-time and 9.3% for part-time. The response rates have improved across both UK and other EU students since 2008/09.
DLHE response rates vary greatly between institutions, and are dependent in part on the amount of resource committed by an institution to the various stages of the process. Information about the mode of collection (postal, telephone, web) is included in the returns made to HESA, and will inform the future development of the survey.
Throughout the remainder of this introduction, qualifiers from within the eligible DLHE population who gave a valid response to the survey are referred to as leavers.
UK and other EU domicile leavers
Chart 2 below illustrates the breakdown by activity of those leavers who were available for employment or further study at the point of the survey (sourced from Table B). The percentage of leavers in full-time paid work only (including self-employed) has increased from 53.5% in 2008/09 to 54.8% in 2009/10. In contrast, the percentage in further study only has decreased from 16.2% to 14.6%. The proportion assumed to be unemployed was slightly lower in 2009/10 at 7.7% compared to 7.9% in 2008/09.
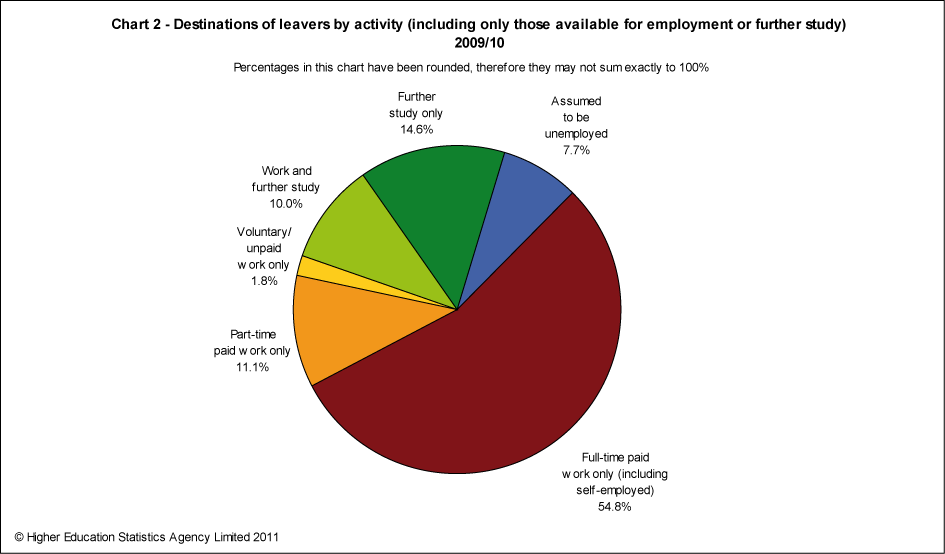
Table B provides a detailed breakdown of the responses to the DLHE survey by mode of study, level of qualification, gender and domicile. In this table, 'working only' comprises the categories of full-time paid work only (including self-employed), part-time paid work only, and voluntary/unpaid work but does not include work and further study combined. Similarly ‘further study only’ excluded those leavers in work and further study combined.
Of the 302,365 full-time leavers, 215,785, or 71.4% reported that they were working in either full- or part-time employment, or were self-employed or freelance, or were doing voluntary/unpaid work; including those studying as well as working. The number studying, including those working as well as studying, was 72,250, or 23.9%. The number assumed to be unemployed was 25,190, or 8.3%.
Of the 77,495 part-time leavers, 66,745, or 86.1% were working, and 2,785, or 3.6% were assumed to be unemployed. There were 17,280, or 22.3%, part-time leavers continuing to study, most of whom combined work with study.
Chart 3 below illustrates the differences in activity of first degree leavers by domicile and gender (sourced from Table B).
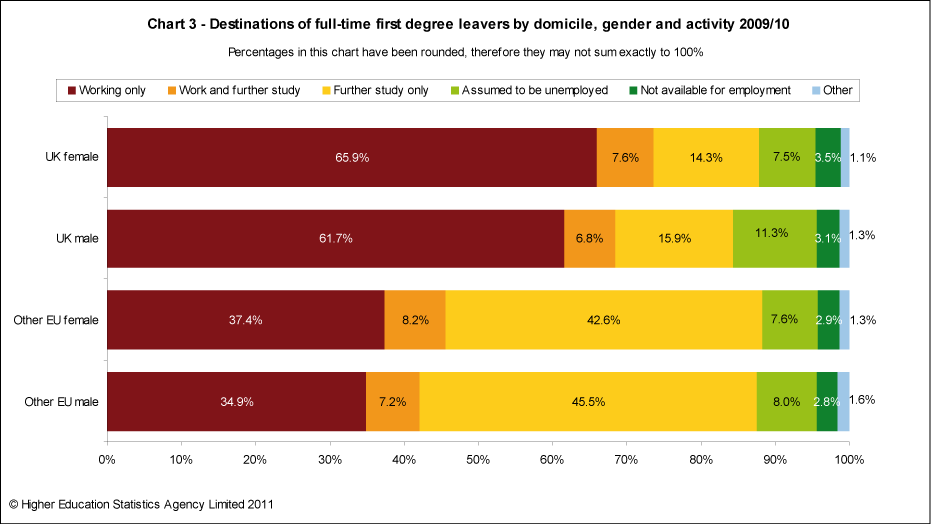
More than double the proportion of other EU domicile first degree leavers were engaged in further study only compared to UK domicile leavers. This was true regardless of gender. UK domicile first degree leavers were more likely to be in employment than other EU domicile first degree leavers. The percentage of UK and other EU first degree leavers who were unemployed was similar for females (7.6% compared to 7.5%), but higher for UK domicile male leavers than other EU male leavers (11.3% compared to 8.0%). However, it should be noted that the difference in response rates between UK and EU leavers could have an impact on the figures.
For full-time leavers, the unemployment rate was 7.4% for postgraduates, 9.1% for first degree students, and 5.3% for other undergraduates. For part-time leavers, the corresponding figures were 2.6%, 5.7% and 2.9%.
UK domicile leavers
The remainder of this introductory material reports numbers for UK domiciled leavers.
Table C provides a breakdown by destination of UK domiciled leavers by mode of study, level of qualification obtained, gender and age group. Those leavers of unknown age are included in totals but not shown separately.
Around a third of full-time and part-time other undergraduate leavers were engaged in further study, including those in work and further study, a proportion higher than that for first degree leavers. Unemployment rates for part-time leavers were considerably lower than for those for full-time leavers. Unemployment rates for female leavers were much lower than that for male leavers.
Of the 282,060 full-time leavers 204,295, or 72.4% were working and 64,485, or 22.9% were studying, both percentages include those who were engaged in work and further study. The number assumed to be unemployed was 23,390, or 8.3%.
Of the 75,190 part-time leavers, 64,940, 86.4% were working and 16,765, 22.3% were studying. The number assumed to be unemployed was 2,650 or 3.5%.
Unemployment rates of full-time leavers were 6.7% for postgraduates, 9.1% for first degree students, and 5.3% for other undergraduates. For part-time leavers the unemployment rates were lower for all levels of qualification, 2.4% for postgraduates, 5.6% for first degree leavers and 2.9% for other undergraduates.
Male full-time and part-time leavers were more likely to be unemployed than female leavers. The lowest unemployment rates were seen amongst older part-time female and male leavers at 2.8% and 3.4% respectively.
Younger leavers from both full-time and part-time programmes were more likely to be engaged in further study than older leavers.
Subject of study
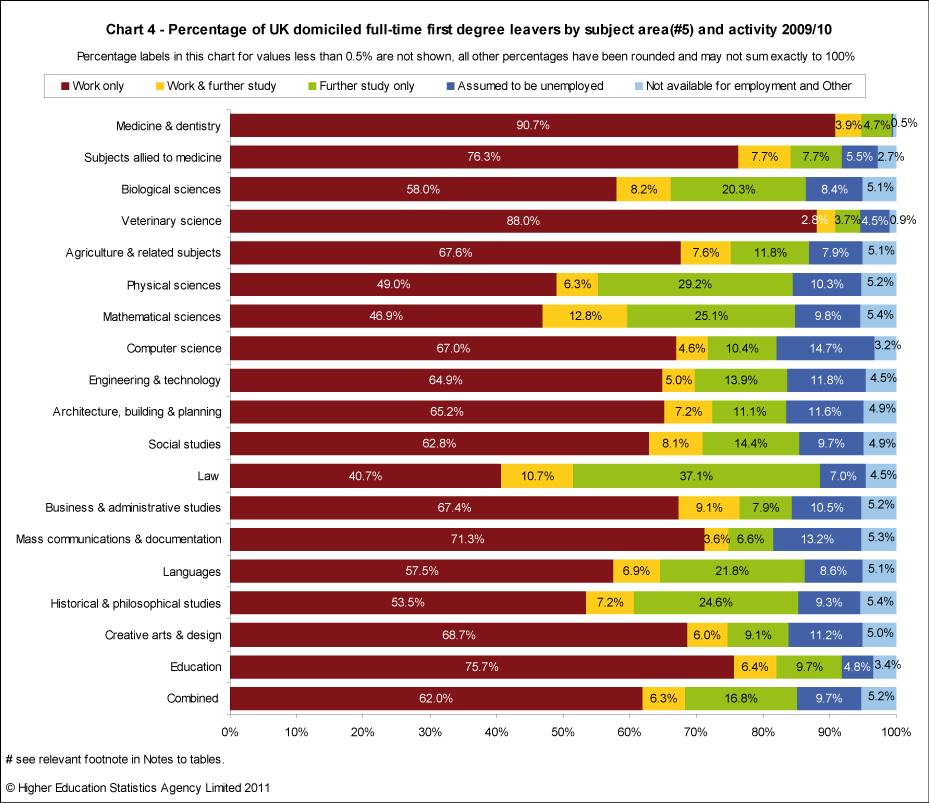
Table D shows the variation in work, study, and unemployment rates between subject areas for full-time first degree. In some cases the outcome could be characteristic of the subject area. For example, around half of leavers who studied Law (47.8%) were engaged in some kind of further study, which is a common path to qualification in that profession. In contrast, 90.7% of those who studied Medicine & dentistry and 88.0% of those who studied Veterinary science went into employment only and a further 3.9% and 2.8% respectively were engaged in work and further study. The figures for Medicine & dentistry should be interpreted in the light of the fact that these are quota-controlled subjects. The highest unemployment rate is seen amongst those who studied Computer science, at 14.7%.
Chart 4 below illustrates the variation in activity by subject area for full-time first degree leavers (sourced from Table D).
Occupational Classification
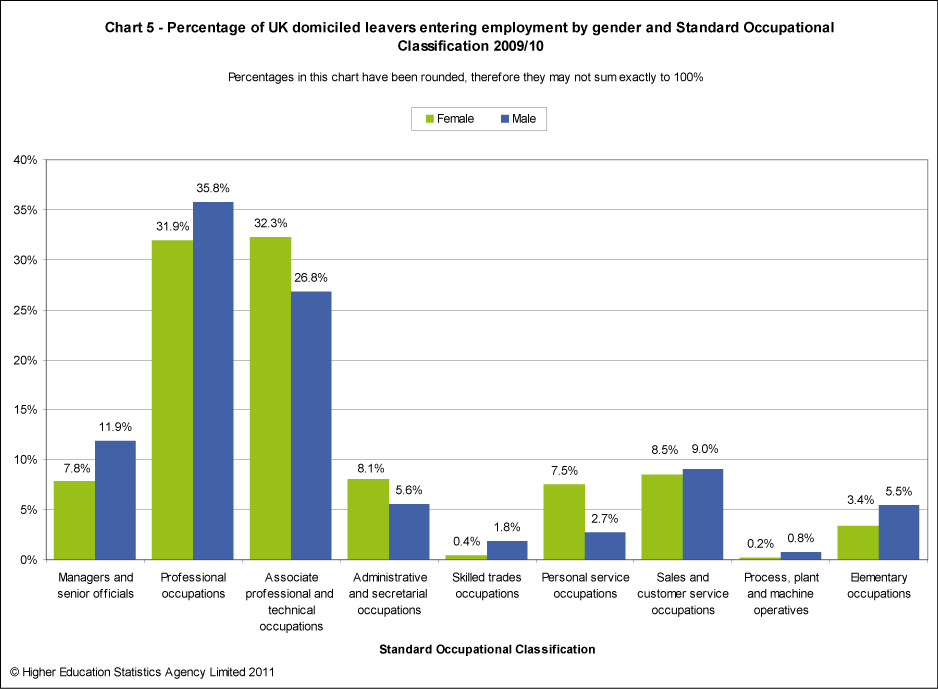
Among full-time first degree leavers who were working (including those who were also studying), 7.2% were in occupations classified as 'Managers & senior officials' and a further 25.5% 'Professional', whereas 6.3% were in 'Elementary occupations'.
Table E provides figures for leavers in employment, broken down by mode of study, level of qualification and gender, according to the Standard Occupational Classification of the work they were doing.
Chart 5 below illustrates the proportions of all leavers in employment, according to the Standard Occupational Classification of their employment, by gender (sourced from Table E).
Basis and location of work
Table F shows the work patterns of those leavers who were working by mode of study, level of qualification and gender. It includes those who were also continuing to study. For those in full-time paid work, it shows the location of work and, where known, the contract duration.
Of those full-time leavers who were working, 73.0% were in full-time paid work, 19.9% in part-time paid work, 4.3% were self-employed (or freelance), and 2.9% were doing voluntary or unpaid work. For part-time leavers, slightly higher proportions were in full-time paid work, 78.4% or self-employed, 5.5% but the proportion in part-time paid work was slightly lower, 14.7%. Men were more likely than women to be self-employed, but the major gender difference was among leavers from part-time programmes, where women were nearly three times more likely at 19.5% to be in part-time employment than men at 7.1%.
Of full-time leavers who were in full-time paid work, 1.3% were working in other EU countries, and 1.8% outside the EU. For part-time leavers the figures were 0.5% and 0.9% respectively. Of all full-time doctorate leavers who were in full-time paid work, 4.5% were working in other EU countries, and 8.4% outside the EU.
Region of Employment
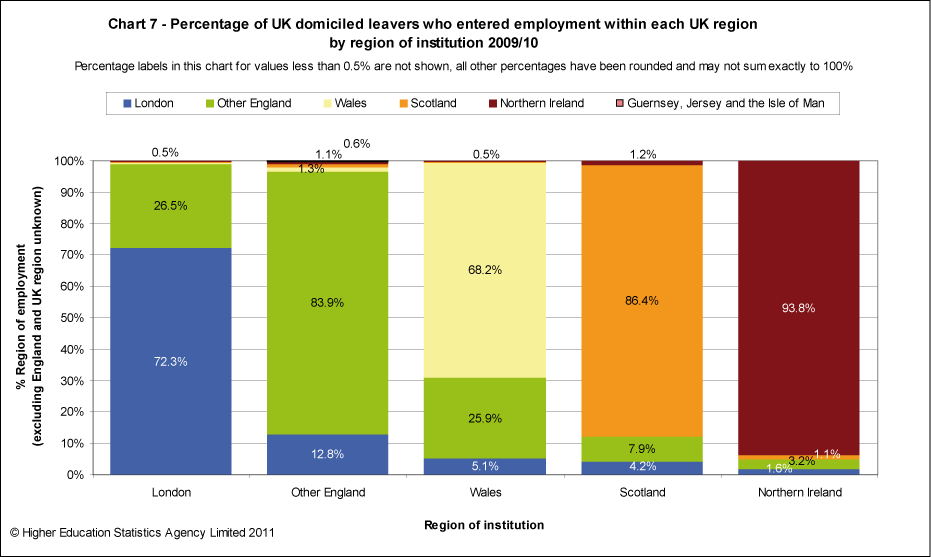
Table G provides a breakdown of region of employment for leavers who entered employment by region of domicile and region of institution.
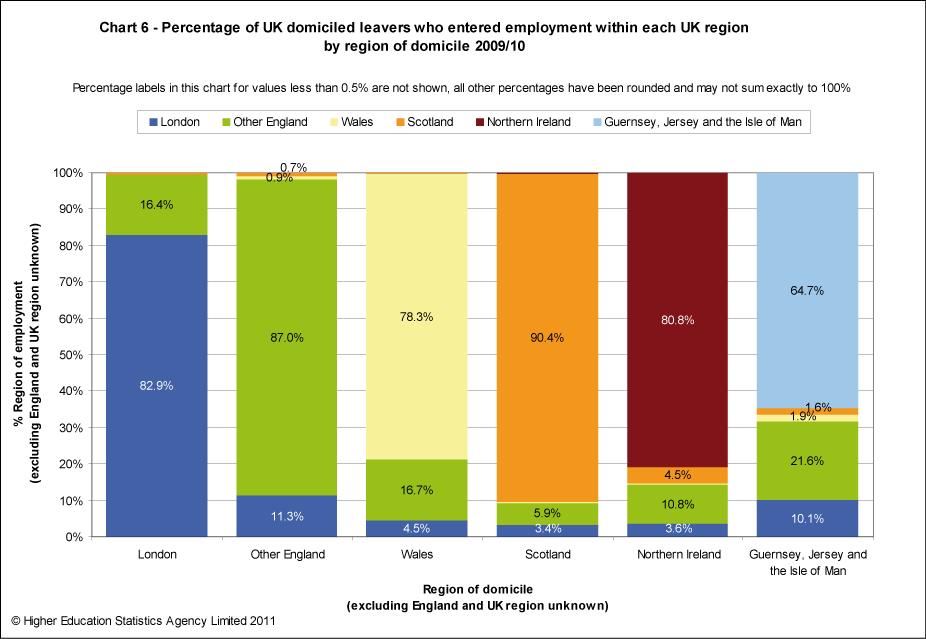
A large proportion of London domicile leavers and leavers who studied at institutions in London took up employment in London, at 82.9% and 72.3% respectively. Scotland domicile leavers and leavers who studied in Scotland were the most likely to enter employment in Scotland at 90.4% and 86.4% respectively.
Charts 6 and 7 below show the region of employment patterns for leavers who entered employment by region of domicile and region of institution respectively (sourced from Table G). Percentage labels for values less than 0.5% have not been shown on the charts, but can be found in Table G.
Type of study
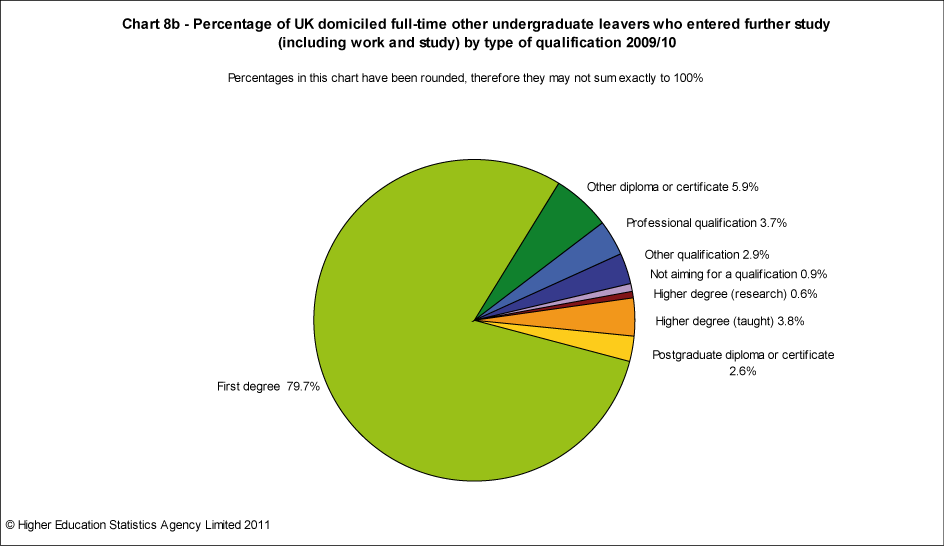
Table H shows the subsequent study patterns of those leavers who continued to study, broken down by mode and level of qualification obtained and by gender. It includes those who were also working.
Of the total number of UK domicile full-time leavers 22.9% proceeded to further study (Table C). Of those, 10.8% moved on to study for a higher degree by research and a further 29.8% studied for a higher degree by taught course.
Of the total number of full-time other undergraduate leavers, 39.4% proceeded to further study. Of those, 79.7% moved on to first degree studies.
Chart 8a below illustrates the type of further study of full-time first degree leavers who entered further study (sourced from (Table H).
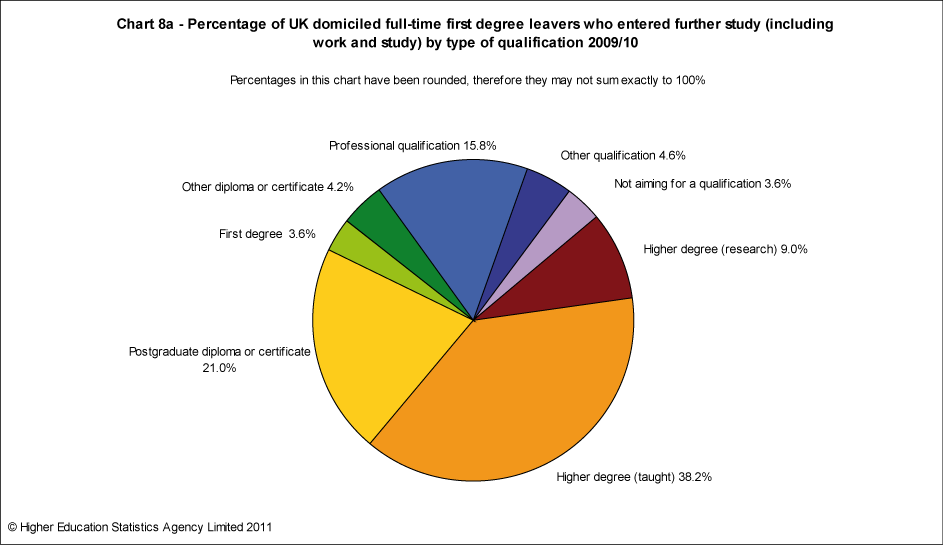
Chart 8b below illustrates the type of further study of full-time other undergraduate leavers who entered further study (sourced from (Table H).
Newly qualified teachers
Table I shows the breakdown by mode of study, level of qualification, gender and age group for those achieving Qualified Teacher Status (or the equivalent in Scotland), and shows the sector (maintained/non-maintained, also known as state/independent) and the level of the school or college in which the respondent was teaching.
Almost all postgraduates achieving QTS did so by taking a Postgraduate Certificate in Education, 99.9%, and the majority of Other Undergraduates achieving QTS did so by taking a Professional Graduate Certificate in Education, 95.9%. The Postgraduate Certificate in Education was by far the most common route to QTS for both full-time and part-time students.
Across the UK, 86.2% of those respondents achieving QTS were employed as teachers, and a further 7.5% were seeking a teaching post. Of those known to be in a teaching post, 91.1% were teaching solely in the maintained (state) sector. The percentage teaching only at the primary level was 48.1%, at the secondary level or both levels was 47.2% and 2.3% respectively, and at a college or other educational establishment 2.5%.
Employer sponsorship for part-time study
Table J shows patterns of employer sponsorship for leavers from part-time programmes who were employed during or just before their studies.
Payment of tuition fees was the most common form of support. Grants to cover living expenses in addition to tuition fees were uncommon.
Salary levels
Table K shows the mean, median, upper and lower quartiles of salaries reported (to the nearest £500) by leavers from first degree programmes who entered or continued in full-time UK employment.
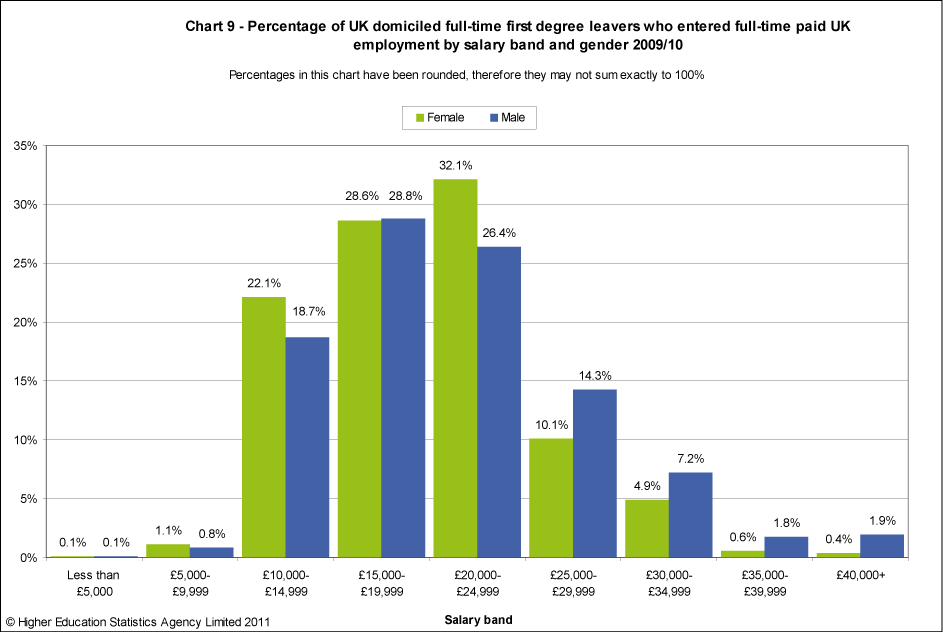
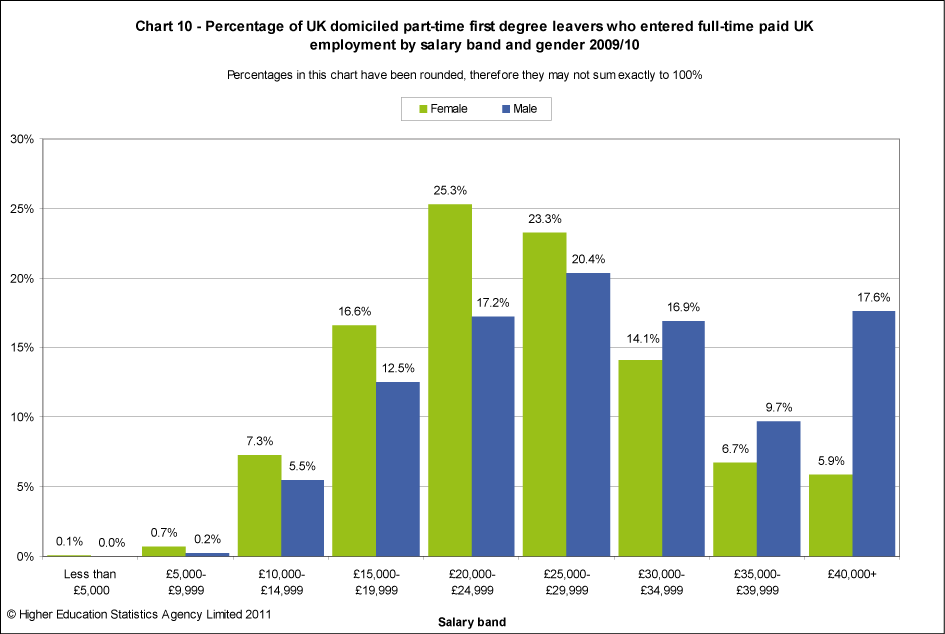
The median salary for female leavers from full-time programmes was slightly lower, £19,000, than that for males at £20,000. The mean salary for full-time male leavers was £20,500 compared with £19,000, for full-time female leavers, due to men generally being in the higher paid jobs (see Chart 9 below). For part-time leavers, males had a substantially higher median salary, £28,000 against £25,000, and a much larger proportion in the highest category (£40,000 and above): 17.6% of part-time male leavers earned over £40,000 compared to 5.9% of part-time female leavers.
Charts 9 and 10 below display the salary distribution by £5,000 bands separately for leavers from full-time and part-time programmes who obtained first degree qualifications in full-time paid UK employment, subdivided by gender (sourced from (Table K).
