Introduction - Finances 2012/13
Finance data
This commentary draws attention to some of the headline figures and key points that emerge from the main tables and is displayed graphically where appropriate. It should be noted that where comparisons are made between the latest financial year and a previous year, the figures for the previous year are as re-stated in the most recent financial statements available; any exceptions are noted explicitly. They are not therefore necessarily reconcilable with figures for that year published in previous HESA publications. However, it is understood that all such figures can be reconciled to the published accounts of the institutions. It should be noted in all tables, The Open University is counted as an institution based in England, although its funding now includes contributions from other administrations. All institution tables include finance data for The University of Buckingham, which is a non-publicly-funded institution in England and operates on a different financial year from the 1 August to 31 July financial year standard for the rest of the sector.
Balance sheet
A comparison of the HE sector’s balance sheet at 31 July 2013 with that at 31 July 2012 (both as stated in the 2012/13 accounts in Table A) shows a £598 million increase in amounts falling due within one year while amounts due after more than one year have increased by £752 million. There was an increase of £260 million in debtors.
The value of tangible assets has increased by £1.7 billion (5.3%), endowment assets have increased by £611 million (15.4%) and investments increased by £633 million (27.4%).
Income and expenditure
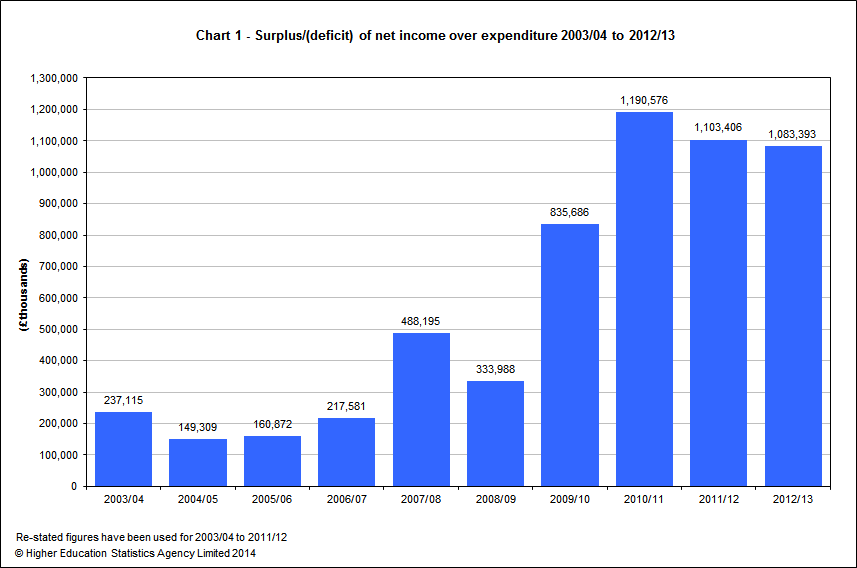
Table B provides a summary of income and expenditure for the last two academic years. The total income of the HE sector was £29.1 billion during the financial year to 31 July 2013; this compares with £27.9 billion for the previous year, giving an increase of 4.5%. The surplus of income over expenditure decreased from £1,103 million in 2011/12 to £1,083 million in 2012/13, a decrease of 1.8%. When surplus is shown as a percentage of net income this has decreased from 4.0% in 2011/12 to 3.7% in 2012/13.
To provide the context for these figures, Chart 1 (sourced from Table B) shows the HE sector’s surplus/deficit (re-stated for 2003/04 to 2011/12) for each of the last 10 years. These are cash figures to which no deflator has been applied. Data were returned to HESA for the financial year 1993/94 onwards; figures for these financial years are set out in earlier editions of this publication.
The number of institutions reporting a surplus was 142 out of 161 in 2012/13 compared with 144 out of 161 in 2011/12 (sourced from Table 1 [xlsx 31 KB]). Deficits in the financial year 2012/13 were reported by 19 institutions and by 17 institutions in 2011/12.
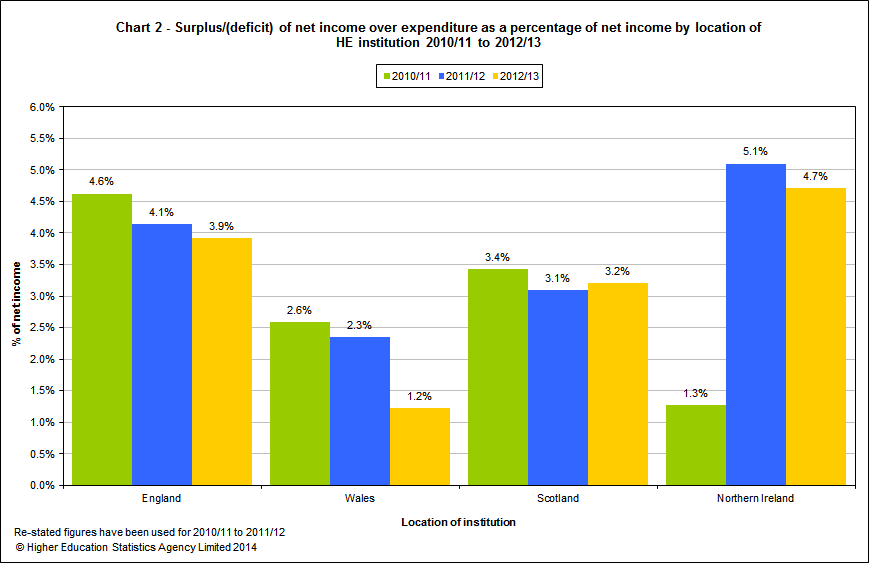
Table C aggregates income and expenditure figures for institutions funded by each of the four UK countries’ funding councils. All four countries reported a surplus for the year 2012/13. However, when considered relative to net income, the size of surplus had reduced from 2011/12 in all countries except Scotland. Chart 2 below illustrates change in surplus as a percentage of net income over the last three years (sourced from Table C).
Income
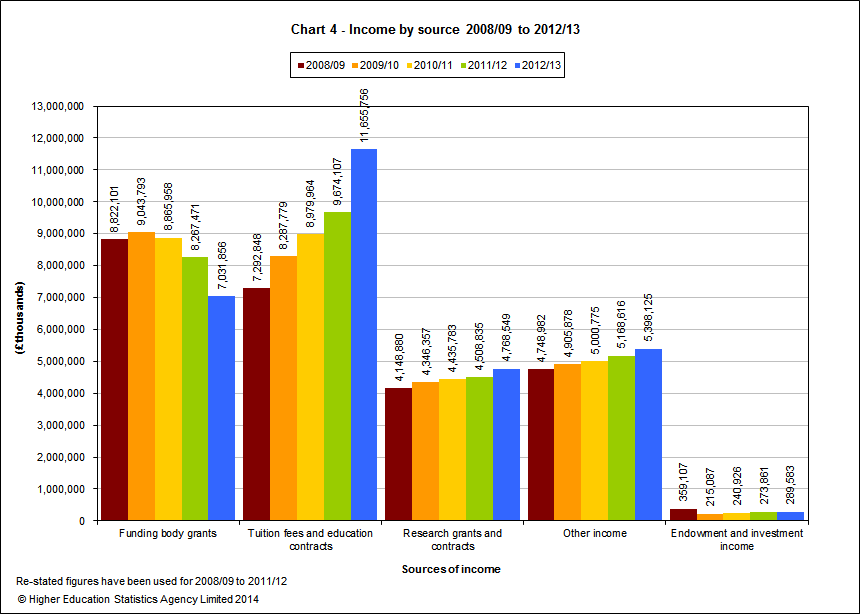
Charts 3 and 4 below summarise institutions’ sources of income contributed by each source and the growth or otherwise over time (sourced from Table D).
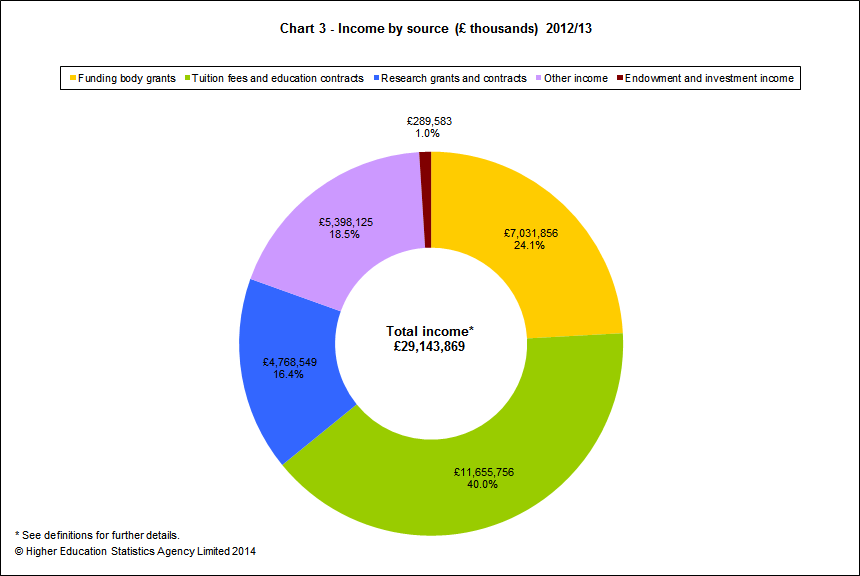
Funding body grants represent 24.1% of total income. Tuition fees and education contracts represent 40.0% of total income. Total income increased by 4.5% from 2011/12 to 2012/13 and there was an increase across all sources except for funding body grants which decreased by 14.9%. The largest increase was observed in tuition fees and education contracts (20.5%) which was expected due to the change in the funding regime.
The breakdown in Table D of income by source also shows the component of income arising from joint ventures, and the net income after removing this component.
Funding body grants
Institutional funds for academic and other purposes are allocated primarily by the Higher Education Funding Council for England (HEFCE), the Higher Education Funding Council for Wales (HEFCW), the Scottish Funding Council (SFC) and by the Department for Employment and Learning for Northern Ireland (DEL(NI)) acting as a funding agency for the four Northern Ireland higher education institutions. Some funds are also provided in England by the Department of Health (DH) and the National College for Teaching and Leadership (NCTL). Table E provides a breakdown of funding body grants.
Tuition fees and education contracts
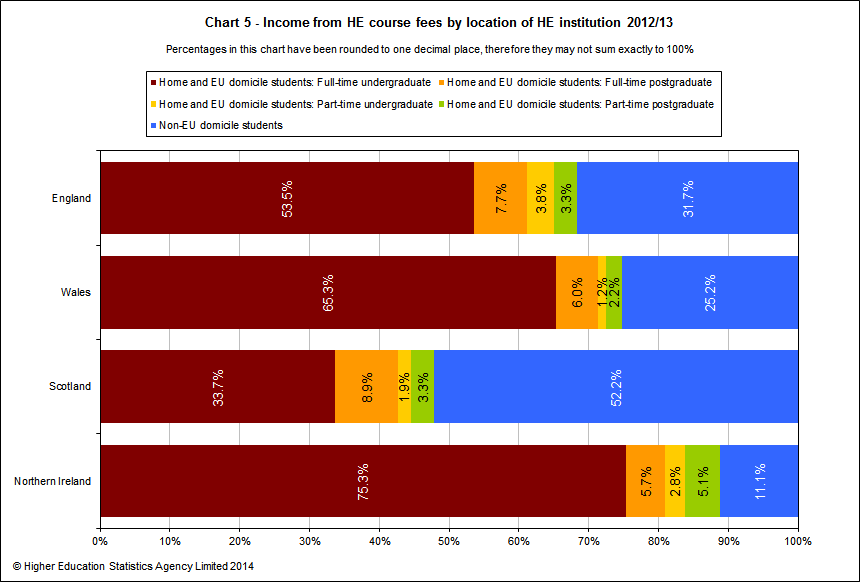
Table F provides a breakdown of income from tuition fees and education contracts by location of institution. The total income for tuition fees and education contracts increased by 20.5% this year to £11.7 billion from £9.7 billion in 2011/12, due to the change in the funding regime. Income from full-time Home and EU domiciled undergraduate students provided 49.6% of the income in this category, and that from all non-EU domicile students provided 30.3%. The total income from HE course fees varied by location as shown in Table F, as did the proportions by the type of fees as indicated in Chart 5 (sourced from Table F).
Research grants and contracts
Research grants and contracts increased by 5.8% in 2012/13 to £4.8 billion from £4.5 billion in 2011/12. The Research Councils continue to be the largest providers, representing 32.3% of total research grants and contracts income. Table G provides a breakdown of income from research grants and contracts.
Other income
Income in this category increased by 4.4% this year to £5.4 billion from £5.2 billion in 2011/12. Nearly one third (31.7%) of other income came from residence and catering operations (including conferences). Table H provides a breakdown of all other income.
Expenditure
Overall expenditure rose by 4.7% (£1.3 billion) to £27.9 billion as shown in Table I. The largest categories of expenditure; staff costs and other operating expenses increased by 4.1% and 5.6% respectively. Chart 6 below shows the distribution of expenditure (sourced from Table I).
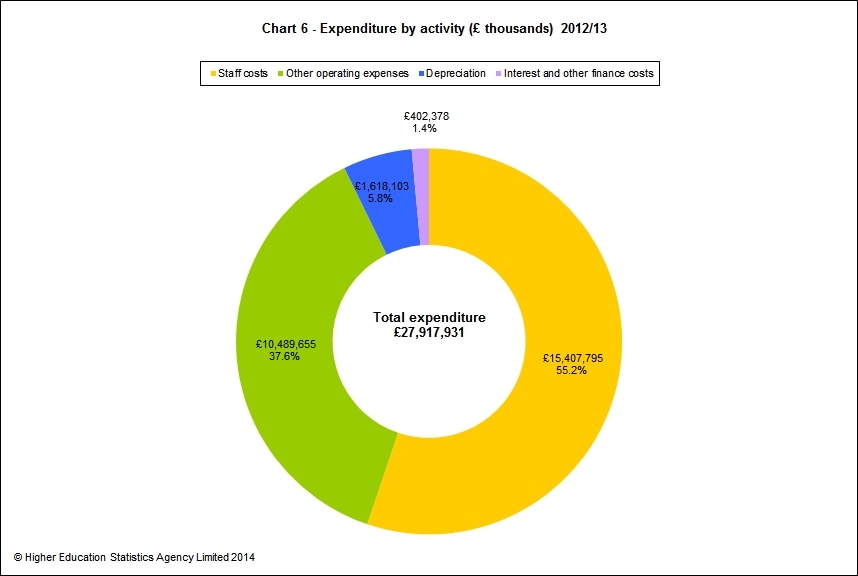
Academic departments accounted for 39.0% of total expenditure. Expenditure in all activity groups has increased from the previous year. Table J displays the distribution of expenditure across activity groups. Chart 7 below shows the growth of expenditure over time (sourced from Table J). Please note that the figures in Chart 7 are not restated figures as this data is not collected.
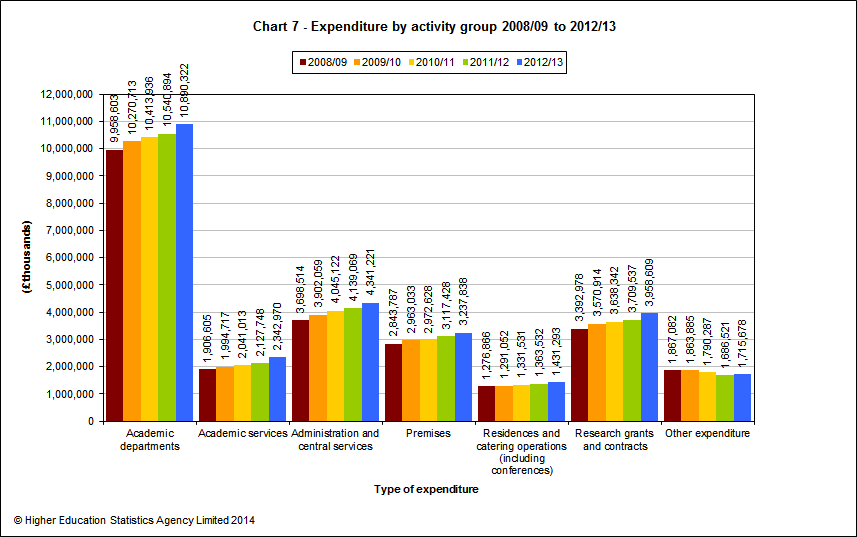
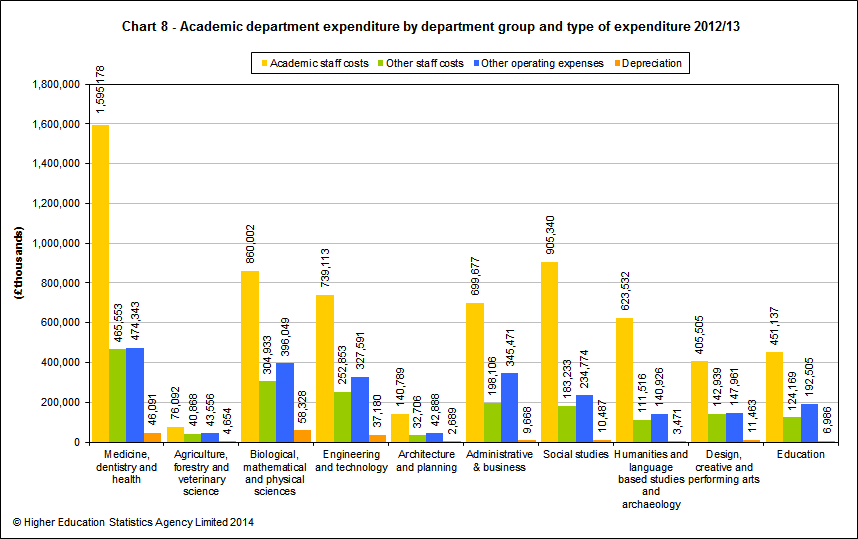
The total expenditure in academic departments in 2012/13 was £10.9 billion with academic staff costs accounting for £6.5 billion. Table K shows expenditure by academic department group. Total expenditure of medicine, dentistry and health cost centres constituted 23.7% and biological, mathematical and physical sciences 14.9%. In all 10 departments the largest expense was academic staff costs, illustrated in Chart 8 below (sourced from Table K).
© Higher Education Statistics Agency Limited 2014
