Introduction - Higher Education Statistics 2010/11
In 2010/11, there were 164 publicly-funded UK higher education institutions (HEIs). HESA holds data on these 164 institutions plus the privately funded institution, The University of Buckingham. The HESA student record does not include any data for The University of Wales (central functions) which has staff but no students. This publication brings together student, staff and finance data collected by HESA at these UK institutions; application and acceptances data from UCAS; student loan information from Student Loans Company (SLC); participation rates from Organisation for Economic Co-operation and Development (OECD) plus contextual population statistics from Office for National Statistics (ONS).
Applications and acceptances
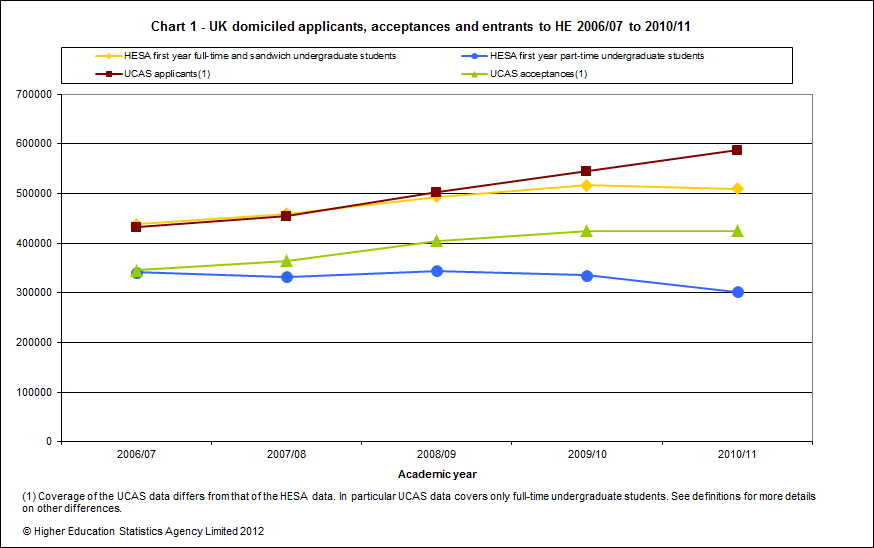
The majority of UK domiciled full-time undergraduate students apply to UK HEIs through the UCAS application system. In 2010/11, there were 586,820 applicants to full-time higher education via UCAS (544,285 in 2009/10), of which 424,635 (nearly three quarters) were accepted. Table A and Chart 1 illustrate the UCAS full-time undergraduate applicants and acceptances alongside the numbers of full-time undergraduate entrants studying at UK HEIs. The number of part-time undergraduate entrants is shown for comparison purposes. It is important to be aware that the coverage of UCAS data differs from that of the HESA data, so the graph may be used to analyse the trend, rather than for direct number comparisons.
Please note that the UCAS figures published in Table A of the Higher Education for the UK 2009/10 volume also included non-UK domiciled students and therefore differ from the figures published in Table A for 2010/11.
Student population
There were 2.5 million students studying for a HE qualification or for HE credit at UK HEIs in 2010/11. Over the past five years, the number of HE students studying at UK HEIs has been gradually increasing, an overall increase of 8.5%. Since 2007/08, the increase has been more apparent, although less so in the last year with only a 0.3% rise since 2009/10.
An additional 60,805 students were known to be studying at further education (FE) level at UK HEIs, although this is likely to be an undercount as institutions are no longer required to return their FE data to HESA. Data on FE students at HEIs have therefore been excluded from the remainder of the introduction.
Table B provides more detail on students by level of study with comparisons between full-time and part-time, where full-time includes those following a full-time or sandwich programme. It can be seen that a much higher percentage of full-time students were studying for a first degree than part-time students who were more likely to be studying for another type of undergraduate qualification. For context, Table B also includes data on HE level students studying at FE institutions in the UK.
Equivalent information on students studying at further education level can be found in the current Statistical First Release from The Data Service and the Department for Business, Innovation and Skills.
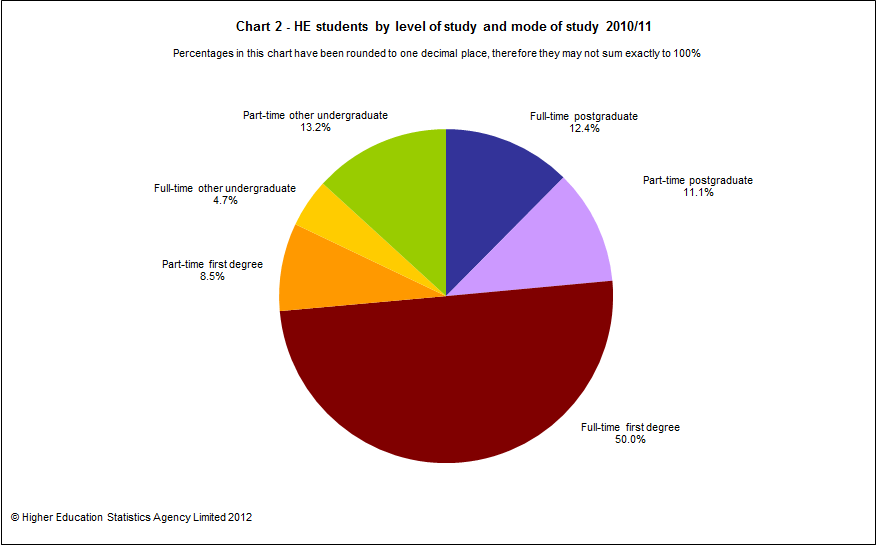
Half (50.0%) of the 2,501,295 HE students were following a full-time first degree programme. The following pie chart illustrates the breakdown of HE students by level and mode of study.
Gender and domicile
A higher percentage of female students (56.4%) than male students (43.6%) were studying at UK HEIs. The gender imbalance was more noticeable among students studying part-time of which 61.1% were female. For non-EU domicile students, a higher percentage were male (54.2%) than female (45.8%).
Table C illustrates the differences in student numbers by domicile, gender, level and mode of study.
Subject of study
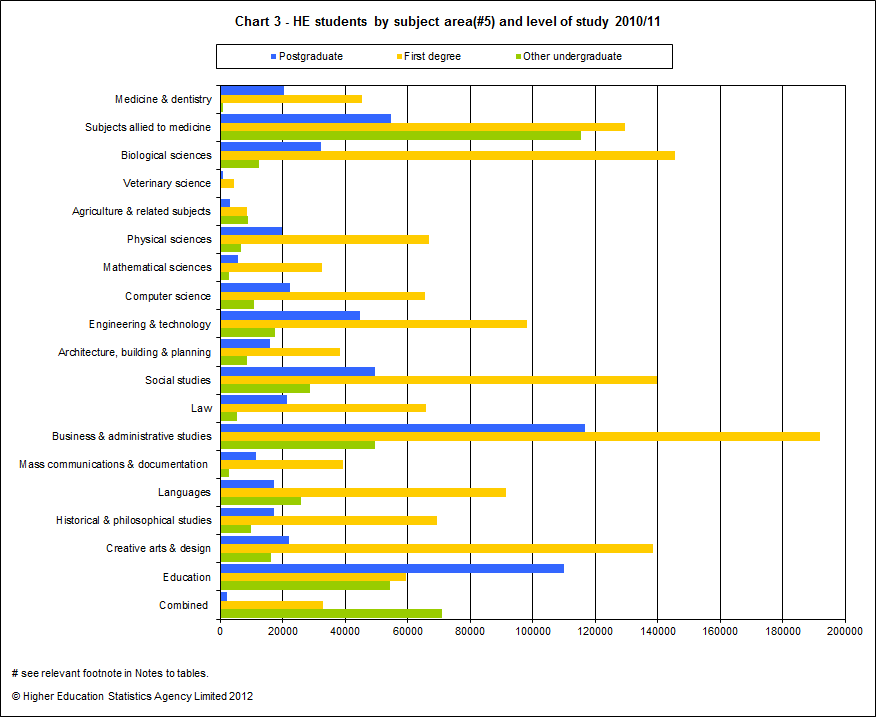
Table D shows the distribution of student numbers by subject varied by level of study.
High percentages of other undergraduate students studied subjects allied to medicine (25.8%) and in combined subject areas (15.8%). The high percentage in subjects allied to medicine can be explained because a qualification below first degree level is the norm in many health-related professions, especially nursing. Many Open University students may not initially have to declare their award intention and are reported as studying for institutional credit in the combined subject area. For both postgraduate and first degree students, the highest percentages were studying Business & administrative studies.
Chart 3 below provides the numbers of HE students by subject area and level of study.
Qualifications obtained
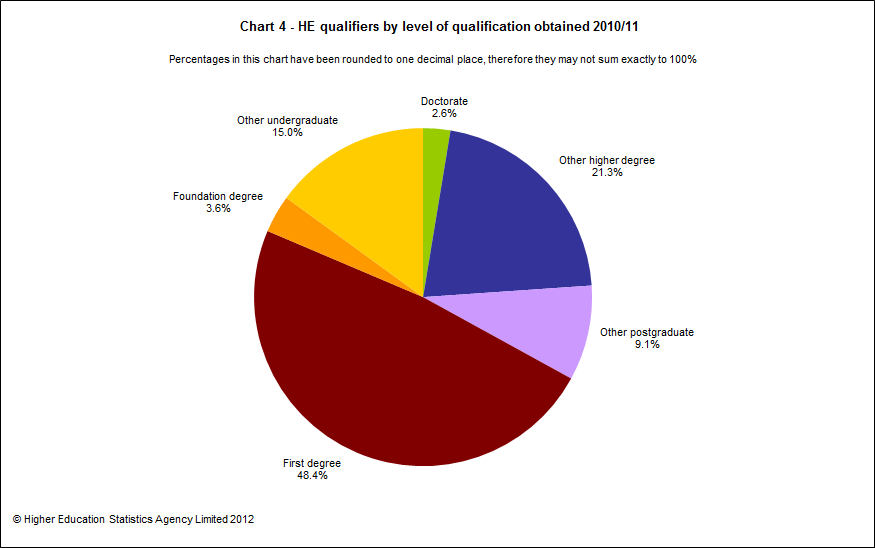
In 2010/11 a total of 762,540 qualifications were awarded at HE level to students at UK HEIs. Of these, 33.1% were at postgraduate level, 48.4% were first degree qualifications and 18.5% were other undergraduate qualifications. Chart 4 below illustrates this.
Over the period of 2006/07 to 2010/11 the total number of first degree qualifiers increased by 15.6%. This largely reflects the increasing numbers of entrants in earlier years feeding through the system. Table E provides a more detailed breakdown of qualifications obtained for the last five years.
Information on rates of completion for full-time first degrees are published separately in the ‘Projected Outcomes’ tables of the HESA Performance Indicators. These completion rates require two consecutive years’ data to produce so there is a time lag of one year between the latest data available (2010/11), and the latest completion rates (2009/10). The statistics show that the projected completion rate for full time first degrees increased slightly from 77.6% of 2004/05 entrants to 78.4% of 2009/10 entrants.
Destinations of leavers
Approximately six months after leaving their HEI, the majority of UK and other EU qualifiers were surveyed with regards to their employment and further study activity. This Destinations of Leavers from Higher Education (DLHE) survey includes those qualifiers who completed their programmes during the academic year 2010/11. The reference date for those obtaining the qualification between 1 August 2010 and 31 December 2010 was 18 April 2011, and the reference date for those obtaining the qualification between 1 January 2011 and 31 July 2011 was 9 January 2012.
In 2010/11, there were 396,650 qualifiers who provided information about their destinations from a possible 526,225 within the eligible DLHE population. This gives a percentage with known destination of 75.4%, compared with 75.7% for 2009/10. A further 18,000 qualifiers replied to the survey but explicitly declined to give information. Including the explicit refusals, the overall response rate was 78.8%. Table F provides a breakdown of leavers’ activity by level of qualification obtained.
Table G illustrates the percentage of leavers by activity for the last five years. The percentage of leavers in employment fell for two consecutive years from 2006/07 to 2008/09, roughly coinciding with the wider economic downturn. The percentage of leavers assumed to be unemployed rose over the same period. In 2009/10 there was a slight rise in the percentage of leavers entering employment and the percentage was similar in 2010/11. The percentage of leavers entering voluntary or other unpaid work gradually rose over the whole five year period.
The following pie charts show comparatively the percentage of leavers by activity for postgraduate, first degree and undergraduate leavers. Around two thirds (64.9%) of postgraduate leavers entered full-time paid work only. The percentage was closer to a half (48.3% and 42.3%) for first degree and other undergraduates respectively. First degree leavers were more likely to be unemployed (8.9%) than postgraduates (6.0%) and other undergraduates (4.5%). Over a third of other undergraduates were engaged in study, either through a combination of work and further study (19.5%) or further study only (20.4%).
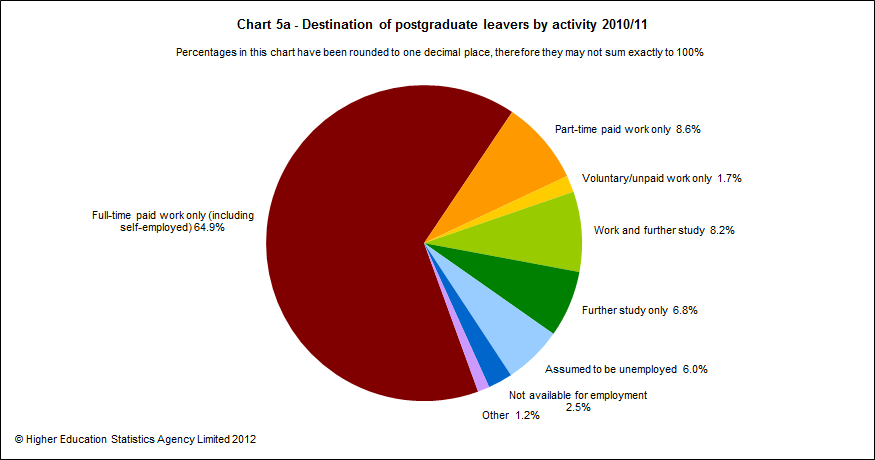
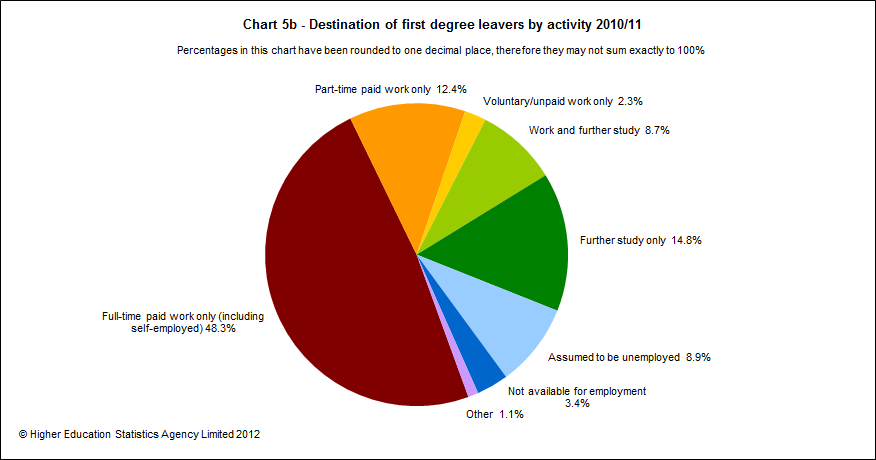
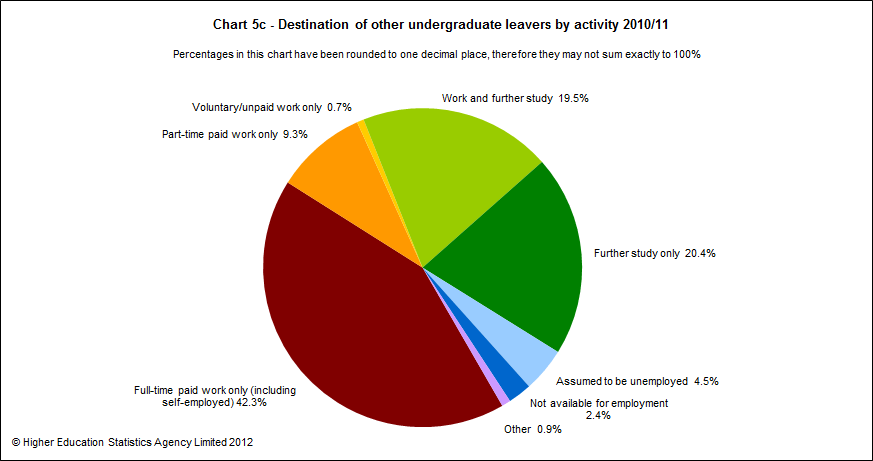
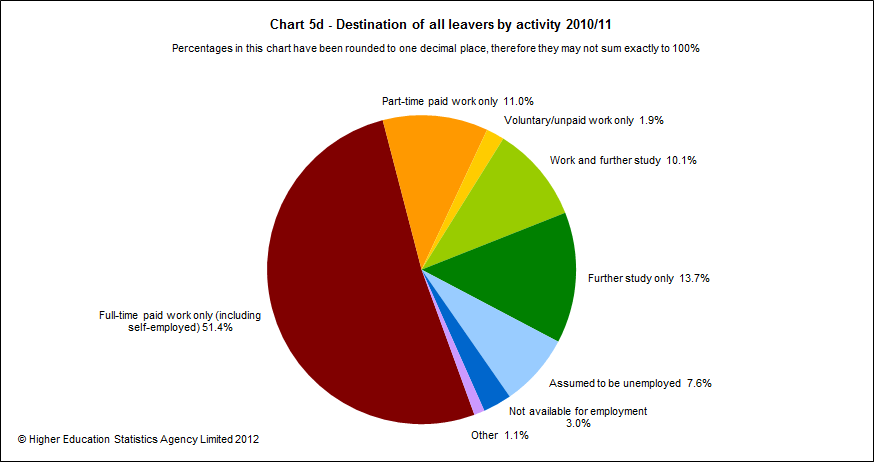
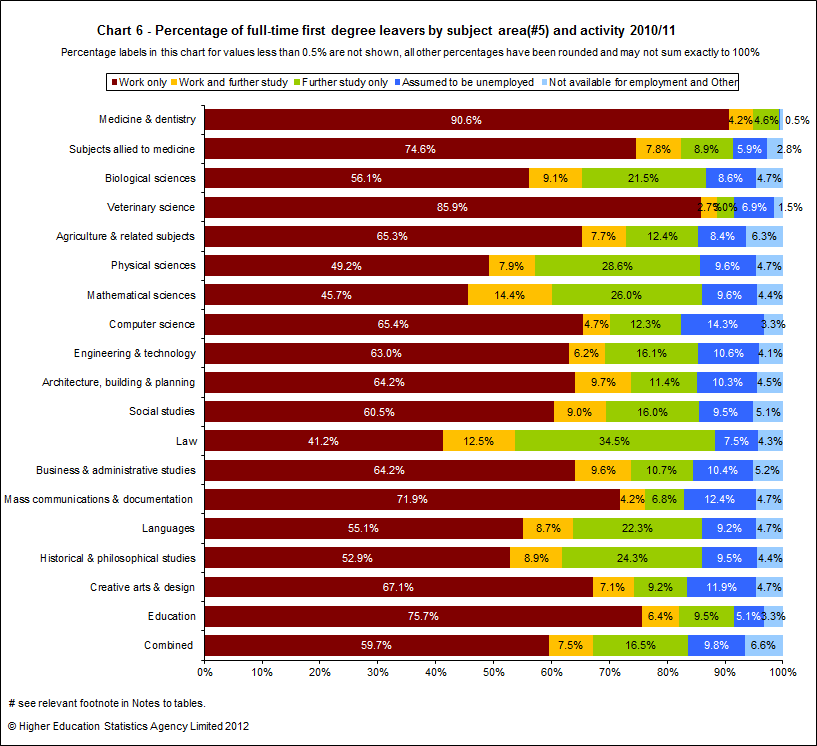
Table H and Chart 6 show how the distribution of leavers by activity varies for each subject area for full-time first degree leavers. Unemployment rates for full-time first degree leavers whose destinations were known varied between subjects, ranging from those which have traditionally low rates of unemployment, such as Medicine & dentistry (0.1%), Education (5.1%) and Subjects allied to medicine (5.9%) to those with higher rates of unemployment, such as Computer science (14.3%), Mass communications & documentation (12.4%) and for Creative arts & design (11.9%).
Staff
The HESA Staff Record covers all academic and non-academic staff who have a contract of employment with a UK higher education institution (HEI), or for whom the HEI is liable to pay Class 1 National Insurance contributions.
On 1 December 2010, there were in total, but excluding those staff on atypical1 contracts, 381,790 staff, of whom 181,185 were academic and 200,605 were non-academic. In addition, there were 183,490 staff on atypical contracts.
The remainder of the staff figures exclude atypical staff. Table I provides a breakdown by activity and mode of employment for the last five years.
Overall student and staff numbers have both increased steadily over the last five years, although there has been a decrease of 1.5% in staff numbers in the last year. Academic staff numbers decreased by 0.2% in the last year and non-academic staff numbers decreased by 2.5%.
Chart 7 illustrates the increasing trend of both students and academic staff over a five year period. It should be noted that the axis scale for staff differs from that of students in order to express both trends on the same chart.
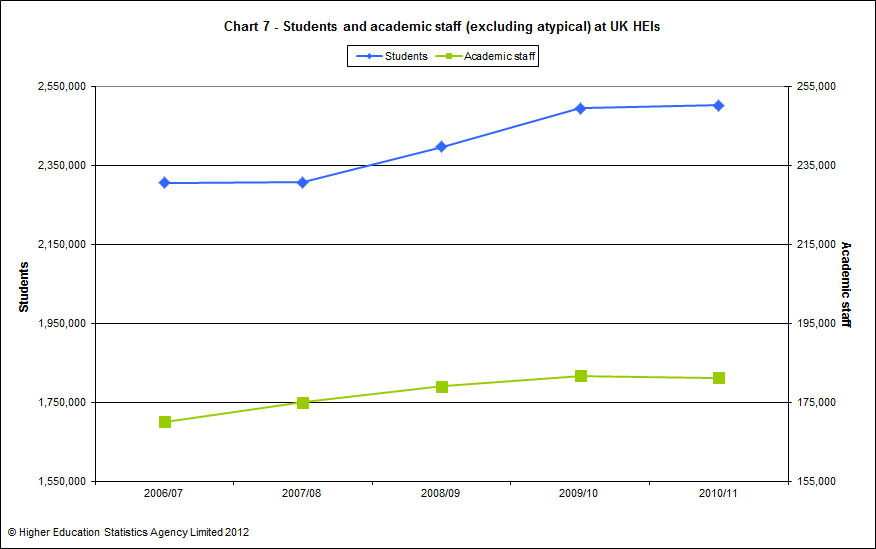
Table J below shows academic staff by academic employment function, gender, mode of employment and terms of employment for 2010/11. Overall, there was a higher percentage of male academic staff than female. However, higher percentages of part-time academic staff were female. This was true for both open-ended/permanent and fixed-term contracts.
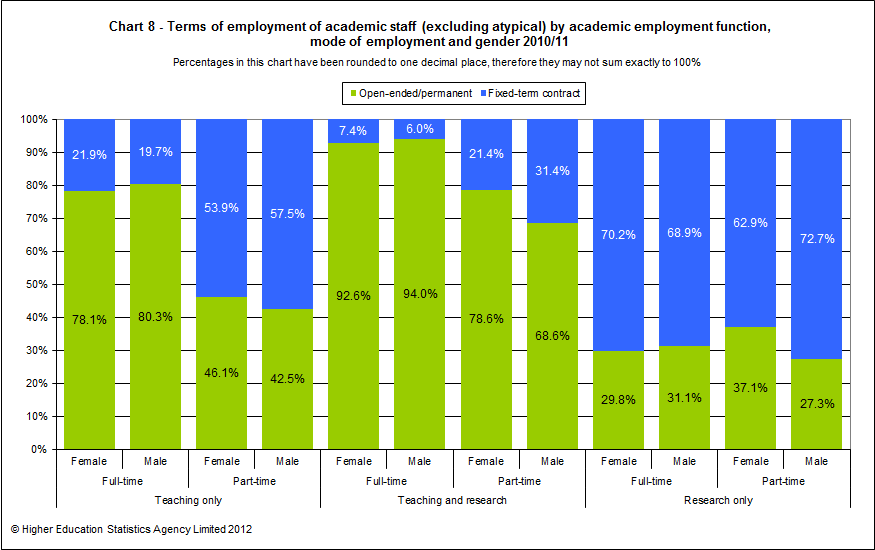
Chart 8 below illustrates the percentages of open-ended/permanent and fixed-term contract academic staff by academic employment function, mode of employment and gender. It can be seen that staff engaged in both teaching and research were much more likely to be employed on open-ended/permanent contracts than those undertaking only research.
Finance
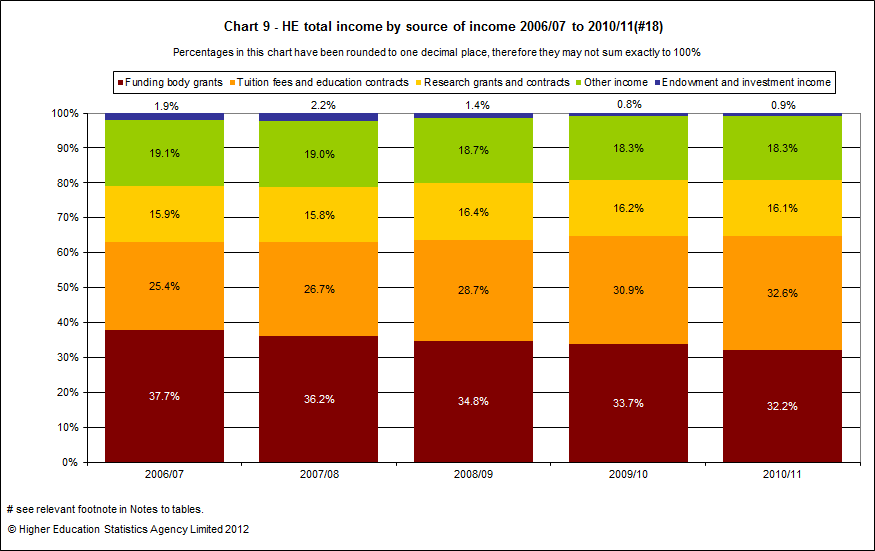
The finance data collected by HESA from UK HEIs covers income and expenditure. Over the last five years, income and expenditure have gradually increased at a similar rate, tapering off during the last couple of years. Income has increased at a slightly higher rate (29.2% increase since 2006/07) than expenditure (24.8% increase since 2006/07) with a HE sector surplus across all years. Over the last five years, the percentage increase in income and expenditure (in cash terms) has been over three times that of student and over five times that of staff numbers over the same period.
Table K provides a time series of the various income and expenditure streams for the last five years.
Chart 9 illustrates the percentage change of the various sources of income over the same period. In particular, the percentage of income from tuition fees and education contracts has increased from 25.4% in 2006/07 to 32.6% in 2010/11.
Student Loans
Table L provides information on income from course fees of full-time UK and EU domicile undergraduates (source: HESA) alongside tuition fee loans and maintenance loans paid to HE students (source: SLC). Although difference in coverage means that data from these two sources are not directly comparable, the figures allow some trend comparisons to be made. Although income of HEIs and loans paid to HE students have all increased over time, the tuition fee loans paid to HE students have increased at a faster rate.
1 See Definitions, Section F for explanation of atypical staff.
© Higher Education Statistics Agency Limited 2012
