Introduction - Students 2000/01
This publication is one of four reference volumes from the Higher Education Statistics Agency (HESA), which present statistics about the publicly-funded higher education institutions (HEIs) of the United Kingdom (UK).
This volume draws on HESA’s collection of data about students in HEIs in the academic year ending 31 July 2001, and it covers data supplied by 166 institutions.
The other reference volumes published by HESA are:
Resources of Higher Education Institutions - which draws on HESA’s collection of data about finance and staff of HEIs. Tabulations are included which record and analyse the income and expenditure of universities and colleges (with data shown at institution level) and the characteristics of academic staff.
First Destinations of Students Leaving Higher Education Institutions - which includes statistics about the first destinations of graduates including employment rates, participation in further study and training, etc. A summary tabulation at institution level is included.
Higher Education Statistics for the United Kingdom - which is published in conjunction with the Government Statistical Service and which presents an overview of higher education (HE) from a statistical perspective, including statistics about applications, participation, institutional finance, staffing, student awards and loans.
The Agency also makes available a number of other related products, including an electronic source ‘HE Planning Plus’, available on CD-ROM, which contains a significant amount of data about student characteristics and programmes of study. A series of Research Datapacks provides in depth coverage of items of special interest. More information about HESA’s other publications is set out at the end of this volume.
While HESA publishes extensively from the data it collects, it is recognised that specific requirements by some interested parties may not be addressed. Therefore, the Agency undertakes to provide a service to answer enquiries about the data collected, for which a charge will normally be levied.
Due to the provisions of the Data Protection Act 1998 and the Human Rights Act 1998, HESA now implements a strategy in published tabulations designed to prevent the disclosure of personal information about any individual. Such tabulations are derived from the HESA non-statutory populations and may differ slightly from those published by related statutory bodies. This strategy involves rounding all numbers to the nearest 5. A summary of this strategy is as follows:
- 0, 1, 2 are rounded to 0
- All other numbers are rounded to the nearest 5.
So for example 3 is represented as 5, 22 is represented as 20, 3286 is represented as 3285 while 0, 20, 55, 3510 remain unchanged.
Total figures are also subject to this rounding methodology; the consequence of which is that the sum of numbers in each row or column will rarely match the total shown precisely.
Average values, proportions and FTE values prepared by HESA are not subject to the above strategy, and can be calculated on precise raw numbers. However, percentages calculated on populations which contain less than 50 individuals are uppressed and represented as ‘..’ as are averages based on populations of 7 or less.
Students in UK Higher Education Institutions 2000/01
In 2001 HESA collected student data from all publicly-funded UK HEIs for the academic year 2000/01 (i.e. the period 1 August 2000 to 31 July 2001). This information was collected uniformly from all of the universities and HE colleges in the UK.
This commentary summarises and analyses the data contained within the main tables and presents summary statistics and key points.
Summary of Key Points
- 1,990,625 students were recorded as following HE programmes in the academic year 2000/01.
- A further 103,485 students were following courses at further education (FE) level.
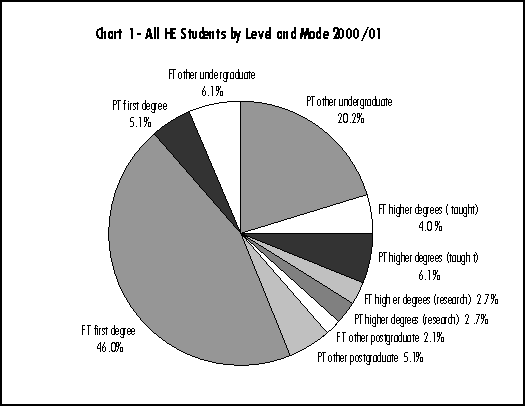
- Of the 1,990,625 HE students recorded, 60.8% were following full-time or sandwich programmes and77.5% were studying at undergraduate level.
- Full-time first degree students made up 46.0% of the recorded HE student population.
- Women made up 55.8% of the student population and 57.7% of UK domiciled undergraduates.
- Students from countries other than the UK numbered 230,870 and represented 11.6% of the total student body.
- Overseas students made up 41.1% of all full-time postgraduates.
- Women constituted 83.3% of students in subjects allied to medicine, and were also very strongly represented in education (72.6%), languages (68.4%), veterinary science (69.6%), librarianship & information science (62.7%), biological sciences (61.6%) and social, economic & political studies (61.8%).
- Men constituted 84.9% of engineering & technology students, 73.9% of computer science students, 71.7% of architecture, building & planning students and were strongly represented in physical (61.7%) and mathematical sciences (62.5%).
- Students from outside the UK were well-represented in engineering & technology, law, business & administrative studies, architecture, building & planning, languages, agriculture & related subjects and social, economic & political studies.
- Ethnic minorities constituted 13.7% of all first year UK domiciled students of known ethnicity.
- 56.2% of students who obtained a classified first degree were awarded first or upper second class honours, with 9.5% being awarded a first.
Student Population
In 2000/01 there were more than 1.9 million students who were studying for qualifications or credit in the 166 HEIs of the UK.
Of these, 103,490 (4.9%) were studying at FE level; these students are included for completeness in Table A below and in the first two of the main tables in this volume, but are not routinely included within the more specific analyses.
Of the 1,990,625 HE students recorded, 60.8% were studying full-time or sandwich programmes and77.5% were studying at undergraduate level.
Of the 448,695 postgraduate students, 107,079 (23.9%) were enrolled on higher research degrees, (44.6%) on higher taught degrees and the remaining 31.5% on other postgraduate programmes.
Of the 1,541,930 undergraduates, 66.0% of students were studying for a first degree, with the remaining 34.0% following other undergraduate programmes (e.g. DipHE, HND, and other undergraduate diplomas and certificates).

Domicile and Gender
Table B provides a summary of students by domicile and gender.
Students from countries other than the UK numbered 230,870 and represented 11.6% of the total student body.
Overall, women made up 55.8% of the student population. They were in a majority among both full-time and part-time students, although they were slightly more predominant among part-time students. The proportion of female students did however vary according to domicile, with 46.9% of overseas students being female, compared with 56.9% of UK domiciled students.
Some 48.2% of all overseas students were following postgraduate level programmes. Table C provides a more detailed breakdown:
Overseas students made up approximately quarter (24.8%) of the postgraduate student population in the UK and 41.1% of all full-time postgraduates. 65.3% of all postgraduate overseas students came from outside the European Union (EU). Non-UK students were particularly prominent on higher degree programmes, making up 42.9% of full-time research higher degree students and 54.2% of students on full-time taught higher degree courses.
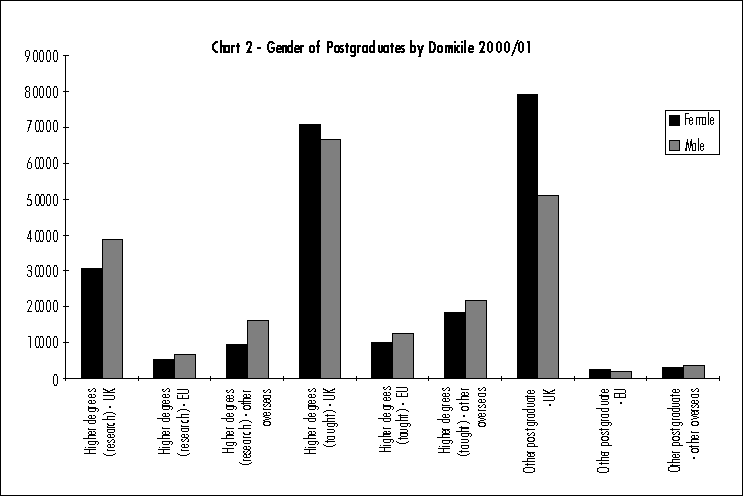
Overall, 51.1% of all postgraduates and 53.6% of those domiciled in the UK were female, but there were considerable differences between the different types of programme and different areas of domicile. Female students constituted the majority of non-degree level postgraduates (programmes which are dominated by Postgraduate Certificates in Education (PGCEs)), but made up just under half of the students on taught higher degree courses, and only 42.3% of all research higher degree students. Whereas 44.1% of higher degree research students from the UK and the EU were women, only 36.6% of research students from other overseas countries were female.

Chart 2 illustrates these differences.
A different pattern may be observed at undergraduate level, as is shown in Table D:
Overseas students made up 7.8% of the total undergraduate population, with students from the EU being less likely to undertake non-degree level study than students from other overseas countries.
Overall, the gender balance shows women in a majority: 57.7% of UK domiciled undergraduates were women, compared with 50.5.% of other EU students and 49.5% of students from other countries. Women were particularly prominent among students of non-degree courses, on which they represented 63.4% of the total: subject considerations are influential here - as shown in the following section.
Subject of Study
Table E shows the percentage of students at different levels who were following programmes of study in each subject area.
A significant proportion of students were following other undergraduate and part-time first degree programmes in subjects allied to medicine (which include nursing). Other subject areas which were popular at other undergraduate level (i.e. mostly diplomas and certificates) were computer science, social, economic & political studies and languages. However, at this level and also among first degree students, the most popular specific subject area was business & administrative studies. The large proportion following part-time programmes in combined studies is significantly influenced by The Open University, whose students are enrolled on a combined programme of study. The sciences and engineering & technology had significant numbers of research students, but taught postgraduate courses were dominated by students of business & administrative studies, social, economic & political studies and education. The different patterns of subject participation according to gender and domicile are shown in Table F.
The table shows that women were a significant majority in subjects allied to medicine, and were also very strongly represented among students of biological sciences, veterinary science, social, economic & political studies, librarianship & information science, languages and education. Men were a significant majority in engineering & technology, computer science, architecture, building & planning, and strongly represented in physical and mathematical sciences. Students from outside the UK were well represented in engineering & technology, law, business & administrative studies, architecture, building & planning, languages, agriculture & related subjects and social, economic & political studies.
Expected Length of Study
Table G shows the expected length of the study programme reported for full-time students who commenced studying on programmes leading to first degrees in the academic year 2000/01.
Overall, 66.9% of first year students were following programmes of up to three years duration; 29.6% were on programmes expected to last between three and four years; and 3.5% were following programmes expected to last over four years. There were, predictably, significant differences by subject area. Over 50% of engineering & technology and education students were expected to study for four years, as well as over 40% of students in computer science, agriculture & related subjects and business & administrative studies. Programmes of five or more years were the norm for students of clinical subjects, and also for some students of engineering & technology and architecture, building & planning. It is relevant to consider these figures alongside information about work placements, and therefore the following section looks at sandwich study.
Sandwich Students
In most of the tables of this volume, sandwich students are included within the full-time category. It is however of interest to note that students on sandwich programmes constitute 8.0% of all undergraduates, and they are considerably more prominent within some disciplines.
The following table provides a breakdown by qualification aim and subject area:
As the table indicates, sandwich study is particularly common in the areas of computer science, agriculture & related subjects, architecture, building & planning and business & administrative studies.
Age of Students
Table Ii shows the percentage of students within age groups among first year UK domiciled undergraduates.
20.9% of UK domiciled new students on full-time first degree courses were aged 21 and over; 50.2% of new students on full-time other undergraduate courses were also 21 or over. 60.7% of part-time first degree entrants were 30 or over.
Table Iii presents equivalent information for postgraduates.
Ethnicity
HESA receives from institutions information about the ethnicity of students where this is known. The collection process began in 1994/95 and is therefore now in its seventh year. Ethnicity is known for 88.2% of UK domiciled first year undergraduates and 83.9% of UK domiciled first year postgraduates. In respect of all UK domiciled students (including continuing students), the information is available for 90.5% of undergraduates and 80.1% of postgraduates. Although HESA presents in Table 10b ethnicity information for the student population as a whole, the Agency advises caution in analysis at postgraduate level.
In any case, the latest trend in relation to ethnic minority participation is best judged by considering first year students only: Table J shows the participation rate of ethnic minority students among new undergraduate and postgraduate students.
Overall, ethnic minorities constituted 13.7% of all first year UK domiciled students whose ethnicity was known, and were more strongly represented among full-time undergraduates and taught postgraduates. They were less strongly represented among research students, and among part-time students generally.
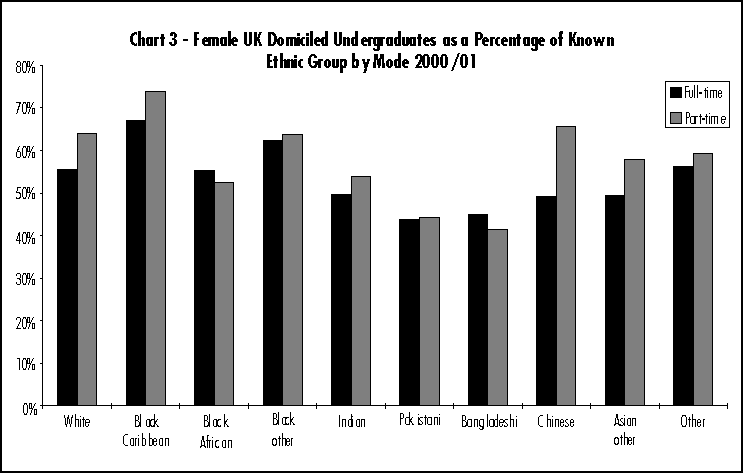
Within the ethnic minority student population there are significant differences in gender participation. The following chart shows, for ethnic minorities among all undergraduates, the gender balance by ethnic group.

Qualifications Obtained
In the 2000/01 academic year, a total of 504,410 qualifications were awarded at HE level. Of these awards, 54.1% were first degrees, with other undergraduate qualifications (including HND/DipHE) making up 16.8%. Postgraduate level qualifications accounted for just over 29% of the total.
Table K gives more detail.
Table L presents a summary of the classification of first degrees awarded and shows the percentage awarded in each classification, by mode of study, domicile and gender.
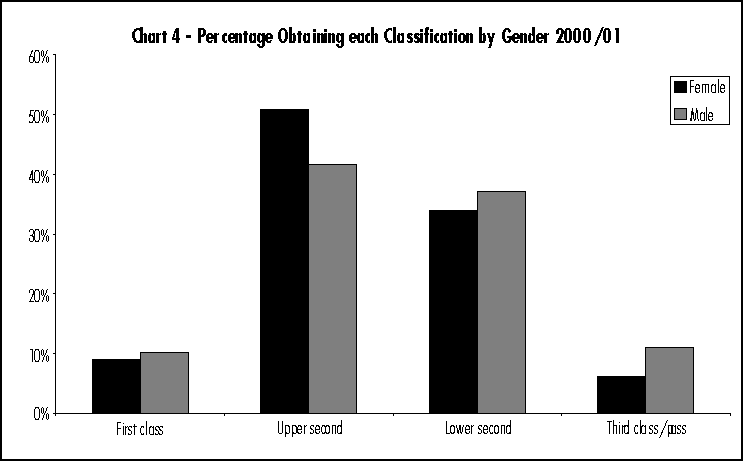
Overall, 56.2% of students of known classification who obtained a classified first degree were awarded first or upper second class honours, with 9.5% being awarded a first. A slightly higher percentage of part-time students than full-time students obtained a first class degree while 7.6% more full-time students obtained an upper second classification. Overseas students obtained a higher proportion of first class degrees but a markedly lower proportion of upper seconds.
Meanwhile fewer female students obtained first class degrees than their male counterparts but a markedly greater proportion obtained upper seconds, as is shown in the following chart.

All of these observations should however be considered in the context of the subject of study. The following table shows the percentage of students obtaining a first or upper second class award in each of the non-clinical subject areas (degrees in clinical subjects are predominantly awarded without classification).
Table M reveals that a considerably greater proportion of first class degrees was awarded in mathematical sciences, engineering & technology and physical sciences - subjects in which we have noted a significant majority of male students (see Table F).
HESA cannot accept responsibility for any inferences or conclusions derived from the data by third parties.
