Introduction - Staff 2014/15
Staff population
The HESA Staff Record covers all academic and non-academic staff who have a contract of employment with a higher education provider (HEP) in the UK, or for whom the HEP is liable to pay Class 1 National Insurance contributions. Other staff, such as those employed under consultancy contracts, or on the basis of payment of fees for services but without a contract of employment, are not included in the record.
The staff return covers data supplied by 163 HEPs; one of the English HEPs, The University of Buckingham, is a non-publicly-funded HE provider voluntarily providing data to HESA. The number of English HE providers in this publication is different from the number reported in some other HESA products because Liverpool School of Tropical Medicine made a separate HESA staff return from 2013/14, previously their HESA staff return was made through The University of Liverpool. Students at Liverpool School of Tropical Medicine were returned to HESA through University of Liverpool in 2013/14 and 2014/15, but will be returned separately from 2015/16.
Throughout this introduction, unless otherwise stated, staff numbers exclude atypical staff. Reporting of atypical staff was changed from the 2012/13 collection with HE providers only obliged to return atypical staff on academic contracts, therefore this publication excludes non-academic atypical staff. All figures provided in the introduction tables and text are based on full-person equivalents (FPE; headcounts) rather than full-time equivalents (FTE; weighted by proportion relative to full-time). Where data has been disaggregated by contract characteristics, such as activity, the FPE figures have been apportioned across the contract(s) held by the staff member.
Table A shows the overall pattern of staffing in UK HEPs, including academic atypical staff. In 2014/15 (that is, on 1 December 2014) there were in total, 403,835 staff (395,780 in 2013/14) in the HE sector, of whom 272,250 were full-time staff (263,050 in 2013/14) and 131,585 part-time staff (132,730 in 2013/14). In addition, there were 75,560 academic atypical staff (75,040 in 2013/14).
The total number of academic staff in 2014/15 was 198,335 (194,235 in 2013/14), an increase of 2.1% between 2013/14 and 2014/15. Of the academic staff, 132,865 (67.0%) were full-time and 65,470 (33.0%) were part-time. Chart 1 below illustrates the distribution of all full-time staff by activity (sourced from Table A).
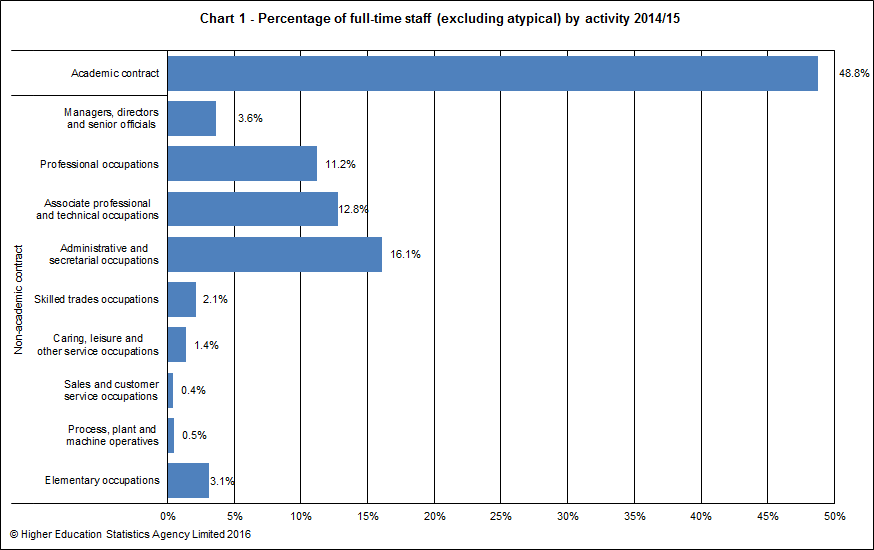
Almost half (48.8%) of the full-time staff population were employed on an academic contract, compared to 49.8% for part-time staff. A further 16.1% of full-time staff were employed within non-academic administrative and secretarial occupations and 12.8% were employed within non-academic associate professional and technical occupations.
Mode of employment and sex
Overall, females made up 54.0% of all staff and 47.2% of the academic atypical staff population. Almost half (47.5%) of all full-time staff and over two-thirds (67.5%) of all part-time staff were female.
For academic staff, the proportion of females was 45.0%. For full-time and part-time academic staff, the proportion of females were 40.0% and 55.1%.
Chart 2 below provides the proportions by sex and activity of full-time staff (sourced from Table A).
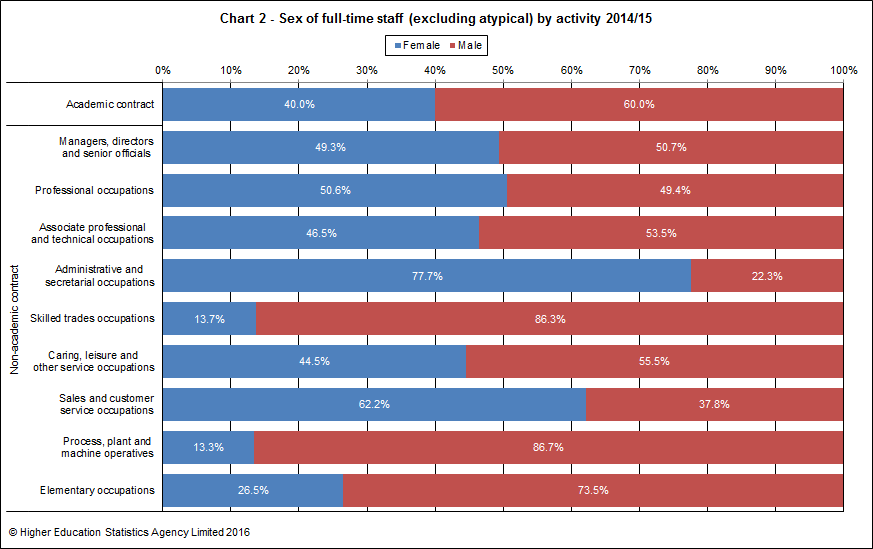
Chart 3 provides equivalent data to Chart 2, but for part-time staff (sourced from Table A).
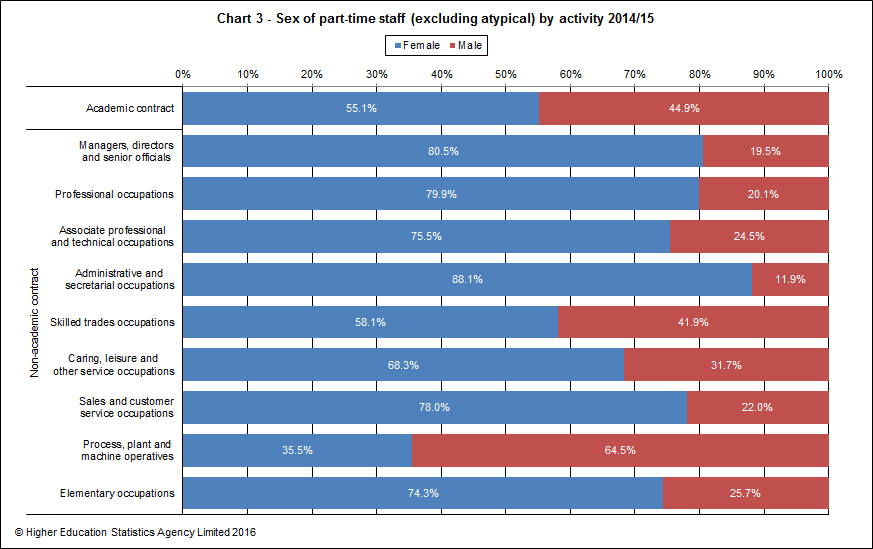
Across all activities, there were higher proportions of female part-time staff than male part-time staff, except amongst process, plant and machine operatives for which there were 35.5% females compared to 64.5% males.
Table B and Table C respectively provide a breakdown of academic and non-academic staffing in HE. Atypicals have been excluded from these tables as the majority of the data is not collected for atypical staff.
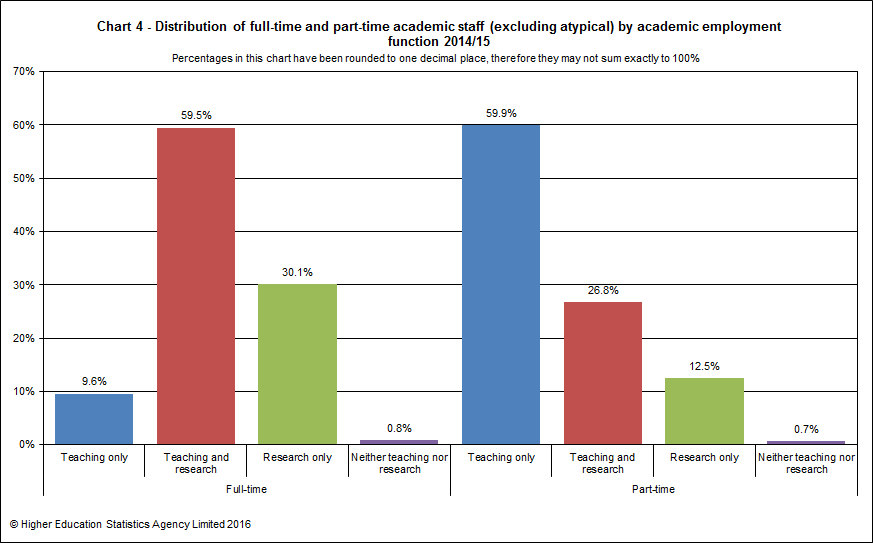
Chart 4 below provides the proportions of full-time and part-time academic staff by academic employment function (sourced from Table B). Most full-time staff were in teaching and research (59.5%) whereas part-time staff had a majority in teaching only (59.9%).
Salary
The salary ranges have been defined with reference to the nationally negotiated pay spine for non-clinical staff. Salaries for part-time staff are not reported to HESA as pro-rata amounts but as salaries scaled up to full-time equivalent rates.
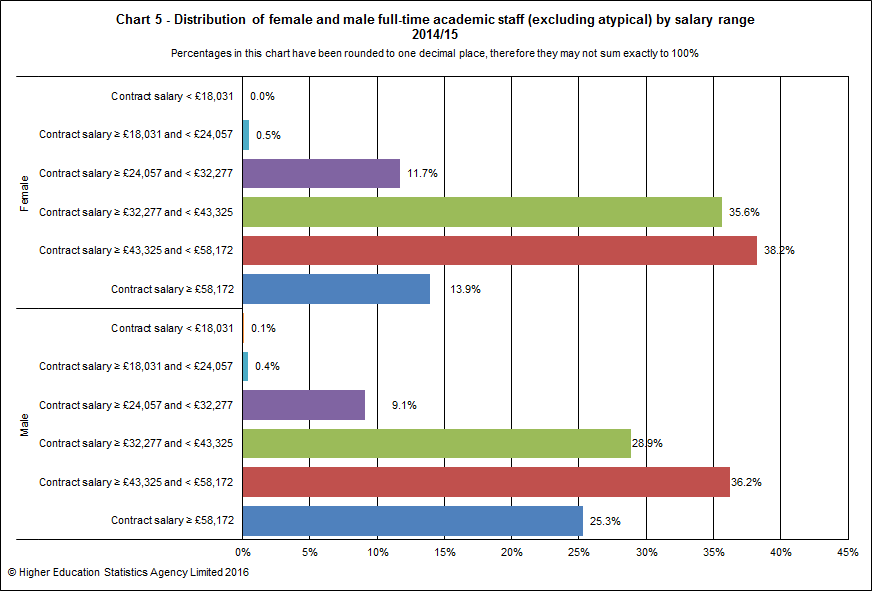
The highest proportion of full-time academic staff (37.0%) had contract salaries between £43,325 and £58,172. This differed for part-time academic staff with just under half (43.3%) having lower contract salaries between £32,277 and £43,325.
Chart 5 below illustrates the distribution of female and male full-time academic staff by salary range (sourced from Table B). Higher proportions of male full-time academic staff (25.3%) had contract salaries of £58,172 or over than female full-time academic staff (13.9%).
The total number of non-academic staff employed by UK HEPs was 205,500. Of these, 139,385 or 67.8% were in full-time employment.
Just over half, 53.9%, of full-time non-academic posts were managerial, professional and technical. Of the non-academic part-time staff, 31.3% were in managerial, professional and technical posts and 36.1% were in clerical posts.
Chart 6 below provides the distribution of staff within each activity group by salary range (sourced from Table B and Table C).
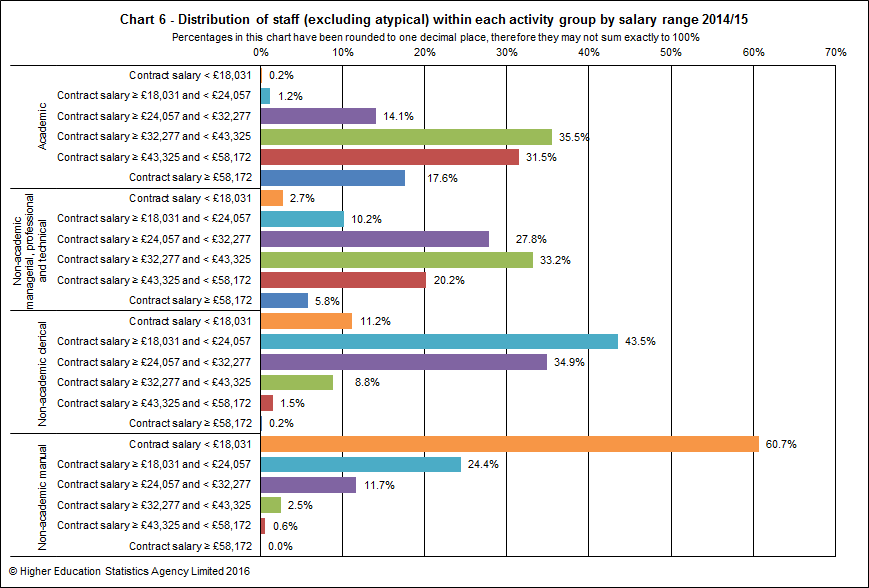
Higher proportions (84.5%) of academic staff had contract salaries in the top three salary ranges compared to non-academic staff (31.8%). Similar proportions of academic staff (35.5%) and non-academic managerial, professional & technical staff (33.2%) had contract salaries between £32,277 and £43,325. The majority (60.7%) of manual staff had contract salaries less than £18,031. Over two fifths (43.5%) of clerical staff had contract salaries between £18,031 and £24,057.
Academic staff headcount 2013/14 to 2014/15
Table D provides a headcount (rather than full-person-equivalent headcount used in all other contexts) of academic staff linking between the staff records for 2013/14 and 2014/15 with a view to illustrate the number of academic staff who take up and leave academic posts at HEPs.
For the purpose of this table only, full-time academic staff are those members who spend at least 50% of their time engaged in full-time academic contracts. Similarly, part-time academic staff are those members who spend at least 50% of their time engaged in part-time academic contracts. This results in academic staff numbers that are slightly different from those given in Tables B and C. Data given in Table D also differs from that given in the main tables 20-22 which are based on staff contracts rather than headcount.
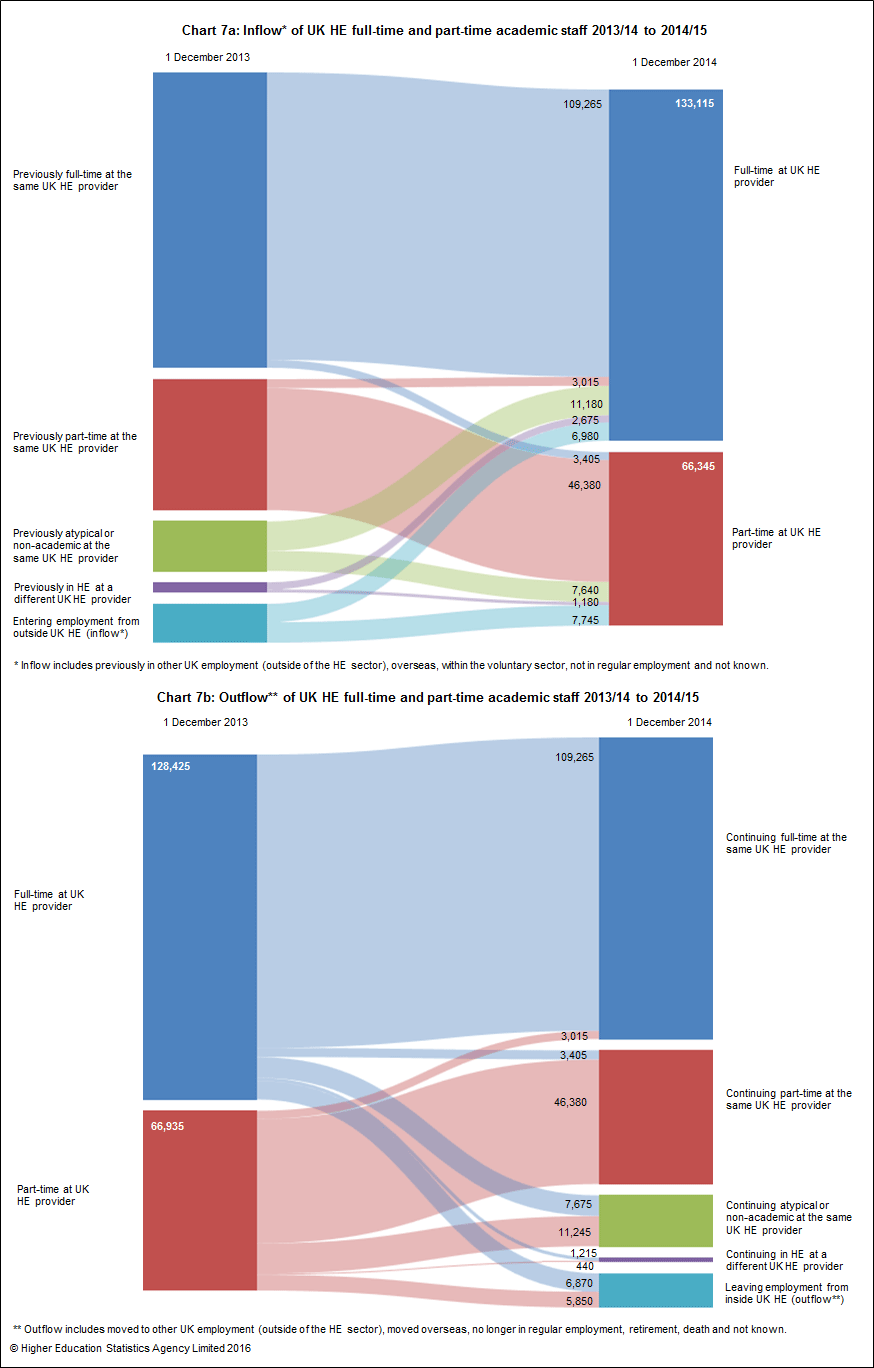
The (headcount) number of full-time academic staff has increased from 128,425 to 133,115 from 2013/14 to 2014/15, an increase of 3.7%. The number of part-time academic staff decreased from 66,935 to 66,345 (-0.9%) during this time.
Staff inflow counts the number of academic staff as at 1 December 2014 who were not identified as being at a UK HEP on 1 December 2013. Staff outflow counts the number of academic staff as at 1 December 2013 who were not identified as being at a UK HEP on 1 December 2014.
The inflow of staff into full-time academic posts was lower (6,980 staff; 5.2%) than the inflow into part-time academic posts (7,745 staff; 11.7%). The outflow of staff from both full-time and part-time academic posts was lower (6,870 full-time staff; 5.3% and 5,850 part time staff; 8.7%) than the inflow.
Chart 7a and 7b below illustrates the inflow and outflow, broken down by previous employment and leaving destination respectively, of full-time and part-time academic staff. High proportions of unknowns, particularly amongst the leaving destination, mean that caution must be exercised when analysing this data.
Age of academic staff
Table E presents the age distribution of full-time academic staff (excluding atypical) by salary range.
Of those staff whose age was known, 41.1% were aged 46 and over.
The average age of full-time academic staff was 43 and of part-time academic staff was 46 (sourced from Table 3a). The average age of academic atypical staff was 40 (sourced from Table 3b).
Chart 8 provides the distribution of full-time academic staff by contract salary and age group (sourced from Table E.
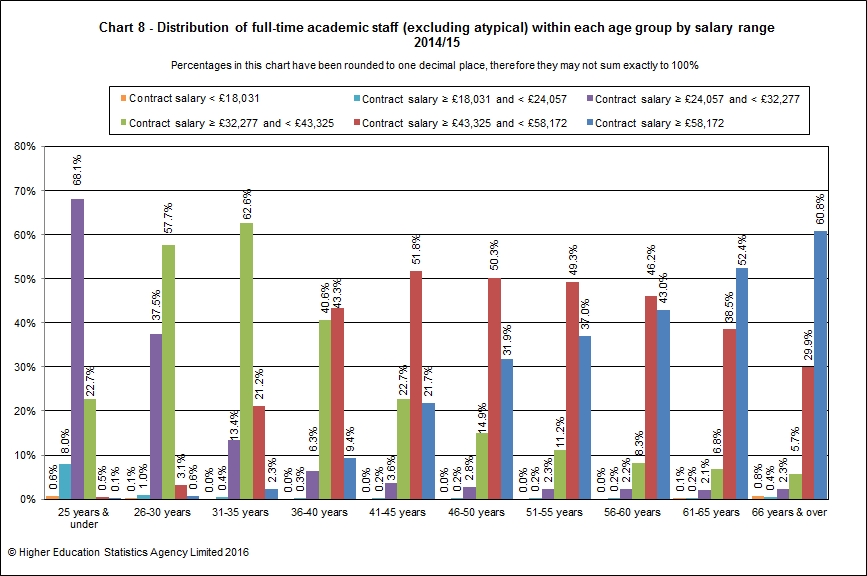
In the 25 and under age group, 68.1% of full-time academic staff earned a contract salary between £24,057 and £32,277 whereas the majority (62.6%) of the 31–35 age group earned a salary between £32,277 and £43,325. In the 41–45 age group, the majority (51.8%) of full-time academic staff earned a salary between £43,325 and £58,172. In the top two age groups, 61–65 years and 66 years & over, 52.4% and 60.8% respectively earned a contract salary of £58,172 or more.
Ethnicity of all staff
In Table F ethnicity is shown broken down by activity standard occupational classification group and mode of employment. The ethnicity data within this introduction refers to staff of all nationalities.
Of all staff (excluding atypical), 93.1% reported their ethnicity. The response rate varied slightly by activity group and mode of employment. These percentages ranged from 90.2% for part-time academic staff to 95.3% for full-time clerical staff. Among staff of known ethnicity, the proportion from ethnic minority groups varied, with greater representation among academic staff at 13.9% than among non-academic staff at 10.4%.
Ethnicity was reported for over two-thirds (70.2%) of academic atypical staff. Of those academic atypical staff of known ethnicity, 17.2% were from ethnic minority groups.
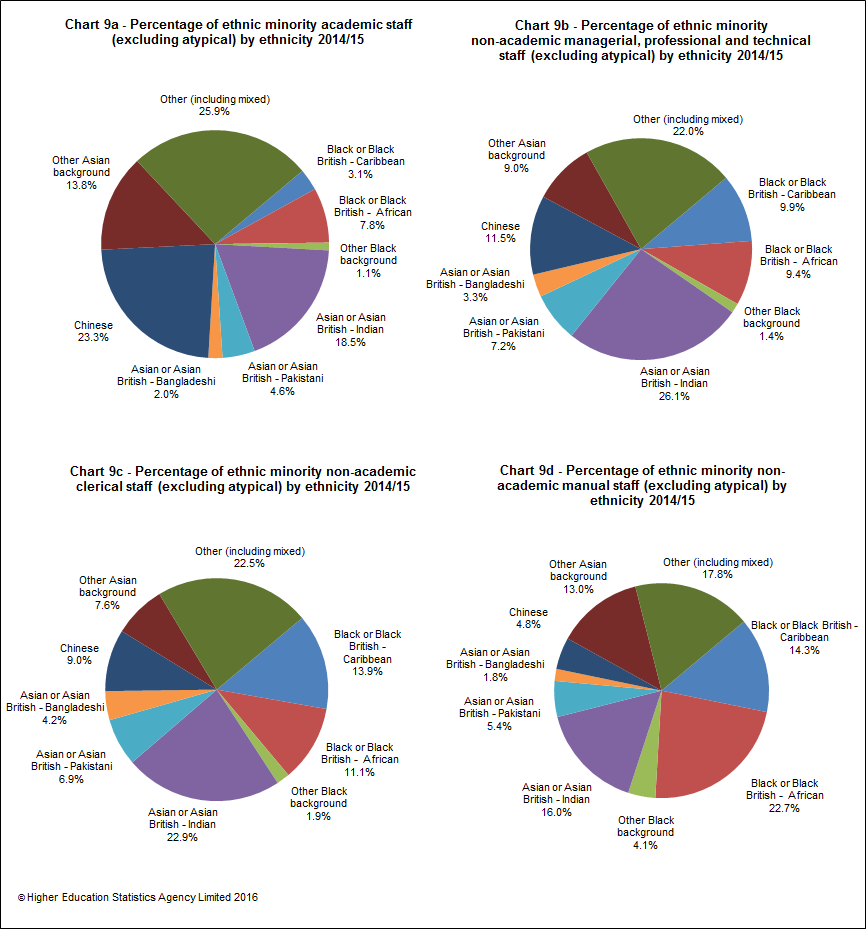
Table G provides the ethnic breakdown of staff by activity standard occupational classification group for all ethnic minority staff, including academic atypical. The chart series 9 below illustrate the data from Table G in pie chart format for all staff, excluding atypical.
Disability of all staff
Table H presents information on disability by activity standard occupational classification group and mode of employment for all staff, in a similar style to Table F.
Disability status was reported for 96.2% of all staff (excluding atypical). Of those of known disability status, 4.7% declared a disability. For academic staff, the percentages were 96.0% reported and 4.1% declared disabled. For academic atypical staff the percentages were 92.5% reported and 2.4% declared disabled.
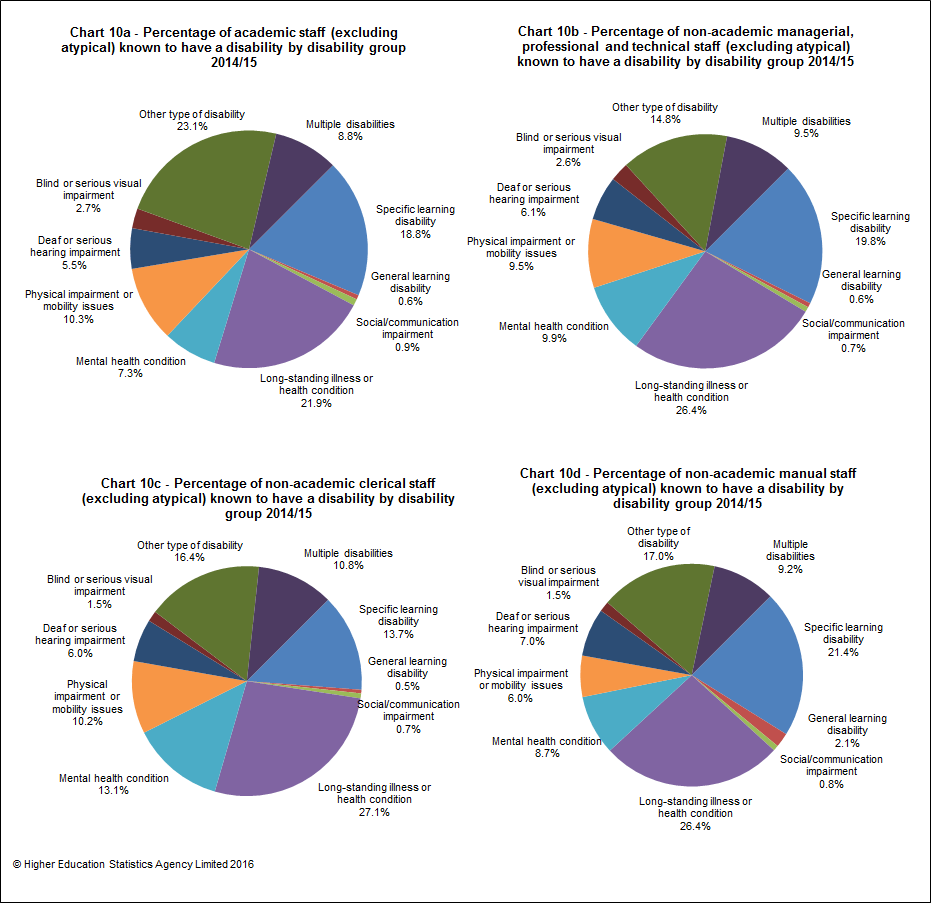
Table I provides a disability breakdown, based on the staff members’ own assessment, by activity standard occupational classification group. The chart series 10 below illustrate the data from Table I in pie chart format for all staff, excluding atypical.
Clinical status, contract level, sex and source of basic salary of full-time academic staff
Table J provides data on full-time academic staff (excluding atypical) by clinical status, contract level, sex and source of basic salary. Of all full-time academic posts, 70.2% were wholly financed by the HE providers themselves.
The proportion of women among full-time clinical academic professors was 19.3% and among full-time non-clinical academic professors was 23.6%. Figures for those recorded as full-time other senior academics shows that 24.4% were clinical and 34.0% were non-clinical. Of those staff who were on other contracts, 44.5% of full-time clinical academic staff were female and 42.6% of full-time non-clinical academic staff were female.
43.1% of full-time clinical academic staff were wholly financed by the HE provider compared with 71.5% of non-clinical full-time academic staff. This reflects the greater prevalence of joint funding arrangements for clinical staff such as joint contracts involving the NHS.
Of all full-time clinical academic staff, 24.1% were professors compared with 11.4% of non-clinical full-time academic staff.
Cost centre and sex of full-time academic staff
The data in Table K provides a breakdown of full-time academic staff (excluding atypical) by cost centre group, source of basic salary and sex.
Overall, 29.8% of full-time academic staff were not wholly financed by the HE provider. Just under half (47.3%) of full-time academic staff in medicine, dentistry & health and 46.0% in biological, mathematical & physical sciences were not wholly financed by the HE provider. Academic cost centre groups with the lowest proportions of full-time, academic staff who were externally funded were in the areas of design, creative & performing arts 3.3%, administrative & business studies 5.3% and education 6.9%.
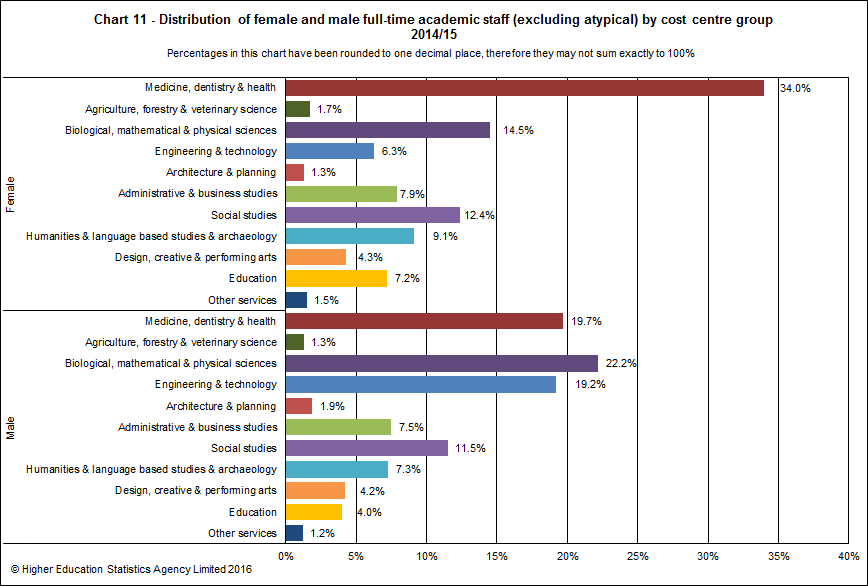
Chart 11 below provides the proportions by sex and cost centre group of full-time academic staff (sourced from Table K). Over a third (34.0%) of female full-time academic staff were employed within the medicine, dentistry & health cost centre group compared to just under a fifth (19.7%) of males. In contrast, over three times the proportion of males (19.2%) than females (6.3%) were employed in the engineering & technology cost centre group.
Pattern of employment of academic staff
Table L shows academic staff (excluding atypical) by academic employment function, sex, mode of employment and terms of employment.
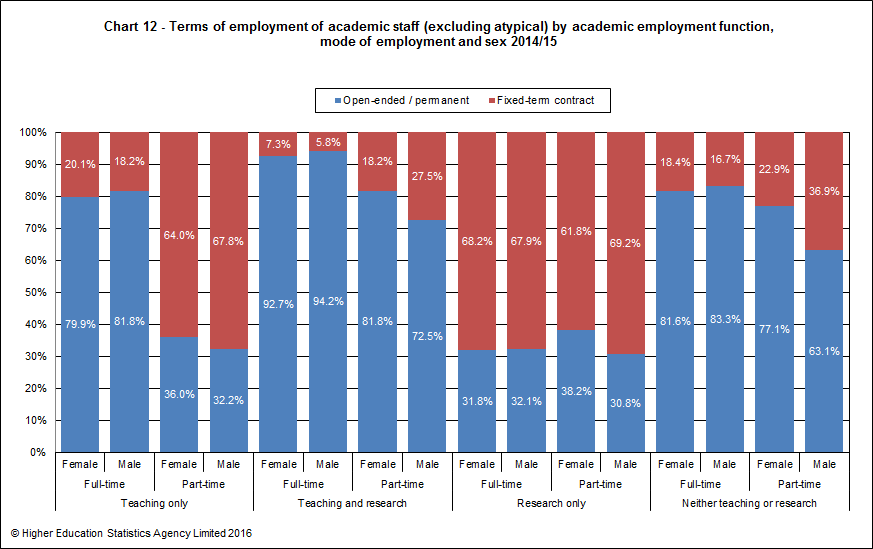
Among staff who only had teaching responsibilities, the majority of full-time staff were on open-ended/permanent contracts, 79.9% female and 81.8% male, whereas the majority of part-time teaching only staff were on fixed-term contracts, 64.0% female and 67.8% male. Of the staff with both teaching and research responsibilities, 93.7% of full-time staff were on open ended/permanent staff contracts. The opposite was true of research only staff, who had a high proportion of fixed-term contracts in both full-time females (68.2%) and males (67.9%). This was also true for part-time females (61.8%) and males (69.2%).
Chart 12 below illustrates the proportions of open-ended/permanent and fixed-term contract academic staff by academic employment function, mode of employment and sex.
© Higher Education Statistics Agency Limited 2016
