Introduction - Students 2014/15
Student population
2.3 million students were studying for a qualification or for credit at 162 HE providers in 2014/15. Of these HE providers, 161 were publicly-funded and one, The University of Buckingham, was privately funded.
The total number of HE enrolments at UK HE providers stood at 2,266,075 in 2014/15, a decrease of 1.4% from 2013/14. Postgraduate enrolments decreased by 0.2% and undergraduate enrolments decreased by 1.8% between 2013/14 and 2014/15. Full-time enrolments increased by 0.1% while part-time enrolments showed a decline of 5.7% over the same period.
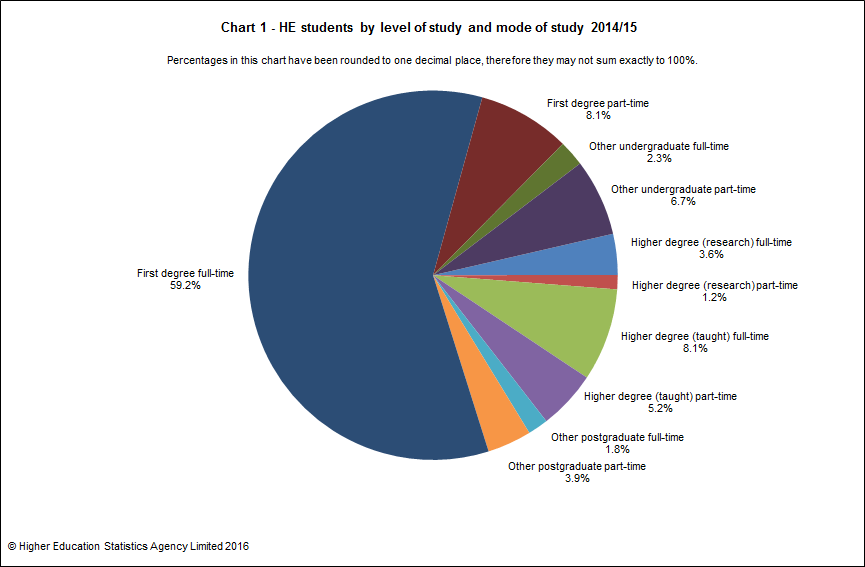
Table A provides the numbers and proportions of HE students studying at each level with comparisons between full-time and part-time. Almost three-quarters (74.9%) of the 2,266,075 HE students were following a full-time or sandwich course, referred to in the rest of this publication as full-time. Over half of all students (59.2%) were following a full-time first degree course. It can be seen that a much higher proportion of full-time students were studying for a first degree than that of part-time students who were more likely to be studying for another type of undergraduate qualification.
Chart 1 below illustrates the breakdown of HE students by level and mode of study (sourced from Table A).
Sex
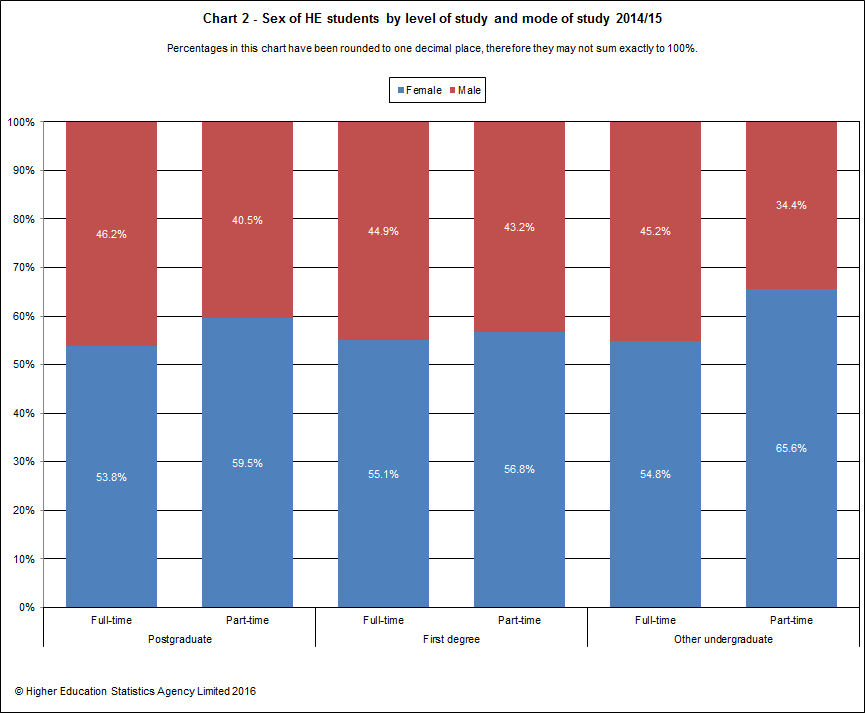
A higher proportion of female students (56.2%) than male students (43.8%) were studying in HE in the UK. This sex imbalance was more pronounced among students studying part-time of whom 60.3% were female. Amongst all other undergraduate students, nearly two-thirds (62.9%) were female and for all other postgraduates the figure was 66.7%.
Chart 2 below shows the sex breakdown of HE students by level of study and mode of study (sourced from Table C and Table D).
Domicile
Although a large proportion of students studying in the UK were domiciled from the UK before they entered Higher Education (80.7%), a further 5.5% were from other countries within the European Union (EU) and 13.8% were from countries outside the EU. These proportions varied by level of study. Over a third (38.0%) of postgraduate students were from outside the UK compared to only 13.4% of undergraduates. Other EU postgraduate students comprised of 8.6%, whilst undergraduates consisted of 4.5% and the corresponding figures from Non-EU countries were 29.4% for postgraduate students and 8.9% for undergraduate students.
Over half (58.0%) of all full-time postgraduate students were from outside the UK, with 46.3% of full-time postgraduates coming from outside the EU. Non-UK domiciled postgraduate students were prominent on full-time research higher degree courses (50.7%) and even more so on full-time taught higher degree courses (71.2%).
Among part-time students the proportion of non-UK domiciled students was much lower than for full-time students (7.9% compared to 23.1%). Table B provides a summary of students by domicile and sex.
Undergraduates account for over three-quarters (76.3%) of the overall HE student population, however, this proportion varied by domicile. Students from the UK had the largest proportion of undergraduate students at 81.8%, while 62.9% of students from other EU countries were undergraduates and less than half (49.3%) of students from non-EU countries were on undergraduate courses.
Among undergraduate students from outside the UK, the highest proportions came from Asia (42.7%) and the EU (33.8%). The next highest proportions were from Africa (6.4%), the Middle East (5.7%) and North America (5.1%). Table 8 of this publication gives details of the Non-UK countries with the highest numbers of students studying in the UK.
Chart 3 below shows the proportions of non-UK domiciled undergraduate students by region of domicile (sourced from Table D). Table C and Table D provide a more detailed breakdown of the postgraduate and undergraduate populations.
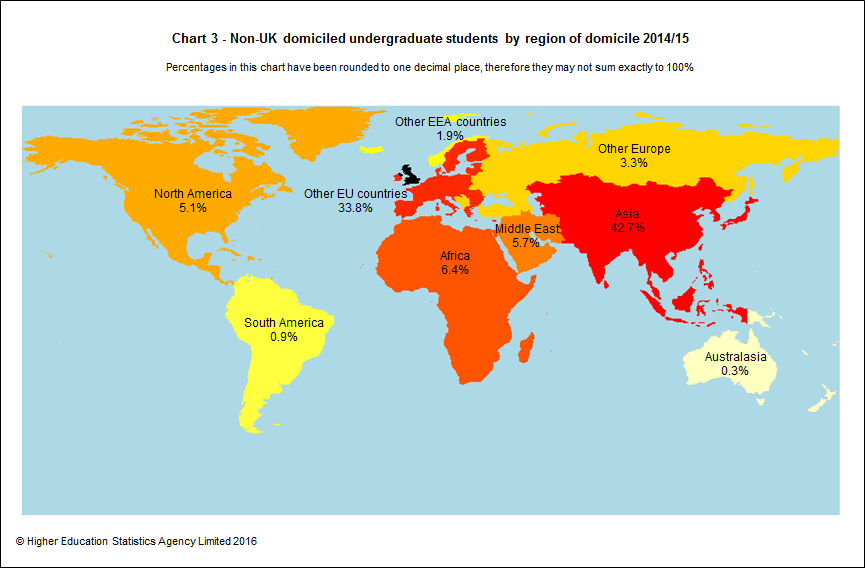
Although females were in the majority across the whole student population, this was not the case for all geographic regions. For UK domiciled students, 57.2% were female, the third highest proportion after Other European Economic Area (64.5%) and North America (61.2%) (sourced from Table B). The lowest proportions of females were observed among students from Africa (42.3%) and the Middle East (37.1%).
Chart 4 below shows the considerable sex variations apparent in the breakdown of HE students by both level of study and domicile (sourced from Table C and Table D).
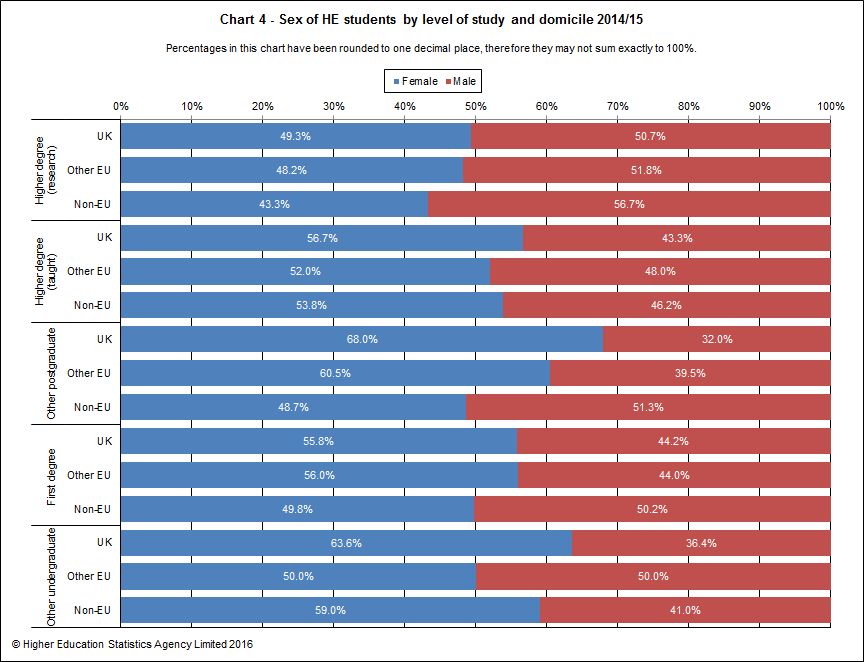
According to Chart 4, across all levels of study and all domiciles, the proportion of female students was highest for UK domiciled students. Over two-thirds (68.0%) of UK domiciled other postgraduates were female and 63.6% of UK domiciled other undergraduates were female.
Of UK domiciled undergraduates, 56.8% were female. The figure for other EU was 55.6%. Other European Economic area countries had the highest proportion of undergraduates who were female at 67.4% followed by North America at 65.4% and the Middle East had the lowest proportion at 34.6%.
Just under three-quarters (74.9%) of students on courses below first degree level were studying on a part-time basis. Subject of study is an important factor in explaining the high proportion of females on courses below first degree level, as illustrated in the following section.
Subject of study
Table E shows the percentages of students at different levels who were following courses in each of 19 subject areas. A detailed explanation of the subject areas, and the way in which student numbers are apportioned between them, may be found in the definitions.
There are two figures at the ‘Other undergraduate’ level that are worthy of comment, those for subjects allied to medicine and combined. The high proportion in subjects allied to medicine can be explained because a qualification below first degree level is often standard in many health-related professions. Many Open University students may not initially have to declare their award intention and are reported as studying for HE provider credit in the combined subject area.
Table F shows that the proportion of part-time students varied greatly by subject area. At 92.6% almost all students in the combined subject area were part-time; again, this is attributable to the way Open University students are reported. The other area with a high proportion of part-time students was education, at 47.9%.
Chart 5 below provides the numbers of HE students by subject area and level of study (sourced from Table E).
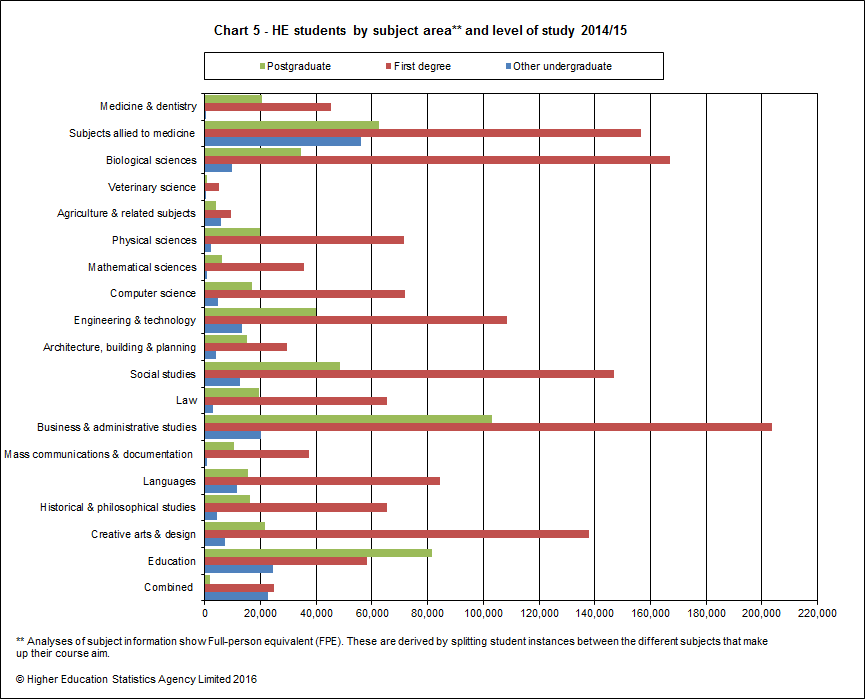
Similarly, the proportion of female students was heavily subject-dependent, with wide divergence from the overall figure of 56.2%. Subject areas with a high proportion of females included subjects allied to medicine (79.4%), veterinary science (76.2%), education (76.0%) and languages (69.5%). Subject areas with a low proportion of females included architecture, building & planning (36.0%), computer science (17.2%) and engineering & technology (16.7%).
Students from outside the UK were well represented in business & administrative studies (38.4%), engineering & technology (33.1%), law (26.3%), architecture, building & planning (25.4%) and mass communications & documentation (23.0%).
Age of students
Table G shows the proportion of first-year UK domiciled postgraduates in each age group. 58.8% of full-time students from this cohort were 21-24 years old. 66.5% of part-time first year UK domiciled postgraduate students were aged 30 and over.
Table H provides equivalent information for undergraduates. 20.5% of UK domiciled entrants on full-time first degree courses were aged 21 and over and 55.1% on full-time other undergraduate courses were aged 21 and over. 50.4% of UK domiciled part-time first degree entrants were aged 30 or over.
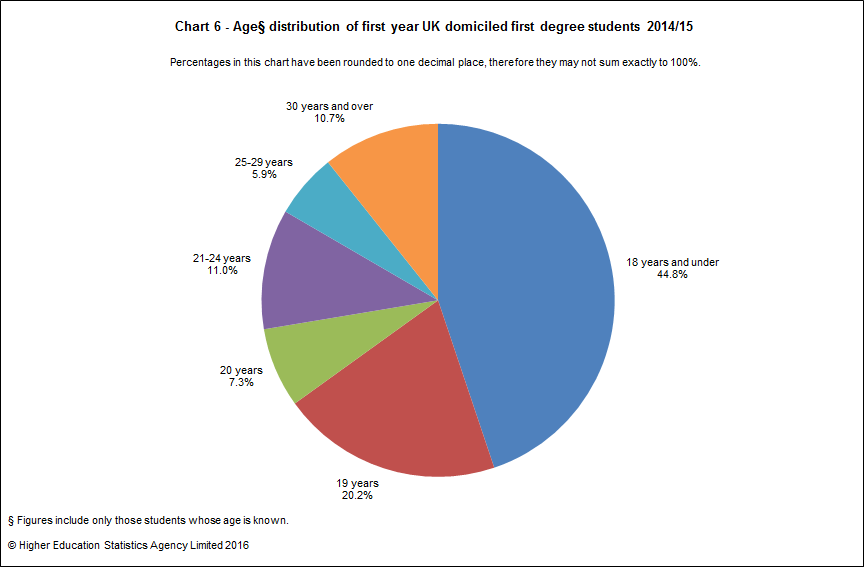
Chart 6 below illustrates the age distribution of first year UK domiciled first degree students (sourced from Table H).
Ethnicity
Ethnicity is recorded using the categories available for the 2011 Census (details can be found in the Definitions section). These categories are then amalgamated following Office for National Statistics guidelines into the smaller number of categories shown in Table J and in Table 13 of the main tables. The coding frame is designed to describe patterns of ethnicity within the UK domiciled population; information on ethnicity is required by HESA only for students of UK domicile.
Ethnicity is known for 97.9% of UK domiciled first-year undergraduates and 96.7% of UK domiciled first-year postgraduates. Participation in HE by students from ethnic minorities continues to increase overall. 21.2% (20.4% in 2013/14) of all UK domiciled first-year students of known ethnicity are from ethnic minorities and for full-time first degree students the figure is 24.5% (23.8% in 2013/14).
Table I provides the percentage of first year UK domiciled ethnic minority students by mode and level of study.
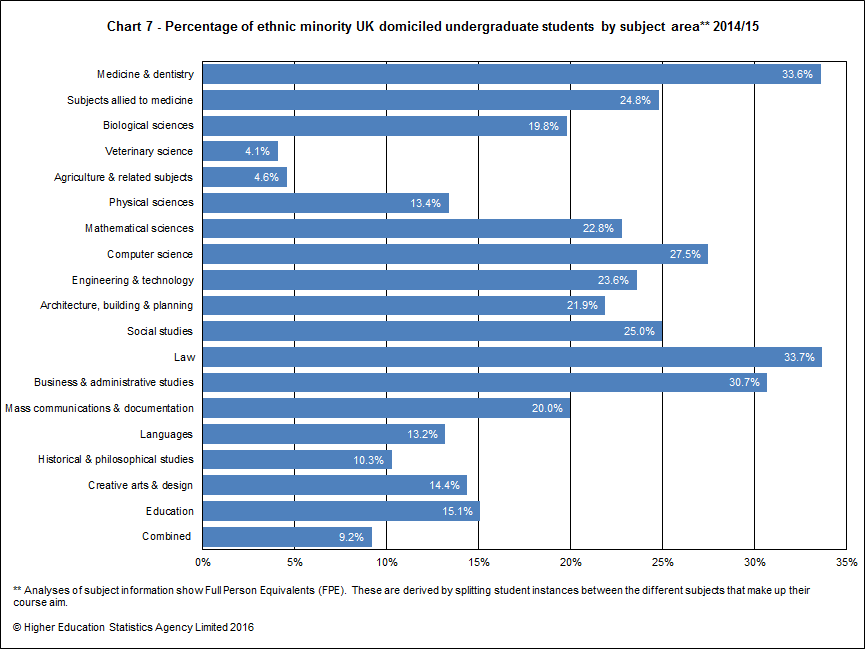
There are substantial differences in participation of ethnic minorities across subject areas, ranging from 4.1% (veterinary science) to 33.7% (law), which are published in Table J and Chart 7 below (sourced from Table J).
Qualifications obtained
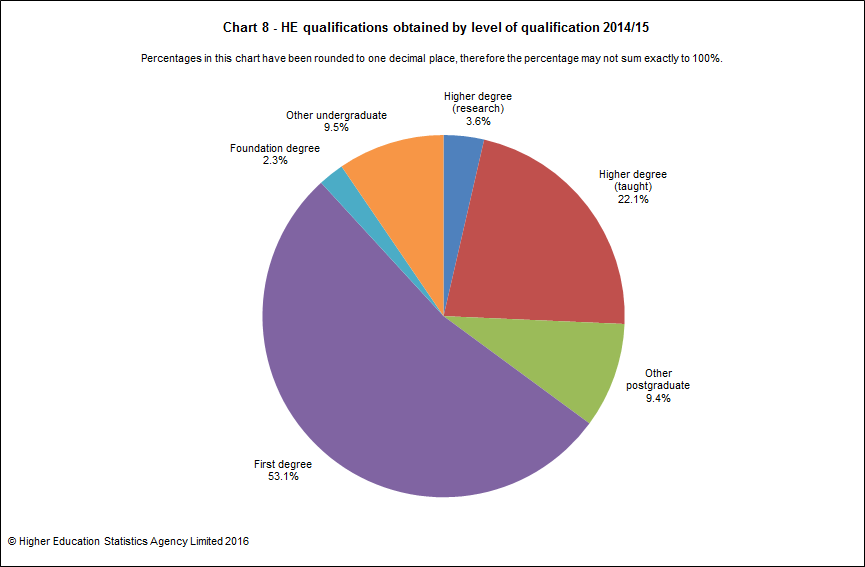
In 2014/15 a total of 745,005 qualifications were awarded at HE level to students in publicly-funded HE providers (together with The University of Buckingham). Of these, 35.1% were at postgraduate level, 53.1% were undergraduate first degree qualifications and 11.8% were other undergraduate qualifications. 16,875 foundation degrees were awarded, 2.3% of the total. Table K provides a more detailed breakdown.
Chart 8 below provides a breakdown of HE qualifications obtained by level of qualification (sourced from Table K).
26.9% of all HE qualifications were awarded to non-UK domiciled students. This figure rose to 62.5% of all taught higher degrees awarded.
Table L provides a breakdown of the class of award for first degree qualifications.
Of students who obtained a classified first degree, 22.0% were awarded first class honours and 71.5% were awarded either first or upper second class honours.
Chart 9 below shows class of first degree percentages split by sex, mode of study and domicile (sourced from Table L). The proportion of first class honours did not vary significantly by sex, but the proportion of upper second class honours was greater for female students (51.7%) than for male students (46.6%). The proportions of both first and upper second class honours varied by domicile and mode.
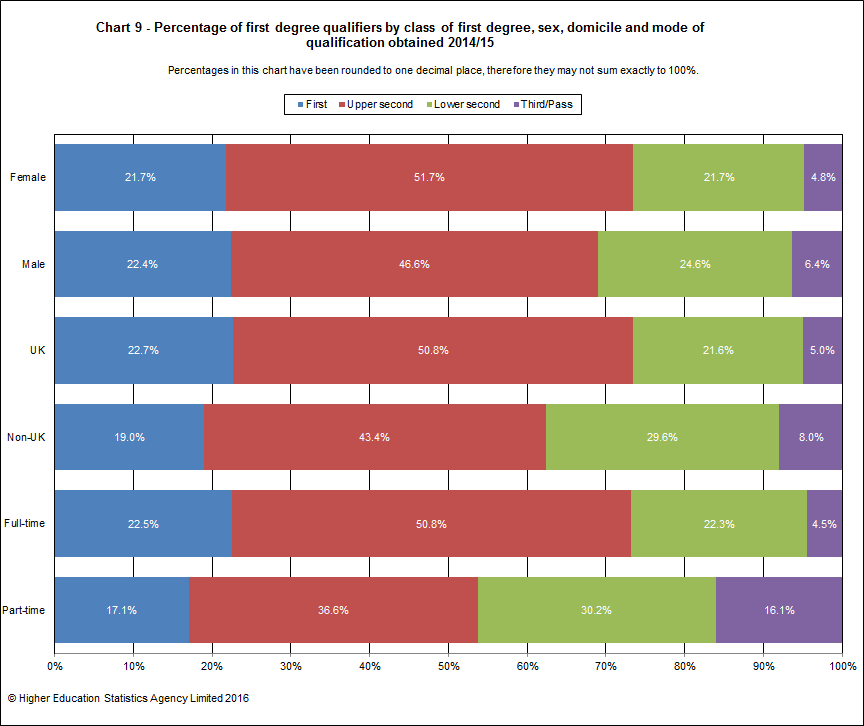
Table M shows that there was considerable variation by subject area in the proportions of different classes of degrees that were awarded. This table excludes the clinical subject areas medicine & dentistry and veterinary science, in which the majority of degrees awarded are not subject to classification.
The sex, mode and domicile proportions vary greatly across subject areas (see Table F), and therefore it is not meaningful to analyse class of degree without accounting for subject choice.
Flows between administrations
The main tables provide figures showing student mobility within the UK for all UK domiciled students. However, the figures for postgraduate students should be interpreted with caution because the domicile will often reflect the location of undergraduate study rather than the original ‘domestic’ domicile. Part-time students display little mobility and thus Table N focuses on full-time undergraduates.
Chart 10 below provides the percentage of full-time UK domiciled first degree students studying in each region by domicile (sourced from Table N).
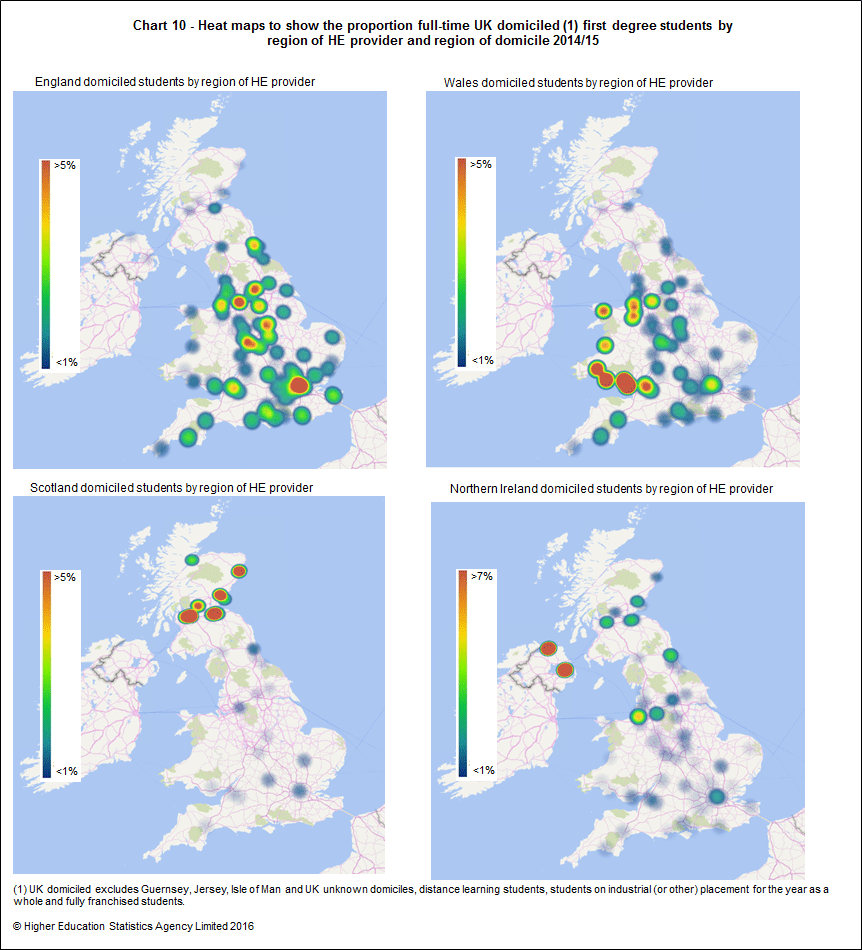
95.1% of full-time first degree students domiciled from England studied in their country of domicile; the corresponding figures for the other UK home nations were 59.5% for Wales, 95.4% for Scotland and 69.4% for Northern Ireland.
English and Scottish domiciled first degree students displayed little mobility in proportionate terms. However, in absolute terms England contributed nearly half of the students studying in Wales and more than one-eighth of those in Scotland. Outward mobility from Wales and Scotland was almost entirely to England and over two-thirds of outward mobility from Northern Ireland was to England, with almost all the remaining balance to Scotland.
Just under half, 48.1%, of full-time first degree students domiciled from London remained in London to study while the flow into London from other regions in England was 62,170, representing 8.2% of the total for other regions of England. Table series 7 in the main body of the publication provides a full breakdown of mobility between English regions and UK countries.
At full-time other undergraduate level there was less mobility in England and Wales than at the first degree level: the corresponding percentages for study in the country of domicile were 98.2% for England, 86.9% for Wales while the Scottish figure was similar at 94.9%. The equivalent figure of 64.3% for Northern Ireland at first appears anomalous when compared to the other administrations. This is due to a much smaller level of full-time other undergraduate provision at Northern Ireland HE providers.
Offshore provision
‘Offshore provision’ is the term used to describe study taking place entirely outside the UK. However, where the students are either registered at a UK HE provider, or are registered with a partner organisation in the country of study but are working towards a HE qualification awarded by a UK HE provider, such students are termed ‘offshore students’.
It should be noted that in 2014/15, students registered at Oxford Brookes University accounted for 42.7% of the total population of the Aggregate offshore record (AOR). The majority of these students were registered with an overseas partner on Association of Chartered Certified Accountants (ACCA) courses.
Table O provides a breakdown by level of provision, the region of provision and type of activity, and is disaggregated between EU and non-EU provision.
In 2014/15 there were 663,915 offshore students, of which 11.3% (75,270) were studying within the EU and 88.7% (588,645) outside it.
Chart 11 below illustrates the proportions of students studying wholly overseas by region of provision and type of activity (sourced from Table O).
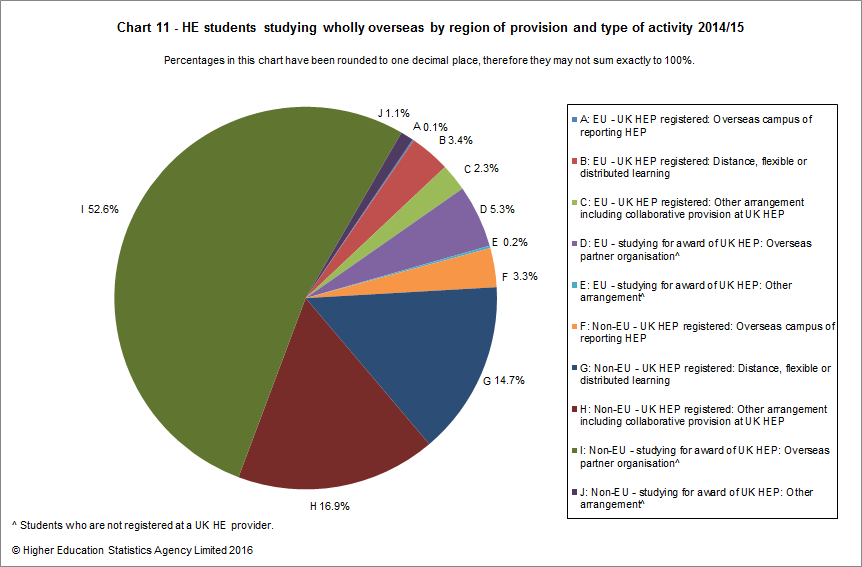
Within the EU, the largest numbers of students were registered at a UK HE provider (51.6%). Distance learning appeared to be the most common form of provision for these students, accounting for 58.5% of the group. The number of students at overseas campuses within the EU was relatively small at only 780 students (675 students in 2013/14). Overseas partnership arrangements, in which students are not registered at, but are studying for awards of, a UK HE provider accounted for 46.7% of EU offshore students. With regard to level of study, a high percentage of EU offshore students were studying at first degree level (66.2%). The majority of these were through other arrangements including collaborative provision (19.8%) and partnership arrangements where the students are studying for an award of a UK HE provider (62.0%).
Outside the EU the pattern was slightly different, with the majority of students studying for an award of, but not registered with, a UK HE provider (60.6% of non-EU offshore students), most of these at overseas partner organisations. Of those students who were registered with a UK HE provider 48.4% were studying by other arrangement including collaborative provision and 42.2% were studying by distance learning. Overseas campus arrangements were more common for non-EU than EU offshore students, with 9.5% of non-EU students falling into this category. Referring to level of study, the vast majority of non-EU offshore students were studying first degrees (81.5%), with by far the largest concentration in overseas partner organisations (69.6% of all non-EU first degree offshore students).
Table P shows the breakdown by level of study for the 20 countries with the largest number of students in offshore provision. Almost three-quarters (71.4%) of all offshore provision was concentrated within these countries. The largest numbers of students were observed within Malaysia, China, Singapore and Pakistan which between them accounted for over one-third (34.0%) of all HE offshore students. Only two EU countries appeared within the top 20: Ireland and Greece.
© Higher Education Statistics Agency Limited 2016
